IOP Conference Series: Materials Science and Engineering
PAPER • OPEN ACCESS
Data Collection Methodology to Assess Road Pavement Condition Using
GNSS, Video Image and GIS
To cite this article: Bertha Santos et al 2019 IOP Conf. Ser.: Mater. Sci. Eng. 603 042083
Content from this work may be used under the terms of theCreative Commons Attribution 3.0 licence. Any further distribution of this work must maintain attribution to the author(s) and the title of the work, journal citation and DOI.
Published under licence by IOP Publishing Ltd
WMCAUS 2019
IOP Conf. Series: Materials Science and Engineering 603 (2019) 042083
IOP Publishing doi:10.1088/1757-899X/603/4/042083
1
Data Collection Methodology to Assess Road Pavement
Condition Using GNSS, Video Image and GIS
Bertha Santos 1, Pedro G. Almeida 2, Leonor Maganinho 3
1 Calçada Fonte do Lameiro, Department of Civil Engineering and Architecture, University of Beira Interior & CERIS-CESUR ECI/04625, 6200-358 Covilhã, Portugal
2 Calçada Fonte do Lameiro, Department of Civil Engineering and Architecture, University of Beira Interior & GEOBIOTEC UID/GEO/04035/2013, 6200-358 Covilhã, Portugal
3 Calçada Fonte do Lameiro, Department of Civil Engineering and Architecture, University of Beira Interior, 6200-358 Covilhã, Portugal
Abstract. Traffic loads, along with the environment, damage pavement over time. The
degradation of pavement quality is reflected in the development of a diversity of pavement distresses, such as cracking, deformation or deterioration. These distresses may occur on the surface and/or in the pavement structure, having a determinant role in pavement’s quality. Aiming to increase the degree of reliability of the pavement distress data and reduce pavement observation time and visual inspection operations cost, this work presents the main steps proposed for a methodology to observe, record and evaluate flexible road pavement distresses to assess the quality of road pavements. This methodology is based on an in-vehicle inspection using GNSS and video image capture devices and in the use of Geographic Information System (GIS). Validation of the proposed methodology was made through a case study by comparing the results obtained on the in-vehicle inspection to those from a traditional visual inspection performed on foot. The similarity of results obtained by the two approaches allowed to conclude about the feasibility of the proposed methodology. Among the main advantages of the proposed methodology a highlight is on the possibility to identify, quantify and locate the most severe pavement distresses through the use of spatial tools available on GIS, producing information maps and reports that can be used in the decision-making process about road pavements rehabilitation and conservation.
1. Introduction
The correct knowledge of road pavements condition is essential to the proper operation of any Pavement Management System (PMS). Currently, these systems take into account technical and economic aspects of road projects, incorporating procedures for collecting, analysing, maintaining, and reporting pavement data with the purpose of defining road investment over the life cycle of the infrastructure, exploring the best strategies for the network conservation at least costs for a given level of serviceable condition [1] [2] [3].
WMCAUS 2019
IOP Conf. Series: Materials Science and Engineering 603 (2019) 042083
IOP Publishing doi:10.1088/1757-899X/603/4/042083
To define the best road pavement maintenance strategies it is necessary to know the state, and by that, the quality of the pavements. As such, visual inspections must be conducted in order to obtain the different parameters that characterize road surface state. The parameters that are normally considered for assessing the quality of road pavements in the post-construction phase are: the structural capacity, the surface condition, the longitudinal and transverse regularity and the friction of the pavements [2]. From the parameters mentioned, the observation and evaluation of pavements surface condition is the one that presents the greatest complexity, since there is a wide variety of distresses that may be present on the surface of pavements, and because the identification and classification of these distresses may differ from observer to observer.
Considering Portuguese practice [4] [5], a global evaluation of the present pavements condition, obtained through the calculation of Present Serviceability Index (PSI), which is based on the original AASHO Road Test [6], was considered in the development of the methodology proposed in this paper. Thus, data collection operation must take into account the necessity to obtain reliable data on:
Surface condition, with special attention to cracks (longitudinal and transverse cracking, alligator cracking), deformations (pot-holes and loss of surface material) and patching areas;
Longitudinal regularity, considered through the International Roughness Index (IRI); Transverse regularity, considered by the presence of ruts.
The PSI formulation considered is presented in equation (1). This formulation was used on the PMS of Lisbon City [4] and was based on the equation adopted by the Nevada’s State PMS [7].
PSIt= 5 × e −0,0002598×IRIt 4 − 0,002139 4 × Rt 2− 7 × 0,03 × (C t+ St+ Pt)0,5 (1) Where PSIt is the Present Serviceability Index at year t; IRIt is the pavement longitudinal roughness at year t (mm/km); Rt is the rutting average depth at year t (mm); Ct is the pavement cracking area at year t (m2/100m2); St is the area with pot-holes and loss of surface material at year t (m2/100m2); Pt is the patching area at year t (m2/100m2).
PSI values obtained from equation 1 can range from 0 (poor pavements' state) to 5 (new pavement) being grouped for this study into three levels:
PSI between 3,5 and 5, representing pavements in good condition, with no need for immediate intervention.
PSI between 2,5 and 3,5, representing pavements in acceptable condition. The traffic circulation is still safe with acceptable levels of comfort but it identifies pavements that would benefit from preventive intervention.
PSI between 0 and 2,5, representing pavements in poor condition, needing intervention.
After choosing the type of pavement condition evaluation to be used, it is possible to proceed with the definition of the information to be included in the road database (main component of any PMS) and to define the methodology to adopt for visual data collection, in particular for pavement distresses.
Taking into account the features listed above and to cope with the difficulties that local authorities face in managing their road assets [8] [9] [10], in particular their pavements, a low cost methodology using GNSS, GIS and video image is presented. The methodology incorporates the procedures for collecting, recording, analysing and reporting pavement data, producing reliable data with the accuracy required for an effective evaluation of road pavements condition. The methodology aims to support the decision makers finding optimum strategies for maintaining pavements in serviceable condition.
WMCAUS 2019
IOP Conf. Series: Materials Science and Engineering 603 (2019) 042083
IOP Publishing doi:10.1088/1757-899X/603/4/042083
3 2. Methodology
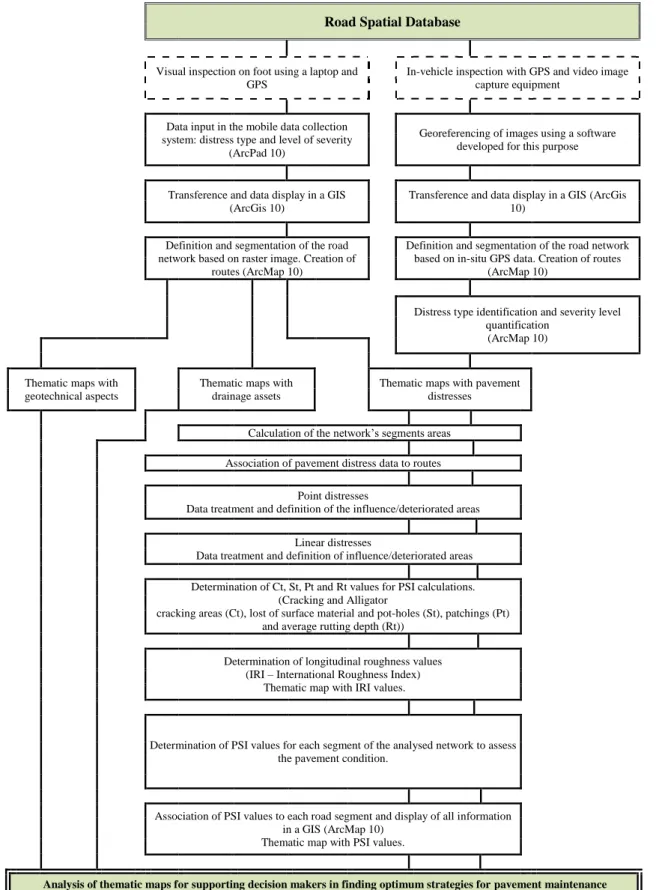
The flowchart in Figure 1 shows the main steps to be considered in the development of a road spatial database for evaluation of the quality of road pavements, considering two methodologies of visual inspection - on foot and in-vehicle.
Inventory (road geometry), pavement condition (pavement distresses), drainage (superficial drainage assets), geotechnical (fill and cut zones) and control (control points for evaluation of geo-referenced information) data are the information requirements of the Spatial Data Base (SDB). Other information as traffic/loads, costs (construction, maintenance, rehabilitation and reconstruction) and interventions historical can also be included.
The visual inspection on foot was considered for validation of the results obtained by the proposed in-vehicle system and can be used as a complementary system for data acquisition. For the case of inspections conducted on foot, collection and input of data in the SDB can be performed directly on the field, using a laptop with an installed mobile GIS (such as ArcPad®) and a built-in GNSS. To perform these operations, the operator walks along the network under study, on the sidewalk or shoulder of the road, to ensure his safety and non-interference with the traffic movement (see Figure 2). The information related to each occurrence (type, level of severity and geo-referenced data) is automatically recorded and stored in a shapefile (vector geospatial data file format used by GIS).
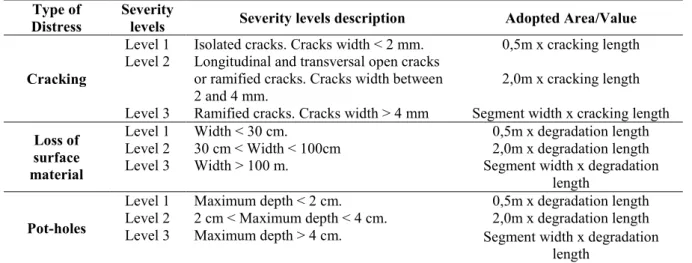
A pavement distress identification manual that establishes descriptive and rating information was established and organized to assist inspection operations. This manual minimizes the subjectivity associated with the visual inspection of distresses and decreases identification time. Some examples of the main information included on the manual and considerations for PSI calculations are presented in Table 1.
Table 1. Examples of surface distresses and severity levels
Data collection (pavement distresses and surface drainage assets) using a vehicle, GNSS and image capture video equipment was developed to support the creation of the SDB. The data collection system comprises the following equipment: 1 metal structure; 1 HD webcam for image capture of the pavement surface; 1 EDM (electronic distance meter) for measuring the vertical distance to the pavement surface; GNSS receivers, for relative post-processing mode used on precision positioning and for webcam and EDM temporal synchronism of data; and 2 laptop computers to storage the data collected. Figure 3 shows how the equipment is placed in the vehicle used in the data collection.
Type of Distress
Severity
levels Severity levels description Adopted Area/Value Cracking
Level 1 Isolated cracks. Cracks width < 2 mm. 0,5m x cracking length Level 2 Longitudinal and transversal open cracks
or ramified cracks. Cracks width between
2 and 4 mm. 2,0m x cracking length
Level 3 Ramified cracks. Cracks width > 4 mm Segment width x cracking length
Loss of surface material
Level 1 Width < 30 cm. 0,5m x degradation length Level 2 30 cm < Width < 100cm 2,0m x degradation length Level 3 Width > 100 m. Segment width x degradation
length
Pot-holes
Level 1 Maximum depth < 2 cm. 0,5m x degradation length Level 2 2 cm < Maximum depth < 4 cm. 2,0m x degradation length Level 3 Maximum depth > 4 cm. Segment width x degradation
WMCAUS 2019
IOP Conf. Series: Materials Science and Engineering 603 (2019) 042083
IOP Publishing doi:10.1088/1757-899X/603/4/042083
Figure 1. Flowchart for the conception of a Spatial Database of distresses, geotechnical aspects and drainage assets for flexible road pavements
Road Spatial Database
Visual inspection on foot using a laptop and GPS
In-vehicle inspection with GPS and video image capture equipment
Data input in the mobile data collection system: distress type and level of severity
(ArcPad 10)
Georeferencing of images using a software developed for this purpose
Transference and data display in a GIS (ArcGis 10)
Transference and data display in a GIS (ArcGis 10)
Definition and segmentation of the road network based on raster image. Creation of
routes (ArcMap 10)
Definition and segmentation of the road network based on in-situ GPS data. Creation of routes
(ArcMap 10)
Distress type identification and severity level
quantification (ArcMap 10)
Thematic maps with geotechnical aspects
Thematic maps with drainage assets
Thematic maps with pavement distresses
Calculation of the network’s segments areas Association of pavement distress data to routes
Point distresses
Data treatment and definition of the influence/deteriorated areas
Linear distresses
Data treatment and definition of influence/deteriorated areas
Determination of Ct, St, Pt and Rt values for PSI calculations. (Cracking and Alligator
cracking areas (Ct), lost of surface material and pot-holes (St), patchings (Pt) and average rutting depth (Rt))
Determination of longitudinal roughness values (IRI – International Roughness Index)
Thematic map with IRI values.
Determination of PSI values for each segment of the analysed network to assess
the pavement condition.
Association of PSI values to each road segment and display of all information in a GIS (ArcMap 10)
Thematic map with PSI values.
WMCAUS 2019
IOP Conf. Series: Materials Science and Engineering 603 (2019) 042083
IOP Publishing doi:10.1088/1757-899X/603/4/042083
5 Figure 2. Data collection in visual inspection
performed on foot
Figure 3. Equipment for the in-vehicle inspection (I – Metal structure, II – HD webcam, III
– EDM, IV – GPS to collect position data, V – GPS for temporal synchronization of data, VI – Laptop
computers)
To ensure data quality, in-vehicle inspections with the system proposed must be carried out at a speed of approximately 20 km/h. This type of inspection requires a driver and an operator to control the data acquisition. The real-time visualization of the data collected by the operator, ensure the homogeneity of the process of image capture.
The outcome of the data collection campaign is a set of images and geographic coordinates that can be associated, allowing the visualization of the pavement surface in a GIS (such as ArcGis® or QGis®). The synchronization of different data sets (images and geographical coordinates) as well as the correct orientation of the images is performed using software developed by the authors for this purpose (see Figure 4).
Figure 4. Visualization and image analysis examples obtained with the in-vehicle inspection The in-vehicle system has been tested and validated on a case study (presented in the next section). In this validation, the data collected were compared with those obtained by visual inspection on foot, for the same network [11].For data collected in several campaigns and/or different types of inspection
WMCAUS 2019
IOP Conf. Series: Materials Science and Engineering 603 (2019) 042083
IOP Publishing doi:10.1088/1757-899X/603/4/042083
methods control points for verification of location data should be considered. This information allows the acquaintance and fixing of location errors associated to GNSS data and the appropriate data aggregations. All the data obtained, after processing, is used in the PSI calculation and for the thematic maps preparation.
3. Case study, results and discussions
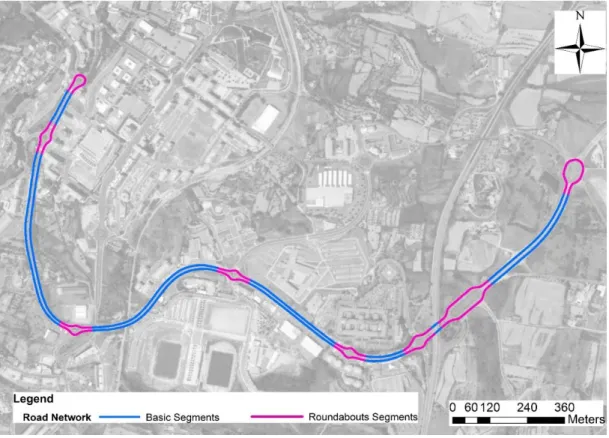
The methodology was applied at the city of Covilhã, Portugal, on the road axis that connects the city centre to the road EN18, as can be seen in Figure 5. The study road network has a length of 10 kilometres divided in two directions. The orientation west-east was considered the direction 1 and the east-west direction 2.
After an initial site examination it was concluded that a higher incidence of distresses occurs at roundabouts and roundabouts surrounding area. Therefore to ensure homogeneous road sections and aiming to a correct characterization of the pavements state for determination of PSI, it was considered a road network segmentation with roundabout sections that included a surrounding area of 40 meters. The resulting segmentation is thus composed of 15 road sections per direction, with 8 roundabout sections and 7 basic sections, as shown in Figure 5.
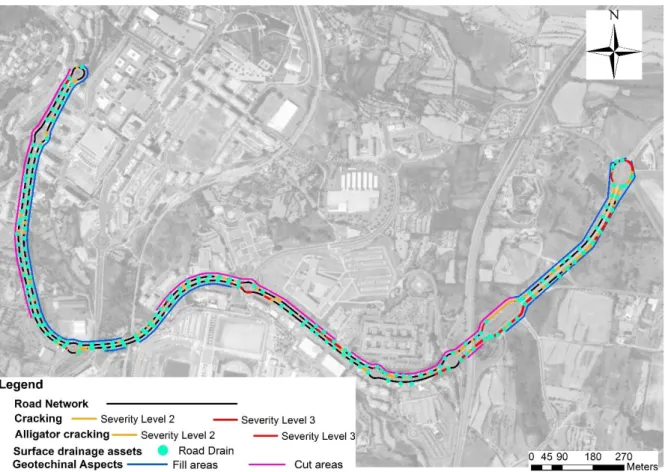
To sustain the positioning data of distresses and other occurrences, a geographical positioning study of some control points, selected along the road network, was made. For that, the positioning data obtained by a kinematic post-processing receiver and the time synchronization provided by a Garmin GNSS (GPS18USB model) was compared with data obtained in a survey conducted with a post-processing receiver. Based on this comparison, it was possible to determine an average difference value of 0.22 m between the planimetric coordinates of the control points. This value can be considered acceptable having into account the work purpose and that the data was collected in urban areas, supporting the use of a simpler GNSS receivers on this kind of surveys. After processing of the data acquired on the two inspections (on foot and in-vehicle) it was possible to prepare and compare several thematic maps with information concerning pavement distresses (cracking, alligator cracking, potholes, loss of surface material, rutting), IRI, PSI, drainage assets and geotechnical aspects (cut and fill areas), in a GIS. Some examples of thematic maps can be seen in Figures 6 and 7.
Note that the observed degradations in the visual on foot inspection are identified and quantified from the shoulder or sidewalk of the road and with traffic moving over the inspected area. This situation does not happen in the in-vehicle inspections, since a vertical image of the surface of the pavement is obtained without interference of the traffic flow. These aspects may explain some differences in the identification of the distresses severity levels by the two approaches, leading to small variation in PSI values.
It can be also analysed the existence of relations between occurrences. An example of a visualization of this type of analysis in GIS is presented in Figure 7 for the case of cracking, alligator cracking, surface drainage, road overpass, viaducts and geotechnical aspects.
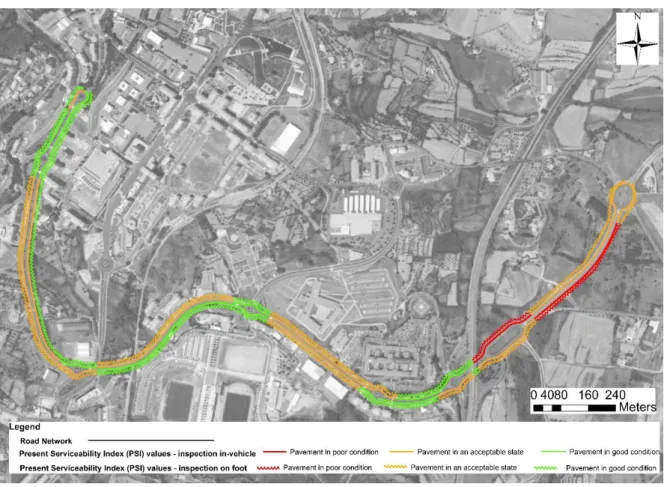
The values and locations obtained for PSI on the two approaches were very similar, as can be seen in Table 2 and Figure 8.
The results showed that the differences in PSI values is small, with an average value of 0.14 for the direction 1 (west-east) and 0.18 for the direction 2 (east-west). These results validate the approach proposed based on in-vehicle inspections.
WMCAUS 2019
IOP Conf. Series: Materials Science and Engineering 603 (2019) 042083
IOP Publishing doi:10.1088/1757-899X/603/4/042083
7
Figure 5. Case study: Road network segmentation
WMCAUS 2019
IOP Conf. Series: Materials Science and Engineering 603 (2019) 042083
IOP Publishing doi:10.1088/1757-899X/603/4/042083
Figure 7. Thematic map: analysis of the relation between cracking, alligator cracking, surface drainage, road overpass, viaducts and geotechnical aspects.
Table 2. PSI values obtained from the data acquired on the two types of inspection for direction 1 Section ID PSI 1
on foot
PSI 2
on-vehicle PSI 1 – PSI 2
R0_1 3.65 3.44 -0.21 R1_1 4.28 3.93 -0.35 R2_1 3.31 3.10 -0.21 R3_1 4.01 3.65 -0.36 R4_1 4.12 4.00 -0.12 R5_1 3.12 3.02 -0.10 R6_1 2.60 2.58 -0.02 R7_1 2.62 2.51 -0.11 T1_1 4.53 4.39 -0.14 T2_1 2.58 2.73 0.14 T3_1 4.04 3.89 -0.15 T4_1 3.46 3.20 -0.26 T5_1 4.53 4.39 -0.14 T6_1 4.06 4.05 0.00 T7_1 2.34 2.30 -0.04 Average 3.55 3.41 0.14 St. deviation 0.73 0.67 0.13
WMCAUS 2019
IOP Conf. Series: Materials Science and Engineering 603 (2019) 042083
IOP Publishing doi:10.1088/1757-899X/603/4/042083
9
Figure 8. Thematic map: Comparison of PSI values (on foot and in-vehicle inspection) 4. Conclusions
Currently, due to financial constraints, it is essential to know the state of the road networks, in particular the pavements condition, in order to define priorities on intervention to ensure an acceptable quality level of the network and safety for users.
The observation and record of data used to determine the pavement state and the location of sensitive areas of the network is the most important phase of a PMS. Thus, the collection of reliable data is essential for the proper functioning of PMS. This work presents two approaches for collecting the required information:
By visual inspection performed on foot, using a laptop with built-in GNSS and a GIS program. This method allows to identify, quantify and record relevant aspects during data collection campaign. The process of data collection is slower but more flexible regarding the variety of information that can be collected.
By inspection performed on an instrumented vehicle that enables the video recording of the pavement surface and positioning data. The information obtained is treated in the office and can be supplemented with data from visual inspections on foot. Among the advantages of this method it is possible to highlight the speed of survey and the reliability of the collected data, whose identification is performed in the office by viewing images, if necessary repeatedly, in a GIS.
The use of GNSS position data allows the adoption of a spatial referencing system. These systems allow the association of information about the occurrences to its geographical position regardless of changes that may occur in the network. It also enables the data visualization in linear referencing systems. Acquiring data associated with their geographical coordinates, through the application of the
WMCAUS 2019
IOP Conf. Series: Materials Science and Engineering 603 (2019) 042083
IOP Publishing doi:10.1088/1757-899X/603/4/042083
two described approaches, allows the building of spatial databases (SDB) as well as visualize and analyse the spatial distribution of information in a clear and rigorous way using a GIS. The main advantage of these operations is the location of segments of the network with preventive and corrective maintenance needs.
Comparing the results obtained from the two types of inspection, it is clear that the inspection using an instrumented vehicle allows a reduction in time spent on data collection and a reduction in subjectivity associated to the collected information.
References
[1] Fwa TF. The Handbook of Highway Engineering. Boca Raton: CRC Press Taylor & Francis Group; 2006.
[2] Wolters A, Zimmerman K, Schattler K, Rietgraf A. Implementing Pavement Management Systems for Local Agencies Implementation Guide. A synthesis of ICT‐R27‐87 Implementing Pavement Management Systems for Local Agencies Illinois Center for Transportation. Illinois: Illinois Center for Transportation; 2011.
[3] Batista dos Santos BM, de Picado Santos LG, Pissarra Cavaleiro VM. Refinement of a simplified road-user cost model. Proc Inst Civ Eng - Transp 2014. doi:10.1680/tran.12.00057.
[4] Picado-Santos L, Ferreira A, Antunes A, Carvalheira C, Santos B, Bicho M, et al. Pavement
management system for Lisbon. Munic Eng 2004;157:157–65.
doi:10.1680/muen.157.3.157.49462.
[5] Picado-Santos L, Ferreira A. Contributions to the development of the Portuguese road administration’s pavement management system. Proc. third Eur. pavement asset Manag. Conf., Coimbra: 2008.
[6] HRB. The AASHO road test. Report 5: Pavement Research, Special Report 61E. 1962.
[7] Sebaaly PE, Hand A, Epps J, Bosch C. Nevada’s Approach to Pavement Management. Transp Res Rec 1996;1524:109–17. doi:10.1177/0361198196152400113.
[8] Radopoulou SC, Brilakis I. Improving Road Asset Condition Monitoring. Transp Res Procedia 2016;14:3004–12. doi:10.1016/j.trpro.2016.05.436.
[9] Shah YU, Jain SS, Tiwari D, Jain MK. Development of Overall Pavement Condition Index for Urban Road Network. Procedia - Soc Behav Sci 2013;104:332–41. doi:10.1016/j.sbspro.2013.11.126.
[10] Loprencipe G, Pantuso A, Di Mascio P. Sustainable Pavement Management System in Urban Areas Considering the Vehicle Operating Costs. Sustain 2017;9. doi:10.3390/su9030453. [11] Maganinho L. Development of a database for road pavement condition using GPS, video image
and GIS (in Portuguese: Desenvolvimento de uma base de dados de patologias para a avaliação da qualidade de pavimentos rodoviários com recurso a GPS, imagem vídeo e SIG). University of Beira Interior, 2013.