INTRODUCTION
Many marine fishes exhibit high dispersal potential and a large population size and, as a consequence, one usually expects the degree of genetic differentiation among populations to be low (Bernal-Ramírez et al. 2003). Nevertheless, such low genetic differentiation can account for the relationship between speciation and dispersal/population dynamics in marine species (Domingues et al. 2006). In fact, one may interpret genetic differentiation among populations in terms of population isolation, reduced gene flow, genetic drift and natural selection (González-Wangüemert et al.
2004, Bargelloni et al. 2005, González-Wangüemert et al. 2006a). However, questions often arise regarding the biological significance of such differentiation, part-ly since the temporal stability of the observed pattern is unknown (Waples 1998). Most of the available re-search is limited in terms of its description and discus-sion of observed genetic patterns. These studies assume that observed patterns will remain stable over time, and that variable factors have little or no effect over relatively short time periods (Barcia et al. 2005). However, some studies have documented the rele-vance of long-term genetic stability research, particu-larly in the context of understanding which factors
© Inter-Research 2007 · www.int-res.com *Email: mercedes@mail.icav.up.pt
Temporal genetic variation in populations of
Diplodus sargus from the SW Mediterranean Sea
M. González-Wangüemert
1,*, Á. Pérez-Ruzafa
2, F. Cánovas
3, J. A. García-Charton
2,
C. Marcos
21Centro de Investigação em Biodiversidade e Recursos Genéticos (CIBIO), Universidade do Porto, Campus Agrário de Vairão, R. Monte-Crasto, 4485-661 Porto, Portugal
2Departamento de Ecología e Hidrología, Facultad de Biología, Universidad de Murcia, Campus de Espinardo, 30100 Murcia, Spain
3Departamento de Zoología y Antropología Física, Facultad de Veterinaria, Universidad de Murcia, Campus de Espinardo, 30100 Murcia, Spain
ABSTRACT: Population genetic studies on white sea bream Diplodus sargus have revealed different
patterns in the subdivision of populations in the Mediterranean Sea. However, the stability of observed allele frequencies over time remains poorly tested. The aim of this study was to show that the genetic structure of D. sargus could significantly change over time by analysing temporal
varia-tions in allozymes. In order to determine temporal variation in the genetic structure of 5 natural
D. sargus populations in the SW Mediterranean, we screened 14 allozyme loci. Our main finding was
the significant genotypic differentiation among cohorts (year-classes) in the Guardamar (FST = 0.012;
p < 0.001) and Cape of Palos (FST = 0.008; p < 0.001) populations. The differentiation observed in the
present study when considering pair-wise comparisons between cohorts is similar to that of all popu-lations throughout the Mediterranean Sea. Our results suggest that microgeographical variations, also known as ‘chaotic genetic patchiness’, could occur in D. sargus populations from the SW
Mediterranean. The recruitment of genetically variable cohorts at 1 site each year may account for these variations. We also discussed alternative explanations for this genetic pattern. This study con-firms the importance of understanding the ecology, behaviour and environment of fish populations when investigating population genetic structure. Our results also highlight the importance of incor-porating temporal samples when conducting population structure studies.
KEY WORDS: Temporal change · Allozymes · Cohort · Recruitment · Marine fish · Dispersal · White sea bream
have led to the establishment of observed patterns (Barcia et al. 2005).
Theoretically, temporal variations in allele frequencies may be the consequence of either selection in larval populations (Johnson & Black 1982, Lundy et al. 2000, Bernal-Ramírez et al. 2003) and/or large variations in the reproductive success of individuals (genetic drift) (Lenfant & Planes 2002). An alternative explanation could be that temporal genetic variance is a by-product of large sampling errors engendered by sweepstake reproductive success on behalf of a minority of individu-als (Hedgecock 1994). The combination of high repro-ductive output and high rates of failure during early life-history stages means that only a few adults may be responsible for much of the recruitment during any particular season. Such variance in reproductive success would limit effective population sizes, potentially result-ing in chaotic genetic patchiness (Johnson & Black 1982, Larson & Julian 1999, Bernal-Ramírez et al. 2003) that is temporally unstable. Temporal variance in allelic fre-quencies may also result from the stochastic nature of reproductive activity and oceanographic conditions conducive to fertilization, larval development, retention and recruitment (Hedgecock 1994, Man & Buxton 1998, Lenfant & Planes 2002). Recent studies indicated that larvae are capable of recruiting back to their source population (Swearer et al. 2002), which can also affect the genetic structure of populations.
The purpose of the present study was to assess the stability of the genetic structure of white sea bream
Diplodus sargus by analyzing allozyme data from
4 year-classes of 5 Mediterranean populations, and to discuss the possible causes of the patterns observed.
MATERIALS AND METHODS
Species. Diplodus sargus is a commercial fish that
occurs throughout the Mediterranean Sea and along the West-African coast down to South Africa (Fisher et al. 1987). Adults spawn in the open sea from March to June, and eggs are reported to occur in surface waters down to depths of 5 m. Larvae spend 28 (± 3) d in the pelagic environment, prior to settlement in very shal-low habitats in mid-June. They remain in this habitat for 1 yr until reaching 80 to 100 mm in length, and then migrate to deeper habitats (Vigliola 1998).
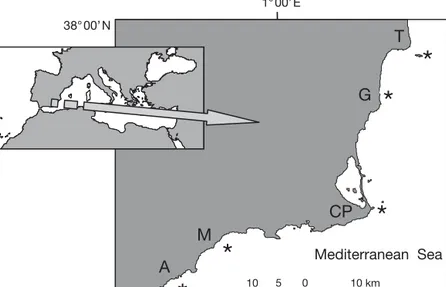
Sampling. A total of 1249 specimens of Diplodus sargus were captured from the eastern Spanish
Medi-terranean between 1999 and 2000 (Fig. 1). Localities included 2 marine reserves (Tabarca Island and Cape of Palos-Hormigas Islands) and 3 neighbouring non-protected areas (Águilas, Mazarrón and Guardamar) in the Mediterranean Sea. Fish were frozen after cap-ture, transported to the laboratory and kept at –40°C until dissection. Liver and muscle were extracted from each specimen and kept at –70°C until analysis.
Demographic analysis. We used otoliths (sagittae) to provide estimates of individual fish ages and to assign each fish to a single cohort by counting the number of slow-growing winter zones. Each otolith was counted twice by 2 different observers, and a third count was made in the case of conflict. Fishes with otoliths showing inconsistent patterns (11) were ex-cluded from any further analysis. Final analysis in-volved 1238 individuals that had no ambiguities in terms of otolith reading. The term ‘cohort’ usually refers to individuals that recruit over a short period of time. In this study a cohort was equivalent to a year-class, because Diplodus sargus settles
once a year within a 1 mo period. Cohorts were labelled according to the year they settled, e.g. ‘Cohort 99’ means the cohort whose individuals settled in 1999.
Electrophoresis. Samples were ho-mogenised in an equal volume of Tris/Citrate buffer (pH 9.0). Homo-genates were centrifuged at 7000 × g for 12 min at 4°C, and the supernatant was stored at –80°C. We performed starch gel electrophoresis according to González-Wangüemert et al. (2004), and chose a set of enzymes with a clear polymorphic zymogram. The loci used for analysis were scored from the fol-lowing enzyme stains: glucose-6-phos-phate isomerase, EC 5.3.1.9 (GPI-1*
and GPI-2*); phosphoglucomutase, EC
5.4.2.1 (PGM*); phosphogluconate
de-M
A
CP
T
Mediterranean Sea 1° 00’ E 38° 00’ N 37° 30’ NG
10 5 0 10 kmFig. 1.Diplodus sargus. The 5 sampling sites of the present study. A: Águilas;
hydrogenase, EC 1.1.1.44 (PGDH*); lactate
dehydro-genase, EC 1.1.1.27 (LDH-1* and LDH-2*); adenosine
deaminase, EC 3.5.4.4 (ADA*); guanine deaminase,
EC 3.5.4.3 (GDA*); isocitrate dehydrogenase EC
1.1.1.42 (IDH-1* and IDH-2*); aspartate
aminotrans-ferase EC 2.6.1.1 (AAT-1* and AAT-2*); malate
dehy-drogenase EC 1.1.1.37 (MDH-1* and MDH-2*).
Population genetic analysis. We did not take all co-horts into consideration when analyzing genetic struc-ture because sample number differed greatly for each cohort. Firstly, we studied the genetic variability between year-classes in each population using data from 4 cohorts (1995, 1996, 1997, and 1998); secondly, we used only 3 cohorts (1996, 1997 and 1998) to com-pare the genetic structure among cohorts and the dif-ferent populations.
We obtained allelic and genotypic frequencies by counting phenotypes directly from the gels using the GENETIX software package (available at www.genetix. univ-montp2.fr/genetix.htm). We calculated the proba-bility of random departure from the Hardy-Weinberg equilibrium and the significance of divergence among groups using the ‘exact test’ method (Raymond & Rous-set 1995). Values of observed and expected heterozygos-ity were computed for each cohort from the genotypic frequencies, taking all loci into account.
We calculated F-statistics using the Weir &
Cocker-ham (1984) method. The FIS value is the average
inbreeding coefficient that reflects the Hardy-Wein-berg equilibrium within a group, whereas FST values
indicate the amount of divergence between groups (defined as cohorts). Probabilities of the random depar-ture of F-values from 0 (according to the null
hypothe-sis) were read directly from the distribution of 1000 randomised matrices computed via permutation. We performed this analysis using the F-testing procedure
of GENETIX, thus allowing for a significance test to be conducted. We computed Spearman’s correlations between FIS, heterozygosity, the average number of
alleles per locus and the abundance of cohorts. Nei’s genetic distances (Nei 1978) and Cavalli-Sforza distances between pair-wise samples were calculated, and the resulting matrix was clustered using UPGMA and neighbour-joining algorithms respectively (R sta-tistical software package; R Development Core Team 2005). According to the null hypothesis, we directly calculated probabilities of random departure from 0 for genetic distance values from the distribution of 1000 randomised matrices computed via permutation (GENETIX).
We considered individual probabilities (as described by Cornuet et al. 1999) in order to determine the most likely geographic origin of each fish sampled, and to assign the stock origin of a fish with genotypic data only. We assigned each individual to the sample to
which it had the highest ‘probability of belonging’. We used the program GENECLASS version 1.0 (Cornuet et al. 1999) for these calculations, and as recommended by these authors we selected the ‘Bayesian approach’. To decrease bias we chose the ‘leave-one-out’ option, whereby the assigned individual is not included in the estimation of allele frequencies. We also compared genetic differences using principal component analy-sis (PCA) of allelic frequencies. These analyses were described by She et al. (1987) and calculated using R statistical software (R Development Core Team 2005).
RESULTS
Demographic structure
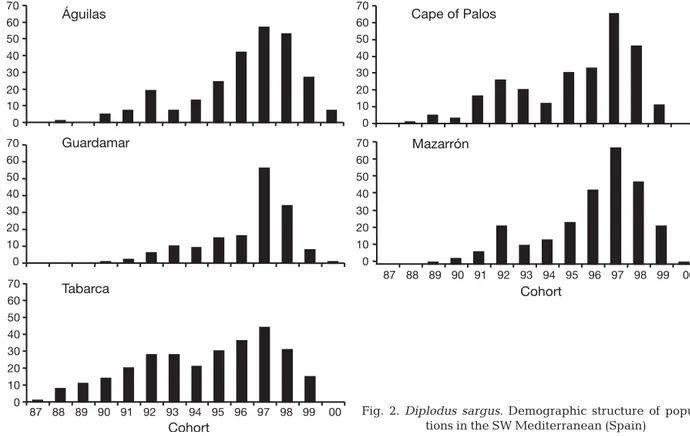
The age structure of SW Mediterranean white sea bream populations revealed strong variation in the abundance of each cohort (Fig. 2). Most individuals were younger than 10 years of age: only a few individ-uals exceeded this age. Fishes from Tabarca Island were the oldest. This age structure is considered typi-cal for target species and, in fact, is probably a conse-quence of fishing. The largest and oldest individuals were found within the protected populations (Tabarca and Cape of Palos marine reserves), because these are not removed by fishing. Five cohorts (95, 96, 97, 98 and 99) accounted for 69 to 81.6% of the total population; however, in the Tabarca population, these cohorts accounted for only 54.5%.
Genetic variation between cohorts in each population
Mean heterozygosity was high for all cohorts in each sample (Table 1). Observed heterozygosity and the aver-age number of alleles did not correlate with abundance in each cohort. The average number of alleles only cor-related significantly with the number of individuals per cohort in the Mazarrón population (ρ = 1, p < 0.05).
Cohorts exhibited a significant deviation from the Hardy-Weinberg equilibrium owing to heterozygote deficits. However, some loci showed a (non-significant) heterozygote excess: LDH-1*, MDH-1* (Cohort 95
Águilas) and GDA* (Cohort 97 Águilas) loci, PGM*
(Co-hort 96 Cape of Palos), MDH-1*, MDH-2* (Cohort 95
Cape of Palos), PGI-2*, ADA* (Cohort 98 Cape of Palos)
and GDA* (Cohort 95, 97, 98 Cape of Palos) loci, LDH-2*
(Cohorts 96 and 97 Guardamar), LDH-1* (Cohort 98
Guardamar) and GDA* (Cohort 95 Guardamar) loci,
and the MDH-1* (Cohort 95 Tabarca) locus. Only the LDH-2* (Cohorts 95, 96 and 97 Mazarrón) locus
FIS-values did not significantly
corre-late with the abundance of each cohort, with the exception of those cohorts from Mazarrón (ρ = 1, p < 0.05). The overall genetic differentiation between cohorts was not significant at Águilas, Mazarrón and Tabarca; however, the genetic differ-entiation between cohorts was significant at Cape of Palos (FST = 0.008; p < 0.001)
and Guardamar (FST = 0.012; p < 0.001).
Nei’s genetic distances (based on allelic frequencies) were significant between all cohorts at Cape of Palos, Guardamar and Tabarca (except between Cohorts 96 and 97). Populations from Águilas and Mazarrón exhibited significant genetic distances between some cohorts only.
Genetic variation between cohorts from different populations
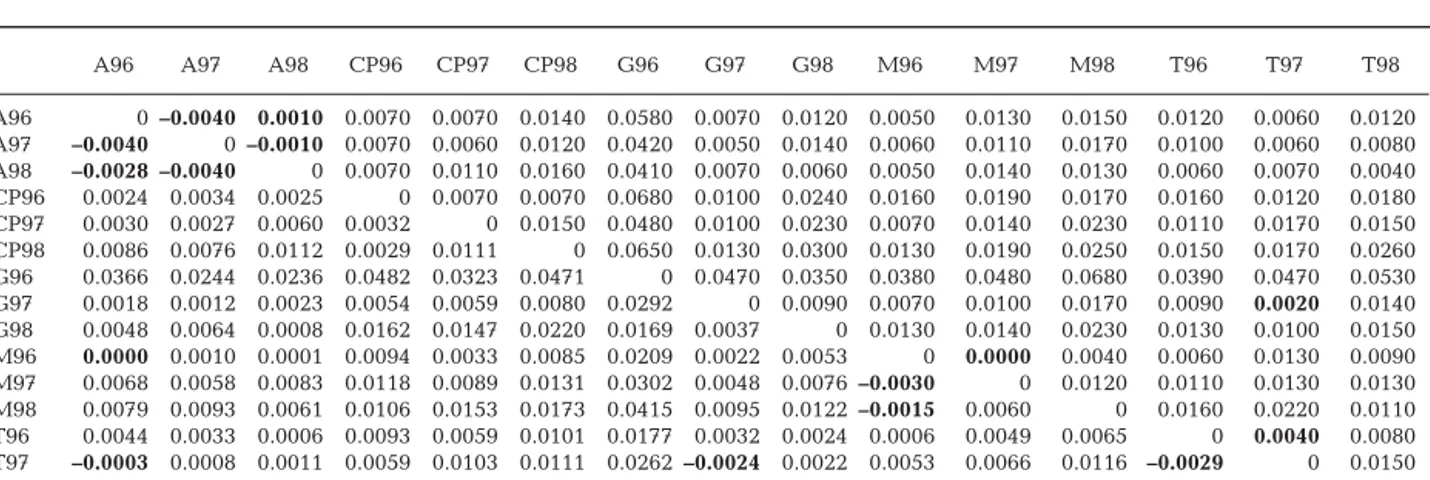
Estimates of genetic differentiation between pairs of cohorts produced sig-nificant FST and genetic distance values
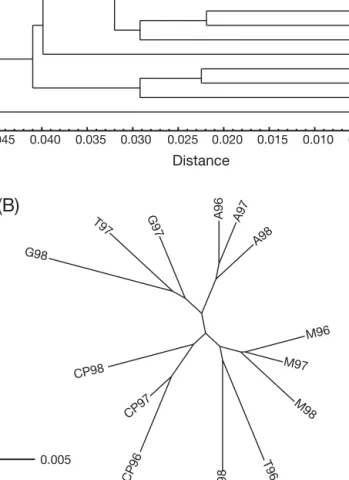
in all but a few cases (Table 2). Genetic distance dendrograms did not reveal any structure in cohort grouping related to age or abundance (Fig. 3). The results
Águilas 0 10 20 30 40 50 60 70 Cape of Palos Guardamar 0 10 20 30 40 50 60 70 0 10 20 30 40 50 60 70 0 10 20 30 40 50 60 70 Mazarrón 87 88 89 90 91 92 93 94 95 96 97 98 99 00 Cohort Cohort Abundance (% of total) Tabarca 0 10 20 30 40 50 60 70
87 88 89 90 91 92 93 94 95 96 97 98 99 00 Fig. 2.Diplodus sargus. Demographic structure of
popula-tions in the SW Mediterranean (Spain)
Population Cohort N HO HE Allele FIS
average Águilas 95 24 0.4171 0.5642 4.0000 0.2815* 96 42 0.3737 0.5468 4.5000 0.3262* 97 57 0.4012 0.5653 4.7143 0.2977* 98 53 0.3858 0.5611 4.4286 0.3196* Overall 166 0.3923 0.5650 5.0714 0.3097* Cape of Palos 95 30 0.4194 0.5790 4.2857 0.2914* 96 33 0.4157 0.5193 4.5000 0.2144* 97 65 0.4402 0.5498 4.7143 0.2068* 98 46 0.4030 0.5182 4.2857 0.2328* Overall 174 0.4221 0.5500 5.0000 0.2352* Guardamar 95 15 0.3762 0.5844 4.4286 0.3871* 96 16 0.3567 0.5325 3.9286 0.3575* 97 56 0.3771 0.5536 5.0714 0.3270* 98 34 0.3921 0.5850 5.0000 0.3435* Overall 121 0.3786 0.5775 5.2857 0.3429* Mazarrón 95 24 0.3804 0.5660 4.0714 0.3472* 96 43 0.3695 0.5590 4.2143 0.3498* 97 68 0.3381 0.5446 4.9286 0.3856* 98 48 0.3539 0.5616 4.5714 0.3789* Overall 183 0.3556 0.5616 5.1429 0.3698* Tabarca 95 30 0.3418 0.5343 4.7143 0.3751* 96 34 0.3149 0.5875 5.1429 0.4756* 97 44 0.3101 0.5571 4.7857 0.4229* 98 31 0.3078 0.5341 4.3571 0.4373* Overall 139 0.3178 0.5652 5.4286 0.4407* Table 1.Diplodus sargus. Genetic diversity indices for each cohort and overall
cohorts. N: sample size; HO: observed heterozygosity; HE: expected hetero-zygosity; FIS: Wright’s inbreeding index; *: p < 0.001
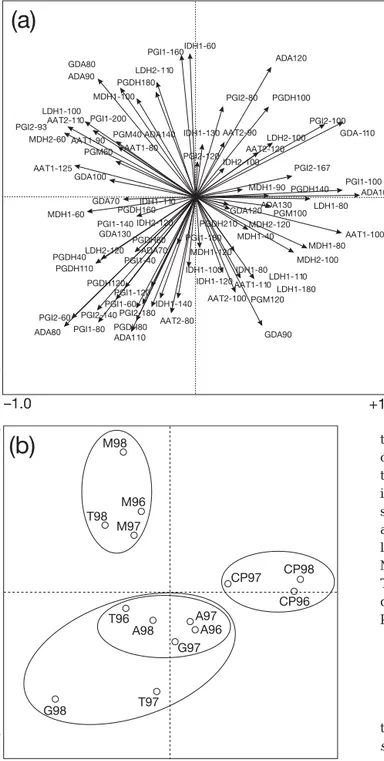
of PCA of allele frequency data revealed a cohort dis-tribution that agrees with those obtained from genetic distances. The first and second axes explained 34.3% of total variation, and separated Cape of Palos and Mazarrón cohorts from the others. Cohorts from the Cape of Palos were clearly separated from the Mazarrón cohorts and Cohort 98 from Tabarca along the first (x-)axis, which were in turn separated from the
Águilas, Guardamar and remaining Tabarca cohorts along the second (y-)axis (Fig. 4).
Table 3 gives the results of assignment tests. These revealed that approximately 15% of individuals were correctly assigned to the sample from which they orig-inated. Among those individuals assigned to a differ-ent sample, 25% were assigned to the same population but from another year, and 20% were assigned to the correct year but to samples from different populations.
DISCUSSION
The main result of this study was the highly signifi-cant genotypic differentiation among cohorts in the Guardamar (FST = 0.012; p < 0.001) and Cape of Palos
(FST = 0.008; p < 0.001) populations. Similar results (FST
= 0.008; p < 0.001) were obtained for Diplodus sargus
cohorts from Banyuls (NW Mediterranean) (Lenfant & Planes 2002). This level of genetic differentiation con-trasts with previous studies on the spatial genetic structure of the same species in populations from Lion’s Gulf and the Ligurian Sea (NW Mediterranean;
FST = 0.007) and the Murcia and Alicante populations
(SW Mediterranean; FST = 0.006), among which
Len-fant & Planes (1996) and González-Wangüemert et al. (2004) found somewhat limited differentiation. Bargel-loni et al. (2005) observed similar limited
differentia-tion for D. sargus throughout the Mediterranean Sea
and Atlantic Ocean (FST = 0.009); however, in this latter
case, the FST value was not significant. In another case,
Lenfant & Planes (1996) found no divergence among a number of sites separated by several hundred kilome-tres. In terms of pair-wise comparisons between cohorts, results from previous studies on the genetic differentiation of D. sargus throughout the
Mediter-ranean Sea are similar to those obtained in the present study, which raises questions on the value and origin of genetic divergence observed between distant popula-tions (Lenfant & Planes 1996, González-Wangüemert et al. 2004, Pérez-Ruzafa et al. 2006, González-Wangüemert et al. 2006b).
Large variance in reproductive success, reported for many marine organisms (Ruzzante et al. 1996, Li & Hedgecock 1998), could perhaps determine the popu-lation genetic structure of white sea bream. Man & Buxton (1998) demonstrated that maturation is related to water temperature in Diplodus sargus capensis and D. sargus hottentotus. This variable may act as a
limit-ing factor on the reproduction rate of white sea bream. However, available data on temperature in the area studied (obtained from the NOAA via www.noaa.gov) showed no significant variations for a range of SW-Mediterranean populations during the reproductive months covered by the present study.
An alternative explanation for the variance in repro-ductive success could be the alteration of population size, local retention, local adaptation and random or se-lective post-settlement mortality (Ruzzante et al. 1996, Lundy et al. 2000, Lenfant & Planes 2002). In this study, the use of allozyme markers (known as ‘selective mark-ers’) could account for the observed genetic differentia-tion between cohorts, which may have resulted from post- or pre-settlement fish mortality (known to be
A96 A97 A98 CP96 CP97 CP98 G96 G97 G98 M96 M97 M98 T96 T97 T98 A96 0 –0.0040 0.0010 0.0070 0.0070 0.0140 0.0580 0.0070 0.0120 0.0050 0.0130 0.0150 0.0120 0.0060 0.0120 A97 –0.0040 0 –0.0010 0.0070 0.0060 0.0120 0.0420 0.0050 0.0140 0.0060 0.0110 0.0170 0.0100 0.0060 0.0080 A98 –0.0028 –0.0040 0 0.0070 0.0110 0.0160 0.0410 0.0070 0.0060 0.0050 0.0140 0.0130 0.0060 0.0070 0.0040 CP96 0.0024 0.0034 0.0025 0 0.0070 0.0070 0.0680 0.0100 0.0240 0.0160 0.0190 0.0170 0.0160 0.0120 0.0180 CP97 0.0030 0.0027 0.0060 0.0032 0 0.0150 0.0480 0.0100 0.0230 0.0070 0.0140 0.0230 0.0110 0.0170 0.0150 CP98 0.0086 0.0076 0.0112 0.0029 0.0111 0 0.0650 0.0130 0.0300 0.0130 0.0190 0.0250 0.0150 0.0170 0.0260 G96 0.0366 0.0244 0.0236 0.0482 0.0323 0.0471 0 0.0470 0.0350 0.0380 0.0480 0.0680 0.0390 0.0470 0.0530 G97 0.0018 0.0012 0.0023 0.0054 0.0059 0.0080 0.0292 0 0.0090 0.0070 0.0100 0.0170 0.0090 0.0020 0.0140 G98 0.0048 0.0064 0.0008 0.0162 0.0147 0.0220 0.0169 0.0037 0 0.0130 0.0140 0.0230 0.0130 0.0100 0.0150 M96 0.0000 0.0010 0.0001 0.0094 0.0033 0.0085 0.0209 0.0022 0.0053 0 0.0000 0.0040 0.0060 0.0130 0.0090 M97 0.0068 0.0058 0.0083 0.0118 0.0089 0.0131 0.0302 0.0048 0.0076 –0.0030 0 0.0120 0.0110 0.0130 0.0130 M98 0.0079 0.0093 0.0061 0.0106 0.0153 0.0173 0.0415 0.0095 0.0122 –0.0015 0.0060 0 0.0160 0.0220 0.0110 T96 0.0044 0.0033 0.0006 0.0093 0.0059 0.0101 0.0177 0.0032 0.0024 0.0006 0.0049 0.0065 0 0.0040 0.0080 T97 –0.0003 0.0008 0.0011 0.0059 0.0103 0.0111 0.0262 –0.0024 0.0022 0.0053 0.0066 0.0116 –0.0029 0 0.0150 T98 0.0044 0.0020 –0.0013 0.0098 0.0088 0.0175 0.0315 0.0066 0.0064 0.0020 0.0059 0.0031 –0.0003 0.0058 0
Table 2.Diplodus sargus. Estimates of genetic differentiation between pairs of samples: FST (below diagonal) and genetic dis-tances (Nei 1978) (above diagonal). A: Águilas; CP: Cape of Palos; G: Guardamar, M: Mazarrón; T: Tabarca; year of settlement is
highly selective processes). It has been shown that allo-zymes display selective processes in order to favour ei-ther the adaptation to changes in salinity or resistance to environmental stress (Dufresne et al. 2002). Although we still know very little about the microevolution of most characters, many studies on selection have demonstrated processes involving only a few loci whereas others have remained neutral (Lenfant & Planes 2002). In this study, the differentiation observed between cohorts relied on divergence at several loci, and those loci that contributed to significant differentia-tion varied in pair-wise comparisons. We observed no similar trends in cohorts that might have resulted from selection over time as cohorts grew older. Cluster analysis did not group cohorts according to their age but instead revealed a random organization, as was also demonstrated by other authors studying Diplodus sargus (Lenfant & Planes 2002).
Reproductive success can also be affected by ocean currents. The marine environment is highly unpredictable: the occurrence of intense ocean cur-rents can drive eggs and larvae away from coastal retention areas, resulting in very high mortality rates (Li & Hedgecock 1998). In any one year, lar-vae that do survive may derive from the relatively low number of individuals that have, by chance, matched their re-productive activity with oceanographic conditions (Lundy et al. 2000). In this way it is possible for a high variance in reproductive success to result in genetic variation among year classes. Our previous research on current patterns shows that oceanographic pro-cesses and conditions that affect the reproduction of marine animal life vary not only from one year to another but also within and between seasons in the study zone (González-Wangüemert 2004).
The genetic pattern observed here could imply that microgeographical variations, also known as ‘chaotic genetic patchiness’, could occur in Diplodus sargus
populations in the SW Mediterranean as a consequence of local oceanographic patterns. Such variations may result from the recruitment of genetically variable cohorts at one site each year. However, we cannot veri-fy the second conclusion of Hedgecock’s ‘sweepstakes’ recruitment, which indicates that there should be a decrease in genetic diversity. This conclusion may be
A96
(A)
(B)
A97 A98 G97 T97 T96 M96 M97 T98 G98 CP96 CP97 CP98 M98 0.000 0.005 0.010 0.015 0.020 0.005 0.025 0.030 0.035 0.040 0.045 Distance M97 M96 A98 A97 A96 G97 T97 G98 CP98 CP97 CP9 6 T98 T96 M98Fig. 3. Diplodus sargus. UPGMA and neighbour-joining plots
of genetic distances calculated for 14 allozyme loci among 15 cohorts. (a) Nei (1978) distance; (b) Cavalli-Sforza distance
Assigned Assigned to Assigned to Assigned to to sample population correct year another
of origin of origin but but to another population to incorrect population and
in-year correct year
A96 4.8 23.8 21.4 50.0 A97 8.8 28.1 19.3 43.9 A98 9.3 29.6 25.9 35.2 CP96 15.2 36.4 18.2 30.3 CP97 18.5 26.2 21.5 33.8 CP98 28.3 19.6 15.2 37.0 G96 37.5 25.0 6.3 31.3 G97 14.3 12.5 30.4 42.9 G98 11.8 32.4 26.5 29.4 M96 7.0 39.5 14.0 39.5 M97 16.2 32.4 14.7 36.8 M98 16.7 25.0 20.8 37.5 T96 11.1 16.7 8.3 63.9 T97 18.2 13.6 22.7 45.5 T98 3.2 22.6 22.6 51.6 Total 15.0 25.0 20.0 40.0
Table 3. Results of assignment tests (%) conducted using GENECLASS 1.0 (Cornuet et al. 1999)
difficult to assess using allozyme data that cover a lim-ited number of alleles. Future molecular genetic ana-lyses using microsatellite markers with a larger number of alleles should help to resolve this issue.
Finally, the assignment test provided a solid demon-stration of genetic discontinuities. Most individuals
were not correctly assigned to the sample from which they derived. The tendency towards ‘mis-assigned’ individuals from Tabarca and Guardamar was striking: these individuals were assigned to samples from different popu-lations and to either the correct or incorrect settlement period. Individuals from Águilas, Mazarrón and Cape of Palos showed a higher percentage of correct self-assignment (35, 46 and 48% respectively), which may have re-sulted from a self-recruitment process. This has been previously observed in various fish spe-cies (Swearer et al. 2002). Some studies suggest that self-recruitment is higher in populations of low density (Benzie & Stoddart 1992), which is likely to characterize Águilas and Mazarrón populations as a result of increases in fishing pressures. In fact, some authors have high-lighted recent reductions in the density of
Diplodus sargus populations at Águilas from
21.1 to 10.8 ind. m–2 (García-Charton et al.
2004). However, the Cape of Palos population is located within a marine reserve where fishery management tools are implemented. Therefore, the self-recruitment at this location must result from other factors. Cape of Palos is considered a faunistic transitional zone between Atlantic and Mediterranean influences (Whitehead et al. 1986). Previous studies suggest that gene flow takes place via pelagic systems and the open sea circulation model, which connect localities to the south of Cape of Palos (Águilas and Mazarrón) with northern areas (Guardamar and Tabarca). This pattern could imply self-recruitment due to the partial oceanographic isolation of Cape of Palos (González-Wangüemert et al. 2004).
CONCLUSIONS
Temporal differentiation patterns would suggest that the population structure of white sea bream Diplodus sargus in the SW Mediterranean is complex. Our
results highlight the need to incorporate temporal sam-ples when conducting studies on population structure, and reinforce the importance of understanding the ecology, behaviour and environment of fish popula-tions when investigating population genetics.
Acknowledgements. We thank 3 anonymous referees for their
valuable suggestions. We also thank all volunteers who helped to obtain data on winds and currents, particularly C. Mompeán, A. Herrero, S. Polti and C. Espejo. This research was partially supported by the SENECA Program, University of Murcia (PB/56/FS/02), and a grant from the research group ‘Ecología y Ordenación de Ecosistemas Marinos Costeros’ (University of Murcia) awarded to M.G.W. IDH1-60 PGI1-160 GDA80 LDH2-110 ADA120 PGI2-80 ADA90 PGDH100 PGDH180 MDH1-100 LDH1-100 PGI1-200 AAT2-110 PGI2-100
MDH2-60 AAT1-90 PGM40 ADA140 IDH1-130 AAT2-90 LDH2-100
AAT2-120 PGI2-120 AAT1-80 PGM60 AAT1-125 GDA100 GDA70 IDH1- 110 IDH2-100 PGI2-167 PGI2-93 MDH1-60 PGI1-140 GDA130 LDH2-120 PGDH40 PGDH110 PGDH120 PGDH160 IDH2-120 PGDH60 PGI2-60 PGI2-140 ADA80 PGI1-80 ADA110 PGDH80 PGI1-40 ADA70 PGI1-120 PGI1-60 PGI2-180 AAT2-80 IDH1-140 IDH1-100 PGI1-180 PGDH210 MDH1-120 IDH1-120 AAT2-100 PGM120 GDA90 AAT1-110 IDH1-80 LDH1-110 LDH1-180 MDH2-100 MDH1-80 MDH1-40 MDH2-120 PGM100 AAT1-100 LDH1-80 ADA100 PGI1-100 PGDH140 GDA120ADA130 MDH1-90 +1.0 –1.0 +1.0 –1.0 GDA-110
(a)
M98 T98 M96 M97 CP97 CP98 CP96 A98 T96 A97 A96 G97 T97 G98 +1.0 –1.0 +1.0 –1.0(b)
Fig. 4.Diplodus sargus. PCA of allele frequencies of cohorts.
(a) Allele distribution. Loci are listed in 'Materials and methods'. (b) Cohort distribution. See Fig. 1 and Table 1 for
LITERATURE CITED
Barcia AR, López GE, Hernández D, García-Machado E (2005) Temporal variation of the population structure and genetic diversity of Farfantepenaeus notialis assessed by
allozyme loci. Mol Ecol 14: 2933–2942
Bargelloni L, Alarcon JA, Alvarez MC, Penzo E, Magoulas A, Palma J, Patarnello T (2005) The Atlantic–Mediterranean transition: discordant genetic patterns in two seabream species, Diplodus puntazzo (Cetti) and Diplodus sargus
(L.). Mol Phylogenet Evol 36:523–535
Benzie JAH, Stoddart JA (1992) Genetic structure of out-breaking and non-outout-breaking crown-of-thorns starfish (Acanthaster planci) populations on the Great Barrier
Reef. Mar Biol 112:119–130
Bernal-Ramírez JH, Adcock GJ, Hauser L, Carvalho GR, Smith PJ (2003) Temporal stability of genetic population structure in the New Zealand snapper, Pagrus auratus,
and relationship to coastal currents. Mar Biol 142:567–574 Cornuet JM, Piry S, Luikart G, Estoup A, Solignac M (1999) New methods employing multilocus genotypes to select or exclude populations as origins of individuals. Genetics 153: 1989–2000
Domingues VS, Santos RS, Brito A, Almada VC (2006) Histor-ical population dynamics and demography of the eastern Atlantic pomacentrid Chromis limbata (Valenciennes,
1833). Mol Phylogenet Evol 40:139–147
Dufresnes F, Bourget E, Bernatchez L (2002) Differential pat-tern of spatial divergence in microsatellite and allozyme alleles: further evidence for locus-specific selection in the acorn barnacle, Semibalanus balanoides? Mol Ecol 11:
113–123
Fisher W, Schneider M, Bauchot ML (1987) Fiches FAO d’iden-tification des espèces pour les besoins de la pèche. Méditer-ranée et Mer Noire (Zone de pèche 37). FAO, Rome García-Charton JA, Pérez-Ruzafa A, Sánchez-Jerez P,
Bayle-Sempere J, Reñones O, Moreno D (2004) Multi-scale spa-tial heterogeneity, habitat structure, and the effects of marine reserves on Western Mediterranean rocky reef fish assemblages. Mar Biol 144:161–182
González-Wangüemert M (2004) Scales of variability in the genetic structure of SW Mediterranean populations of
Diplodus sargus. Genetic effects of fisheries protection in
marine reserves. PhD dissertation, University of Murcia González-Wangüemert M, Pérez-Ruzafa Á, Marcos C,
Gar-cía-Charton J (2004) Genetic differentiation of Diplodus sargus (Pisces: Sparidae) populations in Southwest
Medi-terranean. Biol J Linn Soc 82:249–261
González-Wangüemert M, Giménez-Casalduero F, Pérez-Ruzafa Á (2006a) Genetic differentiation of Elysia timida
(Risso, 1818) populations in Southwest Mediterranean and Mar Menor coastal lagoon. Biochem Syst Ecol 34:514–527 González-Wangüemert M, Pérez-Ruzafa Á, García Charton JA, Marcos C (2006b) Genetic differentiation and gene flow of two sparidae subspecies, Diplodus sargus sargus
and Diplodus sargus cadenati, in Atlantic and SW
Medi-terranean populations. Biol J Linn Soc 89/4:705–718 Hedgecock D (1994) Does variance in reproductive success
limit effective population sizes of marine organisms? In: Beaumont AR (ed) Genetics and evolution of aquatic
organisms. Chapman & Hall, London, p122–134
Johnson MS, Black R (1982) Chaotic genetic patchiness in an intertidal limpet, Siphonaria sp. Mar Biol 70:157–164
Larson RJ, Julian RM (1999) Spatial and temporal genetic patchiness in marine populations and their implications for fisheries management. Calif Coop Ocean Fish Invest Rep 40:94–99
Lenfant P, Planes S (1996) Genetic differentiation of white sea bream within the Lion’s Gulf and the Ligurian Sea (Mediterranean Sea). J Fish Biol 49:613–621
Lenfant P, Planes S (2002) Temporal genetic changes between cohorts in a natural population of a marine fish, Diplodus sargus. Biol J Linn Soc 76:9–20
Li G, Hedgecock D (1998) Genetic heterogeneity, detected by PCR-SSCP, among samples of larval pacific oysters (Crassostrea gigas) supports the hyphothesis of large
vari-ance in reproductive success. Can J Fish Aquat Sci 55: 1025–1033
Lundy CJ, Rico C, Hewitt GM (2000) Temporal and spatial genetic variation in spawning grounds of European hake (Merluccius merluccius) in the Bay of Biscay. Mol Ecol 9:
2067–2079
Man BQ, Buxton CD (1998) The reproductive biology of Diplo-dus sargus capensis and D. cervinus hottentotus (Sparidae)
off the South-East Cape Coast, South Africa. Cybium 22: 31–47
Nei M (1978) Estimation of average heterozygosity and genetic distance from a small number of individuals. Genetics 89: 583–590
Pérez-Ruzafa Á, González-Wangüemert M, Lenfant P, Marcos C, García-Charton JA (2006) Effects of fishing protection on the genetic structure of fish populations. Biol Conserv 129: 244–255
Raymond M, Rousset F (1995) An exact test for population dif-ferentiation. Evolution 49:1280–1283
R Development Core Team (2005) R: A language and environ-ment for statistical computing. R Foundation for Statistical Computing, Vienna
Ruzzante DE, Taggart CT, Cook D (1996) Spatial and tempo-ral variation in the genetic composition of a larval cod (Gadus morhua) aggregation: cohort contribution and
genetic stability. Can J Fish Aquat Sci 53:2695–2705 She JX, Autem M, Kotulas G, Pasteur N, Bonhomme F (1987)
Multivariate analysis of genetic exchanges between Solea segalensis (Teleosts, Soleidae). Biol J Linn Soc 32:357–371
Swearer SE, Sima JS, Hellberg ME, Thorrold SR and 6 others (2002) Evidence of self-recruitment in demersal marine populations. Bull Mar Sci 70:251–271
Vigliola L (1998) Contrôle et régulation du recrutement des Sparidae (Poissons, Teléostéens) an Méditerranée: impor-tance des processus pré-et post-installation benthique. PhD dissertation, Université de la Méditerranée, Marseille Waples RS (1998) Separating the wheat from the chaff:
pat-terns of genetic differentiation in high gene flow species. Am Genet Assoc 89:438–450
Weir BS, Cockerham CC (1984) Estimating F-statistics for the
analysis of population structure. Evolution 38:1358–1370 Whitehead PJP, Bauchot ML, Hureau JC, Nielsen J, Torto-nese E (1986) Fishes of the North-Eastern Atlantic and the Mediterranean. I, II and III. UNESCO Press, Paris
Editorial responsibility: Otto Kinne (Editor-in-Chief), Oldendorf/Luhe, Germany
Submitted: April 25, 2006; Accepted: August 18, 2006 Proofs received from author(s): February 22, 2007