Assessing the socio
-
economic benefits from green and blue
space rehabilitation: a case study for the Confluence area in
Lyon
Miguel SARAIVA, Centre for Environmental and Marine Studies (CESAM) of the University of Aveiro, Portugal. Corresponding author, miguelsaraiva@ua.pt
Peter ROEBELING, Centre for Environmental and Marine Studies (CESAM) of the University of Aveiro, Portugal, peter.roebeling@ua.pt
Anna PALLA, Department of Civil, Chemical and Environmental Engineering (DICCA), University of Genova, Italy, anna.palla@unige.it
Ilaria GNECCO, Department of Civil, Chemical and Environmental Engineering (DICCA), University of Genova, Italy, ilaria.gnecco@unige.it
Teresa FIDELIS, Department of the Environment and Planning of the University of Aveiro, Portugal, teresafidelis@ua.pt
Filomena MARTINS, Department of the Environment and Planning of the University of Aveiro, Portugal, filomena@ua.pt
Shortened abstract
This paper aims to demonstrate the added socio-economic value of green/blue spaces in urban areas. The Sustainable Urban Landscape Development (SULD) hedonic pricing simulation model is applied to the case-study of Confluence in Lyon, France. Scenario simulations are performed for the establishment of urban parks, along with the requalification of riverfronts and development of road infrastructure. Results show that the first two interventions (parks and parks plus requalification) attract high-income households and, hence, lead to increases in real estate values up to +28%. The latter intervention (parks plus new road infrastructure) also attracts low-income households, which leads to a smaller increase in real estate values. SULD aids in improving urban planning strategies, in terms of drafting plans, public discussion and monitoring.
1. Introduction
As urban areas grew, developed and evolved over the past century, green and blue (g/b) spaces have always been under scrutiny, pressure or risk, being sometimes regarded as potentially profitable residential, industrial or waste-disposal sites. Even where this has not occurred, urban g/b spaces have often been secondary on urban growth agendas, as their maintenance and/or rehabilitation has not been deemed urgent in the short term and, hence, they have usually not been integrated in spatial development and management policies. This has resulted in insufficient public and political support as well as in a lack of awareness from stakeholders on the added value effective g/b space management can bring to spatial development.
However g/b spaces effectively make an important contribution to urban society and sustainability (see TEEB, 2011). It is not a question of ‘just’ providing important ecosystem services and leisure areas (Chiesura, 2004, Costanza et al., 1997), it has also been shown that g/b spaces can stimulate higher real estate prices, as well as prevent problems and financial losses in the medium-long term through, for example, flood risk mitigation (Baptista, 2013, Zhang et al., 2012). Studies from the economic/land-use literature have systematically been exploring how, and to what extent, urban environment amenities impact on the distribution of residential land-use, on property values, and on the social-mix. This has been determined in various ways, such as using contingent valuation methods – a survey-based
economic technique that asks dwellers in a hypothetical market how much they are willing to pay for a specific public good (Chiesura, 2004, Salazar and Menendez, 2007). The most popular approach has been the application of hedonic pricing models – a regression method that estimates the economic value of properties as a function of the proximity to environmental and urban amenities. Such models have had a wide spatial application, from the US (Crompton, 2005, Irwin et al., 2014, Netusil, 2013), to the UK (Gibbons et al., 2014), Denmark (Panduro and Veie, 2013), Austria (Amrusch and Feilmayr, 2009), China (Jiao and Liu, 2010), Japan (Hoshino and Kuriyama, 2010) or the Check Republic (Melichar and Kaprova, 2013). Yet the major criticism to hedonic pricing models is that they require previously observed data and, in the words of Crompton (2005), “a threshold number of property sales to have occurred around a park to generate the market data needed to undertake the analyses”. In many cases, this data may be insufficient, missing or hard to come by. Only very few studies have applied hedonic pricing simulation models to determine the added value of g/b space (Wu and Plantinga, 2003, Roebeling et al., 2007b). The difference is that, although based on empirical relationships, simulation models are able to estimate added values of amenities that do not yet exist (and for which no surrounding property sales data exist) and, therefore, constitute a powerful tool when addressing future planning and rehabilitation of urban spaces.
This paper’s main goal is to assess and compare the socio-economic impacts of potential g/b space development scenarios in the Confluence area in Lyon, France. To this end, we use the Sustainable Urban Landscape Development (SULD) scenario simulation decision support tool (Roebeling et al., 2007b). First, the SULD is contextualized in the economic land-use modeling literature, as to highlight how it differs from the most commonly used models. Then the Confluence case-study and the proposed developed scenarios (namely the establishment of urban parks, the requalification of riverfronts, and the development of road infrastructure) are presented. Lastly the SULD is applied, results are discussed and conclusions are drawn concerning the projected differences in land-use distribution, population density, household distribution patterns, and real estate values.
2. The economic land-use modeling background and the decision support tool
Land-use change patterns have been attributed to a wide range of variables (economic, demographical, morphological), and consequently have been the object of a wide range of models used for explanatory, forecasting and simulation purposes. For the same reason, and because they are developed by scholars with different backgrounds and purposes, these models have failed to be classified under clear and consensual headings. Overlap in characteristics of different models and the convergence of models to a more integrated approach (see also Ward et al., 2003) has led to a plural typology within the literature. Reviews over the last ten years have usually distinguished between non-economic and economic models of land-use change (Brady and Irwin, 2011, Eppink et al., 2004, Irwin and Geoghegan, 2001, Roebeling et al., 2007a).
2.1. Non-economic models
Non-economic models of land-use change have appeared mainly in environmental science and geographical literature. They are characterized by large scale exogenous forces and are spatially explicit, so they have proven more popular in describing land-use patterns at a macro-scale (Eppink et al., 2004, Parker et al., 2003, Roebeling et al., 2007a). These include (i) models of growth or land-use change which use heuristic decision rules based on historical land-use patterns (Andersson et al., 2002, Baker, 1989, Deal and Schunk, 2004, Eppink et al., 2004); (ii) spatially explicit discrete cell-based models known as ‘cellular automata’ (Deal and Schunk, 2004, Eppink et al., 2004, Irwin and Geoghegan, 2001, Parker et al., 2003, Wang, 2012); (iii) hybrid models where both the estimation and the simulation
capacity of the previous models can be joined (Syphard et al., 2005, White and Engelen, 2000); and finally (iv) multi-agent systems, which focus primarily on human actions and interactions, aggregated up over scales and time to form land-use patterns (Brown et al., 2004, Heckbert and Smajgl, 2005, Ligtenberg et al., 2004, Parker and Meretsky, 2004, White and Engelen, 2000, Benenson et al., 2005). The literature has criticized these models because a) they lack a conceptual economic structure, b) they cannot differentiate between the impact of endogenous interactions and spatially correlated exogenous forces/landscape features, c) they provide just one possible pattern-interaction solution, d) they seldom consider that external features may change over time, but not over space, and e) they don’t explain individual behavior (Irwin and Bockstael, 2002, Irwin and Geoghegan, 2001, Roebeling et al., 2007a). Even multi-agent systems which account for this behavior are very sensitive to the definition of original parameters and exhibit path-dependency (Parker et al., 2003).
2.2. Economic models
Economic models of land-use change, also called optimization models as they aim to optimize decision variables in order to maximize an objective function representing utility or profit (Eppink et al., 2004), are generally characterized by small scale processes, and thus allow the understanding of an individual’s response to incentive changes. According to Irwin and Geoghegan (2001) they can be either spatially or non-spatially explicit.
Non-spatially explicit models generally stem from the traditional Alonso-Muth- Mills economic model or bid-rent model (Mills, 1981, Mills and Hamilton, 1994, O'Sullivan, 2000). Here, the landscape is assumed to be a featureless plane, where any two residential locations are considered to be identical in their preferences, income and derived utility, and the only aspect that differentiates them is the distance to a given center (CBD), where they are assumed to commute on a daily basis (Wu, 2006). Therefore, the model considers that households only trade-off accessibility to the center against residential space. Other non-spatially explicit models include agent-interactions (that lead to individual location decisions that affect other individual’s decisions – Irwin and Bockstael, 2002) and regional economic models (that describe population and other economic flows across regions). These, according to Irwin and Geoghegan (2001), are more robust in explaining the emergence of agglomerations and urban spatial structure. Nonetheless, these models have been criticized for their lack of spatial explicitness, namely the fact that they fail to explain the impact of heterogeneous landscape features on the resulting land-use pattern (Mills and Hamilton, 1994, O'Sullivan, 2000, Roebeling et al., 2012).
More recent spatially explicit models have incorporated this spatial heterogeneity (see Irwin’s reviews – Brady and Irwin, 2011, Irwin, 2010, Irwin and Geoghegan, 2001). Some consist of updates of cellular automata (Caruso et al., 2007, López and Sánchez, 2012, Wang, 2012) or multi-agent systems models (Magliocca et al., 2012, Magliocca et al., 2011), with an added economic component. Yet most of the previous mentioned critics may prevail and hence hedonic pricing models have appeared has an alternative that not only determines property values as distance to urban center(s), but also includes more specific locational features in the landscape. Hedonic pricing models (reviewed in Malpezzi, 2002, Sirmans et al., 2005, Waltert and Schlapfer, 2010) therefore estimate what individuals are willing to pay for different attributes of a house and its surroundings, and consequently the landscape configuration. In the literature a differentiation can be made between hedonic pricing regression and hedonic pricing simulation models.
Hedonic pricing regression models have mostly dealt with the subject of green spaces, including woodlands or forests (Garrod and Willis, 1992, Ham et al., 2012, Tyrvainen and Miettinen, 2000), agricultural land (Bastian et al., 2002) and different types of urban green spaces or parks (Bark et al., 2011, Cho et al., 2008, Hoshino and Kuriyama, 2010, Kong et al., 2007, Melichar and Kaprova, 2013, Panduro and Veie, 2013, Salazar and Menendez, 2007). Other studies assess the influence of micro-scale elements, such as trees (Mansfield
et al., 2005, Pandit et al., 2013) grass (Saphores and Li, 2012), plant species (Amrusch and Feilmayr, 2009) and domestic gardens (Gibbons et al., 2014). Conclusions have mostly been threefold: proximity to green elements is (almost) always an asset, the derived benefits differ according to the type of green space, and households with different utility functions value differently environmental characteristics.
On the other hand, hedonic pricing simulation models have been extensively applied in development and planning processes to investigate, for example, the efficiency and distributional impacts of alternative policy measures designed to assess smart growth, land conversion (Bento et al., 2006, Irwin and Bockstael, 2004) and effects on property values (Cotteleer and Peerlings, 2011). Authors have also examined urban sprawl (Irwin and Bockstael, 2002, Irwin and Bockstael, 2004, Wu, 2003, Wu and Plantinga, 2003) optimal city size and urban concentration (Brueckner et al., 1999, Henderson, 2003), and geographic/amenity features and land development patterns (Wu, 2003, 2006, Wu and Plantinga, 2003). Finally, Wu and Irwin (2003) and Roebeling (et al., 2007b) developed a dynamic spatially explicit model that explores the interaction between land-use pattern and water quality.
2.3. The Sustainable Urban Landscape Development (SULD) decision support tool Although these models have made considerable contributions as they have incorporated the spatial explicitness of the landscape, authors still stress a number of shortcomings of the approaches developed to date (Eppink et al., 2004, Parker et al., 2003, Roebeling et al., 2007a). Equation based models require market equilibrium conditions, consider a relatively small influencing area (large-scale exogenous forces are generally ignored) and require simplifying assumptions in order to achieve analytical tractability. Increases in landscape heterogeneity, number of agents or spatial interactions, and data detail regarding socio-economic factors diminish the chances of arriving at an analytical solution. For that reason models have omitted variables and been case- or variable-specific, something which obviously undermines their ability to accurately identify economic trends (Kuminoff et al., 2010). Furthermore, with few exceptions, the added value of g/b spaces is determined based on existing data and the ability to make future projections is undermined. In this sense, simulation models offer a noteworthy alternative, but most of these studies are based on abstract problems (Irwin and Geoghegan, 2001, Wu, 2006) and real world applications are scarce. The effect of size and composition of population growth on environmental (Dendrinos, 2000, Wu and Irwin, 2003) and/or urban amenities (Brueckner et al., 1999, Wu and Plantinga, 2003) is also usually not considered, or is considered exogenously.
The Sustainable Urban Landscape Development (SULD) decision support tool (Roebeling et al., 2007b), is a GIS-based optimization model that has been developed so as to enable more informed and equitable decision making regarding sustainable urban development and g/b space management. It builds on hedonic pricing theory that determines property values as a function of proximity to environmental and urban amenities, but it is not a static calculator, and can be used both to address real world problems (i.e. new planned developments) and to make simulated projections independent of real estate and land-use data. Furthermore population growth is exogenously determined, implying shifts in the demand curve to reach a state of equilibrium.
In essence the model determines the value of housing given its location relative to urban centers and environmental amenities – i.e. the equilibrium price for which demand for and supply of housing are equal (Roebeling et al., 2007b, Roebeling et al., 2007a). Households (the demand – Eq. 1) are characterized by their preferences for a certain set of goods and services: residential space S, other goods and services Z, and environmental amenities e. The utility obtained by households in each location is a function of their preferences, distance to environmental amenities and income. Households maximize their utility U at location i subject to the budget constraint y, which is spent on housing S, other goods and services Z, and transportation between the residential area and the urban center (pXx):
Ui = household utility Si = residential space Zi = other goods and services
ei = environmental amenity value (1) y = household income
pih = rental price housing px = commuting costs xi = distance to urban centre
The environmental amenity value ei that the household experiences at location i is decreasing with distance from the amenity source, and is determined by:
(2) where a is the environmental amenity, η is the amenity distribution factor, and where zi is the distance from location i to the environmental amenity a. The household’s bid-rent price at a given location can now be derived (see Roebeling et al., 2007a), i.e., the household’s maximum willingness to pay for housing, given their utility obtained.
Developers (the supply – Eq. 3) optimize their profit by trading off returns from housing development density net of associated development costs, subject to households’ willingness to pay for housing. They aim to maximize their profit
π
at location i, which is given by the revenue of construction (phD) net of incurred development costs (l + c0 + Dη):π i = developer’s profit Di = development density pi
h
= rental price housing
li = opportunity cost land
(3)
c0+ Di
η
= construction costs ni = household density Si = residential space
The developers bid-price for land can then be derived (see Roebeling et al., 2007a), i.e. they will develop when residential land rents (pihDi) are larger than the opportunity cost of development (li + c0 + Diη), where the latter is equal to the forgone land rents (li; e.g. revenues from agriculture) plus the value of the capital invested in converting the land (c0 + Diη). Residential development takes place where demand equals supply. The land rent price at a given location can then be derived, and development patterns for population size are determined given the location of environmental and urban amenities (Roebeling et al., 2007a).
The SULD decision support tool builds on a numerical application (Roebeling et al., 2007a, Roebeling et al., 2014) of the above described classic urban economic model with environmental amenities, using GAMS 21.3 (Brooke et al., 1998). The study area is divided
i x i i h iS Z p x p y= + + subject to
(
)
µ µ ε i i i i i i Z SU
S
Z
S
Z
e
Max
i i ) 1 ( ,,
−=
i z ia
e
=
1
+
⋅
exp
−η)
(
)
(
0 ηπ
i i i h i i i DD
p
D
l
c
D
Max
i+
+
−
=
i i in
S
D
=
with
into a grid of 185*185 cells, and the data is treated in raster format. Starting from a base-scenario with specific land-use characteristics and a set of distances to existing amenities, and relying on scientific and stakeholder input to assess valid future scenarios, the model calculates the equilibrium price for housing as a function of demand and supply. It determines the location of residential development, the residential development density, the population density, the housing quantity, the living space and the real estate value, taking into account households’ willingness to pay as well as the opportunity cost of land, according to changes made in land-use, location of amenities or commuting costs. It should be noted that land use conversion can only take place between residential and user-defined non-residential land-uses – the remaining land-uses (e.g. forest, water) are fixed.
3. The Confluence case study and the application of the SULD
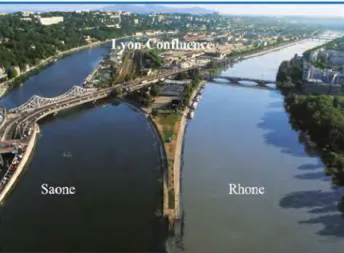
The city of Lyon is currently addressing an urban renewal challenge in an area located in the Perrache Peninsula – the “Lyon Confluence” project (Figure 1). As described in Roebeling et al (2012), on one hand this area has had problems related to water management and flood control, namely maintenance difficulties caused by silting pipes or inadequately sized infrastructures; pollution of the receiving bodies during storm events due to overflow devices; and improper conditions for river side residents caused by the presence of rats, odor pollution and the risk of flooding. On the other, this area has long been restricted to industry and transport facilities, and therefore had the risk of becoming yet another brownfield. Furthermore, the A7 Highway, has become a man-made barrier between the Confluence and the Rhone river, forcing the area for many years to turn its back on the water.
The “Lyon Confluence” project aims therefore to transform this area of approximately 2.5 km2 into a new downtown district, opened to the water, increasing its number of inhabitants from around 17.000 to 25.000 by 2030, creating 14.000 new jobs, and improving the natural environment as to provide new ecosystem services (leisure and cultural infrastructures). The latter by developing urban g/b spaces, and by integrating storm water management in the cityscape. Proposed solutions for the area include enhancing the receiving bodies’ water quality, protecting the water resources, reducing flood risks by rehabilitating the sewer networks, and reducing investment and operation costs of technical solutions, by implementing the options that best fit sustainability criteria (Roebeling et al., 2012).
Figure 1 – The Lyon Confluence case-study area
In partnership with the Gran Lyon urban community (http://www.grandlyon.com/), the application of the SULD was expected to provide spatially explicit information on the (added) value of g/b space preservation/rehabilitation scenarios, in terms of household welfare,
property values and flood control in the peninsula, as well as on the preferred locations and types of urban development needed to house population. The study area comprises a square of 2.850*2.850 meters, designed to contain the Confluence but also to be sufficiently large to account for edge effects, which was then transformed into a raster image with a 15.4 meters cell size (185*185 cells).
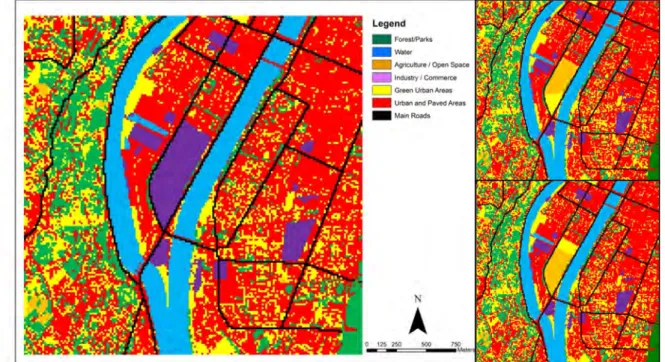
Starting from the current situation (base-scenario), two scenarios were assessed: the establishment of two different urban parks (Scenarios 1 and 2 respectively), as this is a local planning priority. In each case the remaining brownfield area was deemed as open space, available for development (see Figure 2). Based on these two scenarios, the remaining scenarios were developed – namely the requalification of the riverfront (including the requalification of Highway A7; Scenarios 1a and 2a), and the development of a new road infrastructure (including new bridges over the Rhone; Scenarios 1b and 2b).
The numerical application of SULD is based on a population comprising three household types (low, medium and high income households), differentiated by number of households, levels of expendable income (y1=18.050, y2=43.862, y3=69.312…) and shares of housing expenditures (
µ
1=0.290;µ
2=0.285;µ
3=0.275) as well as levels of utility (u1=3.300 forHHtype1, u2=8.019 for HHtype2 and u3=12.672 for HHtype3). All household types share the
same appreciation for environmental amenities (
ε
=0.08; η =1.0), annual commuting costs (px=375 €/km), opportunity cost of land (li=1,000 €/yr) and development costs (c0=0 and η=1.75). The model assumes that the number of inhabitants of each household type remains constant – what may change is their spatial distribution. The study area includes eight environmental amenities (seven parks and the water, with values of a=10, a=7.5 and a=5 for high, medium and low quality environmental amenities, respectively) and twelve urban centers (transit stations, public facilities, and education, entertainment, shopping and cultural centers). Distances to environmental amenities and urban centers are based on straight-line and road-network distances, respectively.
Figure 2 – Land-use map for the Base scenario (left) and Scenarios 1 (upper-right) and 2 (lower-right)
4. Results and discussion
4.1. Base-run and Scenarios 1 and 2
For the base scenario (i.e. existing conditions are maintained), we see mainly an urban area (339 ha), albeit a strong presence of green spaces is detected (155 ha of urban parks and
102 ha of forest). Only 12% of this green area is located in the Confluence intervention area, mainly on the East-side, while on the West-side the area is dominated by the industrial brownfield. The area is mainly low-rise (seldom over 3 stories high) with 60.000 inhabitants, of which around 50% correspond to low-income households (HHtypes1) and only 12.5% correspond to high-income households (HHtypes3, see Table 1). This discrepancy is even more acute in the Confluence area, where almost 70% of households correspond to HHtypes1, that live close to the brownfield, urban centers and the main roads. High income households live in more attractive areas, close to the waterfront and urban parks.
The total built area (housing quantity) is almost 1.6*106 m2, where around 20% corresponds to HHtypes1, 60% to HHtypes2 and 20% to HHtypes3. The total floor space (development density) covers almost double this area (2.9*106 m2), while noting that low income households are located in more densely populated areas (over 3.8 households per grid cell). This situation is even more acute in the Confluence area, where almost 50% of the total floor space corresponds to HHtypes1. On the other hand, higher income areas have the lowest household densities. Available living space is on average 98 m2/hh in the study area, and about 84 m2/hh in the Confluence area, ranging between 59 m2/hh for HHtypes1 and 158 m2/hh for HHtypes3.
Lastly, real estate (rental) values are equal, on average, to 95 €/m2/yr, varying from 88 €/m2/yr for HHtypes1 to 118 €/m2/yr for HHtypes3. Larger values can be observed in attractive high income areas (close to the river and green spaces), whilst lower values can be observed in low income areas (close to main roads and urban centers as well as the railway station). The total real estate (rental) value for the study area is 288 million Euros per year, and 75 mEuro/yr for the Confluence area. It should be noted that the average values per household type are greater in this area – despite the brownfield it is an attractive zone containing a considerable number of urban and environmental amenities. It is this potential that the proposed interventions wish to maximize.
In each of the Scenarios 1 and 2 a new urban park is established in the Confluence brownfield area, and the remaining brownfield area becomes available for urban residential development (Figure 2). In Scenario 1 the park is situated in the South end of the brownfield, whereas in Scenario 2 it is located on the North end. Overall, Scenario 2 seems to present greater benefits, both to the study area and the Confluence. The location selected for the park in Scenario 1 is near relevant road infrastructure and environmental amenities. Therefore, actually, this location will produce greater economic and social benefits if it is used for housing, and the Park is located elsewhere (Scenario 2). Furthermore, in Scenario 1 the park’s range of influence only stretches northward as it is limited by roads and rivers in other directions. On the contrary, in Scenario 2 the park can affect immediate urban areas both northwards and southwards.
Because of this, even though the park of Scenario 1 is a little larger than that of Scenario 2, the reduction of total urban area will be less in Scenario 1 (-3.5%) than in Scenario 2 (-3.9%). Similar tendencies can be observed for other variables; development density, housing quantity and living space. Both Scenarios result in a more condensed city (the open space area practically doubles, located at the edges of the study area) and people are willing to live in more densely populated areas and smaller houses in order to live closer to the environmental amenities. However there is a clear preference for Scenario 2. The population in the Confluence, for example, is estimated to increase by +21% in Scenario 2, against only +17% in Scenario 1, much closer to the proposed goal of 25.000 inhabitants by 2030.
Built area (housing quantity) and living space decrease by respectively -5.6% and -1.5% in Scenario 1, and decrease by -6.3% and -1.7% in Scenario 2. This decrease is much more accentuated for medium and higher income households, meaning that they are willing to move to the more attractive areas at the expense of the size of their homes. In Scenario 2 the decrease in these two variables is even more accentuated, and the values for HHtypes2 and 3 are almost the same. Both types are significantly attracted to this scenario; there is a 37% population increase for each type in the Confluence area.
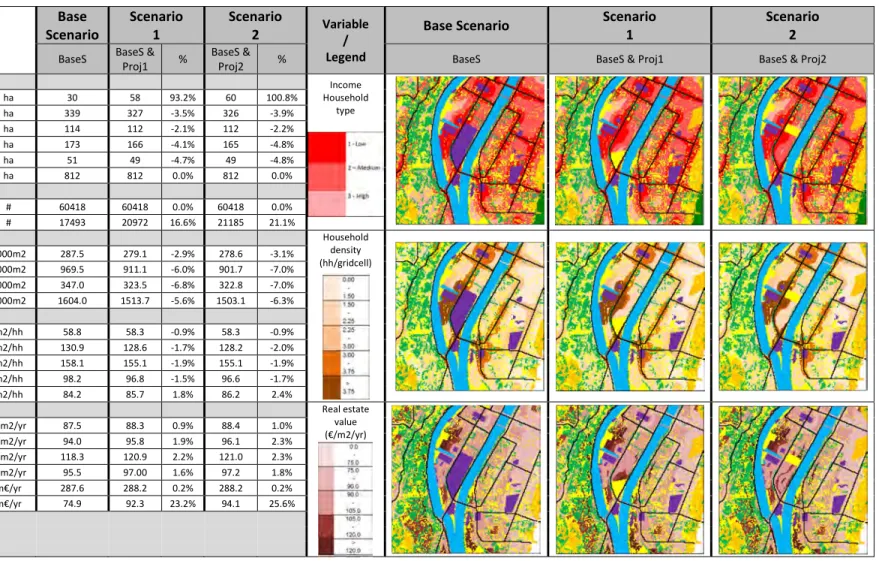
Model Area Base Scenario Scenario 1 Scenario 2 Variable / Legend
Base Scenario Scenario
1
Scenario 2
BaseS BaseS &
Proj1 %
BaseS &
Proj2 % BaseS BaseS & Proj1 BaseS & Proj2
Land-use: Income Household type - Open space ha 30 58 93.2% 60 100.8% - Urban ha 339 327 -3.5% 326 -3.9% - HHtype1 ha 114 112 -2.1% 112 -2.2% - HHtype2 ha 173 166 -4.1% 165 -4.8% - HHtype3 ha 51 49 -4.7% 49 -4.8%
- Total (all other uses constant) ha 812 812 0.0% 812 0.0%
Population:
- Model area # 60418 60418 0.0% 60418 0.0%
- Confluence area # 17493 20972 16.6% 21185 21.1%
Housing quantity: Household
density (hh/gridcell) - HHtype1 1000m2 287.5 279.1 -2.9% 278.6 -3.1% - HHtype2 1000m2 969.5 911.1 -6.0% 901.7 -7.0% - HHtype3 1000m2 347.0 323.5 -6.8% 322.8 -7.0% - total 1000m2 1604.0 1513.7 -5.6% 1503.1 -6.3% Living space: - HHtype1 m2/hh 58.8 58.3 -0.9% 58.3 -0.9% - HHtype2 m2/hh 130.9 128.6 -1.7% 128.2 -2.0% - HHtype3 m2/hh 158.1 155.1 -1.9% 155.1 -1.9% - average m2/hh 98.2 96.8 -1.5% 96.6 -1.7%
- average for the Confluence m2/hh 84.2 85.7 1.8% 86.2 2.4%
Real estate value: Real estate
value (€/m2/yr) - HHtype1 €/m2/yr 87.5 88.3 0.9% 88.4 1.0% - HHtype2 €/m2/yr 94.0 95.8 1.9% 96.1 2.3% - HHtype3 €/m2/yr 118.3 120.9 2.2% 121.0 2.3% - average €/m2/yr 95.5 97.00 1.6% 97.2 1.8% - total m€/yr 287.6 288.2 0.2% 288.2 0.2%
- total for the Confluence m€/yr 74.9 92.3 23.2% 94.1 25.6%
Even so, HHtypes3 still prefer less densely populated areas and tend to locate on the West side of the parks, away from urban centers and closer to the water. It is also noteworthy how in Scenario 2, HHtypes2 and 3 occupy almost the entire South edge of the former brownfield. For such reason in this Scenario living space area increases in average +2.4% in the Confluence. As well, any of these interventions has a positive impact on total real-estate (rental) values: on average +0.2% for the study area and, respectively, +23% and +26% for Scenarios 1 and 2 in the Confluence area.
4.2. Scenarios 1a, 2a, 1b and 2b
Scenarios 1a and 2a add to the establishment of each of the parks the requalification of the Rhone riverfront, where the Highway A7 will be requalified to a local road thus allowing greater interaction of Confluence households with the water. This intervention will make the study area contract even more, in relation to the Base Scenario, in terms of urban residential area (-4.1% for Scenario 1a and -4.4% for Scenario 2a – See Table 2), indicating that the Confluence will become even more attractive. The open space area increases in the periphery, as households move to the Confluence. HHtypes2 present the largest contraction in urban land use for both Scenarios (-5.0% and -5.5% respectively), albeit with the same order of magnitude as HHtypes3. When only the parks were established, the added value had been mostly obtained by high income households; when the requalification of the riverfront is added to these parks, the added value is large enough to benefit medium-income households as well. Hence, they are willing to reduce their living space as to dwell in this attractive area. Consequently, there is a decrease in housing quantity of -7.3% for HHtypes2 and -7.2% for HHtypes3 in Scenario 1a; and of -7.9% for HHtypes2 and -7.6% for HHtypes3 in Scenario 2a. There is also a decrease in living space of -2.1% for HHtypes2 and -2.0% for HHtypes3 in Scenario 1a; and of -2.3% for HHtypes2 and -2.1%for HHtypes3 in Scenario 2a. These values are twice as large as those related to HHtypes1, that are less able to benefit from these added amenities. Note that these values are usually greater in Scenario 2a. The contraction of the urban area is obviously translated by significant increases in the centrality and urbanity of the Confluence. The population increases by 21% for Scenario 1a and 22% for Scenario 2a (an increase of, respectively, 4 and 1 percent points in relation to Scenarios 1 and 2). While the increase in population and urban residential area for HHtypes1 and 2 remains about the same in relation to Scenarios 1 and 2 (around +13% and +35%, respectively), the increase for HHtypes3 has been from +35% in Scenarios 1 and 2 to over +50% in Scenarios 1a and 2a. This trend can also be observed for development density and housing quantity. That is, high income households and housing considerably increase in the Confluence when a park is established and the riverfront is requalified.
The major locational difference to Scenarios 1 and 2 is that high income households now also tend to locate on the riverside area North of the brownfield. This allows for an urban continuity of high income neighborhoods in Scenario 1a (as the park is at an extremity), while this is not possible in Scenario 2a. Yet in Scenario 2a high income households (HHtypes3) can locate on both sides of the park, maximizing its benefits, and the core area of HHtypes3 (at the South end of the Confluence) substantially increases, even in relation to Scenario 2. This obviously reflects itself in terms of real estate (rental) values. An overall increase of only 0.2% is again seen for the study area, but the increase for the Confluence area is around 26% for Scenario 1a and 28% for Scenario 2a – the largest increase of all accessed scenarios. Note that the largest increases in real estate (rental) values are obtained by the medium and high income households.
Lastly, Scenarios 1b and 2b add to the implementation of each park the development of a new road infrastructure, including two new bridges over the Rhone, linking the Confluence to the Eastern part of Lyon. The increase in accessibility between these two areas does not significantly affect its attraction potential. The overall gains from these two scenarios are lower than those obtained from Scenarios 1 and 2, and even lower than those obtained for Scenarios 1a and 2a.
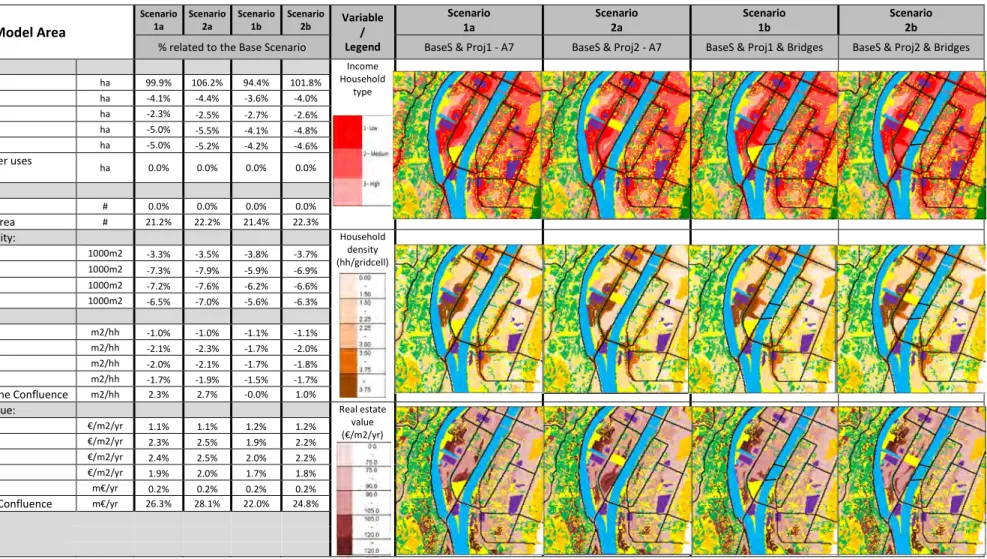
Model Area Scenario 1a Scenario 2a Scenario 1b Scenario 2b Variable / Legend Scenario 1a Scenario 2a Scenario 1b Scenario 2b
% related to the Base Scenario BaseS & Proj1 - A7 BaseS & Proj2 - A7 BaseS & Proj1 & Bridges BaseS & Proj2 & Bridges
Land-use: Income Household type - Open space ha 99.9% 106.2% 94.4% 101.8% - Urban ha -4.1% -4.4% -3.6% -4.0% - HHtype1 ha -2.3% -2.5% -2.7% -2.6% - HHtype2 ha -5.0% -5.5% -4.1% -4.8% - HHtype3 ha -5.0% -5.2% -4.2% -4.6%
- Total (all other uses
constant) ha 0.0% 0.0% 0.0% 0.0%
Population:
- Model area # 0.0% 0.0% 0.0% 0.0%
- Confluence area # 21.2% 22.2% 21.4% 22.3%
Housing quantity: Household
density (hh/gridcell) - HHtype1 1000m2 -3.3% -3.5% -3.8% -3.7% - HHtype2 1000m2 -7.3% -7.9% -5.9% -6.9% - HHtype3 1000m2 -7.2% -7.6% -6.2% -6.6% - total 1000m2 -6.5% -7.0% -5.6% -6.3% Living space: - HHtype1 m2/hh -1.0% -1.0% -1.1% -1.1% - HHtype2 m2/hh -2.1% -2.3% -1.7% -2.0% - HHtype3 m2/hh -2.0% -2.1% -1.7% -1.8% - average m2/hh -1.7% -1.9% -1.5% -1.7%
- average for the Confluence m2/hh 2.3% 2.7% -0.0% 1.0%
Real estate value: Real estate
value (€/m2/yr) - HHtype1 €/m2/yr 1.1% 1.1% 1.2% 1.2% - HHtype2 €/m2/yr 2.3% 2.5% 1.9% 2.2% - HHtype3 €/m2/yr 2.4% 2.5% 2.0% 2.2% - average €/m2/yr 1.9% 2.0% 1.7% 1.8% - total m€/yr 0.2% 0.2% 0.2% 0.2%
- total for the Confluence m€/yr 26.3% 28.1% 22.0% 24.8%
Low and medium income households now locate around the roads leading to the bridges, while noting that the areas become less attractive for high-income households. In Scenario 2b this situation is somewhat mitigated, as one of the bridges is in line with the Park.
The city contracts less than in Scenarios 1a and 2a. The urban residential area decreases with -3.6% in Scenario 1b and -4.0% in Scenario 2b – in particular for HHtypes1. Looking at the Confluence, it is observed a substantial decrease in HHtypes3 in favor of HHtypes1. This means that the Confluence area will become more attractive for low income households though less attractive for high income households. Similar tendencies can be observed for the other variables; development density, housing quantity and living space. For these variables, the average values, and the values for HHtypes2, are very close to those of Scenarios 1 and 2, implying that the inclusion of bridges may not be of significance. But for HHtypes1, the values increase when the Confluence area is considered. The areas close to the new major road infrastructures leading to the bridges cease to be attractive to medium and higher income families, and HHtypes1 have now the tendency to live closer together near these spaces. In Scenario 1b, HHtypes3 are not located near the new park at all, whereas in Scenario 2b they locate only in a small strip on the Northern side of it.
Overall, this leads to reductions in real estate (rental) values – in particular in the areas surrounding the access roads to the bridges. The concentration of medium and high income families in the South end of the former brownfield observed in Scenario 2a does not occur in Scenario 2b, precisely because the southern bridge is aligned with this area. In Scenario 1b this bridge is also too close to the established park, diminishing its potential attraction to large income families. Consequently, HHtypes1 are the only ones that, overall, present increases of real estate value in relation to Scenarios 1 and 2 (1.1% for Scenario1b and 1.2% for Scenario2b). Considering only the Confluence, HHtypes1 and HHtypes2 increase in value as compared to Scenarios1 and 2, but not as compared to Scenarios 1a and 2a. HHtypes3, on the other hand, reflect the smallest decrease in value as compared to the base scenario (-0.1% for Scenario 1b and -0.6% for Scenario 2b) as they neither seek new locations nor compete for land. The total real estate (rental) value increases with 22% for Scenario 1b and with 25% for Scenario 2b – the lowest increase of all accessed scenarios. A solution of bridges and new road infrastructure undermines the influence of the proposed urban parks and, hence, an alternative location for the bridges may be considered.
5. Concluding remarks
Using the Sustainable Urban Landscape Development (SULD) decision support tool, this study shows that the establishment of high quality urban parks, along with the requalification of the riverfront, can be extremely beneficial in changing the landscape and the identity of the Confluence. Three main insights have been obtained. First, the urban parks bring added value to residents in urban areas, attracting medium and high income households. Second, requalification of riverfronts brings additional benefits, attracting in particular high income households. Note that in both cases these benefits are proportional to the area of residential land-use immediately surrounding the g/b space. Finally, establishment of new road infrastructure may reduce the benefits of g/b spaces when constructed in their vicinity, as they attract low income households. Consequently, the value added of g/b space is dependent on the location, size and type of intervention relative to existing urban residential areas, urban centers and environmental amenities.
These results, their visualization and reflected insights showcase the potential of the SULD decision support tool to improve urban planning practice. The contributions may be twofold. Firstly, it may improve the drafting of urban plans when alternative planning strategies and land use options are being considered. By making available new information, the decision support tool may help to better identify and configure land-use development options taking into account the environmental and economic values offered by g/b spaces. It may also facilitate stronger synergies between land-use and water resources protection (Fidelis and Roebeling, 2014) and nature conservation.
Secondly, SULD facilitates the planning process and public discussion. By improving stakeholder awareness of the different dimensions of urban land-use and associated environmental-economic costs and benefits, it enriches the public discussion, adds transparency and improves public gains into urban planning decision-making processes. Particularly concerning participatory planning and the participatory process itself, the prospect of a high quality g/b space can exert considerable attraction and potentially enhance the level, intensity and quality of participation. For a successful participation process it is required that ‘enough’ people are involved (in terms of number and diversity of social groups) and that the focus is on the richness of the discussion.
Consequently, the SULD decision support tool is not an aim in itself but the starting point of a process that has already been applied in several cities, including Copenhagen, Eindhoven and Aveiro. It facilitates participatory planning and scenario development, creating confidence and familiarity with the model and its outputs, encouraging stakeholders to reflect about their reality and future possibilities, and effectively engaging them in the design of urban development plans where the value of water and green spaces may assume a forefront position.
Acknowledgements
The contribution and support of the Centre for Environmental and Marine Studies (CESAM) and the Department of Environment and Planning (DAO) at the University of Aveiro for facilitating this research is gratefully acknowledged. This paper has been developed within the context of the Aqua-Add project (Deploying the added value of water in local and regional development; http://aqua-add.eu/), co-financed by the European Regional Development Fund (ERDF) and the 11 project partners through the INTERREG IVC program. In addition, this work was supported by European Funds through COMPETE and by National Funds through the Portuguese Science Foundation (FCT) within the context of the project PEst-C/MAR/LA0017/2013.
References
AMRUSCH, P. & FEILMAYR, W. 2009. Nonmarket valuation of inner-city ecological values. Ecosystems
and Sustainable Development Vii, 122, 415-424.
ANDERSSON, C., LINDGREN, K., RASMUSSEN, S. & WHITE, R. 2002. Urban growth simulation from "first principles". Physical Review E, 66.
BAKER, W. L. 1989. A review of models of landscape change. Landscape Ecology, 2, 112-134.
BAPTISTA, C. 2013. Benefícios da infraestrutura verde/azul para o controlo de cheias. Master's Degree, University of Aveiro.
BARK, R. H., OSGOOD, D. E., COLBY, B. G. & HALPER, E. B. 2011. How Do Homebuyers Value Different Types of Green Space? Journal of Agricultural and Resource Economics, 36, 395-415.
BASTIAN, C. T., MCLEOD, D. M., GERMINO, M. J., REINERS, W. A. & BLASKO, B. J. 2002. Environmental amenities and agricultural land values: a hedonic model using geographic information systems data. Ecological Economics, 40, 337-349.
BENENSON, I., ARONOVICH, S. & NOAM, S. 2005. Let’s talk objects: generic methodology for urban high-resolution simulation. Computers, Environment and Urban Systems, 29, 425-453.
BENTO, A. M., FRANCO, S. F. & KAFFINE, D. 2006. The efficiency and distributional impacts of alternative anti-sprawl policies. Journal of Urban Economics, 59, 121-141.
BRADY, M. & IRWIN, E. 2011. Accounting for Spatial Effects in Economic Models of Land Use: Recent Developments and Challenges Ahead. Environmental & Resource Economics, 48, 487-509. BROOKE, A., KENDRICK, D., MEERHAUS, A. & RAMAN, R. 1998. GAMS release 2.5: a user’s guide.
BROWN, D. G., PAGE, S. E., RIOLO, R. & RAND, W. 2004. Agent-based and analytical modeling to evaluate the effectiveness of greenbelts. Environmental Modelling & Software, 19, 1097-1109.
BRUECKNER, J. K., THISSE, J. F. & ZENOU, Y. 1999. Why is central Paris rich and downtown Detroit poor? An amenity-based theory. European Economic Review, 43, 91-107.
CARUSO, G., PEETERS, D., CAVAILHES, J. & ROUNSEVELL, M. 2007. Spatial configurations in a periurban city. A cellular automata-based microeconomic model. Regional Science and Urban
Economics, 37, 542-567.
CHIESURA, A. 2004. The role of urban parks for the sustainable city. Landscape and Urban Planning, 68, 129-138.
CHO, S. H., POUDYAL, N. C. & ROBERTS, R. K. 2008. Spatial analysis of the amenity value of green open space. Ecological Economics, 66, 403-416.
COSTANZA, R., DARGE, R., DEGROOT, R., FARBER, S., GRASSO, M., HANNON, B., LIMBURG, K., NAEEM, S., ONEILL, R. V., PARUELO, J., RASKIN, R. G., SUTTON, P. & VANDENBELT, M. 1997. The value of the world's ecosystem services and natural capital. Nature, 387, 253-260. COTTELEER, G. & PEERLINGS, J. H. M. 2011. Spatial planning procedures and property prices: The role
of expectations. Landscape and Urban Planning, 100, 77-86.
CROMPTON, J. L. 2005. The Impact of parks on property values: empirical evidence from the past two decades in the United States. Managing Leisure, 10, 203-2018.
DEAL, B. & SCHUNK, D. 2004. Spatial dynamic modelling and urban land use transformation: a simulation approach to assessing the cost of urban sprawl. Ecological Economics, 51, 79-95. DENDRINOS, D. S. 2000. Land development and amenities: A predator-prey interaction. The Annals of
Regional Science, 34, 279-292.
EPPINK, F. V., VAN DEN BERGH, J. C. J. M. & RIETVELD, P. 2004. Modelling biodiversity and land use: urban growth, agriculture and nature in a wetland area. Ecological Economics, 51, 201-216. FIDELIS, T. & ROEBELING, P. C. 2014. Water resources and land use planning systems in Portugal -
Exploring better synergies through Ria de Aveiro. Land Use Policy, 39, 84-95.
GARROD, G. & WILLIS, K. 1992. The Environmental Economic-Impact of Woodland - a 2-Stage Hedonic Price Model of the Amenity Value of Forestry in Britain. Applied Economics, 24, 715-728.
GIBBONS, S., MOURATO, S. & RESENDE, G. M. 2014. The Amenity Value of English Nature: A Hedonic Price Approach. Environmental & Resource Economics, 57, 175-196.
HAM, C., CHAMP, P. A., LOOMIS, J. B. & REICH, R. M. 2012. Accounting for Heterogeneity of Public Lands in Hedonic Property Models. Land Economics, 88, 444-456.
HECKBERT, S. & SMAJGL, A. 2005. Analysing Urban Systems using Agent-Based Modelling. Modsim
2005: International Congress on Modelling and Simulation: Advances and Applications for Management and Decision Making, 134-140.
HENDERSON, V. 2003. The urbanization process and economic growth: The so-what question. Journal
of Economic Growth, 8, 47-71.
HOSHINO, T. & KURIYAMA, K. 2010. Measuring the Benefits of Neighbourhood Park Amenities: Application and Comparison of Spatial Hedonic Approaches. Environmental & Resource
Economics, 45, 429-444.
IRWIN, E. G. 2010. New Directions for Urban Economic Models of Land Use Change: Incorporating Spatial Dynamics and Heterogeneity*. Journal of Regional Science, 50, 65-91.
IRWIN, E. G. & BOCKSTAEL, N. E. 2002. Interacting agents, spatial externalities and the evolution of residential land use patterns. Journal of Economic Geography, 2, 31-54.
IRWIN, E. G. & BOCKSTAEL, N. E. 2004. Land use externalities, open space preservation, and urban sprawl. Regional Science and Urban Economics, 34, 705-725.
IRWIN, E. G. & GEOGHEGAN, J. 2001. Theory, data, methods: developing spatially explicit economic models of land use change. Agriculture Ecosystems & Environment, 85, 7-23.
IRWIN, E. G., JEANTY, P. W. & PARTRIDGE, M. D. 2014. Amenity Values versus Land Constraints: The Spatial Effects of Natural Landscape Features on Housing Values. Land Economics, 90, 61-78. JIAO, L. M. & LIU, Y. L. 2010. Geographic Field Model based hedonic valuation of urban open spaces
in Wuhan, China. Landscape and Urban Planning, 98, 47-55.
KONG, F. H., YIN, H. W. & NAKAGOSHI, N. 2007. Using GIS and landscape metrics in the hedonic price modeling of the amenity value of urban green space: A case study in Jinan City, China.
Landscape and Urban Planning, 79, 240-252.
KUMINOFF, N. V., PARMETER, C. F. & POPE, J. C. 2010. Which hedonic models can we trust to recover the marginal willingness to pay for environmental amenities? Journal of Environmental
Economics and Management, 60, 145-160.
LIGTENBERG, A., WACHOWICZ, M., BREGT, A. K., BEULENS, A. & KETTENIS, D. L. 2004. A design and application of a multi-agent system for simulation of multi-actor spatial planning. Journal of
Environmental Management, 72, 43-55.
LÓPEZ, M. & SÁNCHEZ, N. 2012. Un modelo de simulación computacional integrado a sig para explorar la dinámica de crecimiento de la Zona Metropolitana de la Ciudad de México (1998-2008). Estudios Demográficos y Urbanos, 28, 594-644.
MAGLIOCCA, N., MCCONNELL, V., WALLS, M. & SAFIROVA, E. 2012. Zoning on the urban fringe: Results from a new approach to modeling land and housing markets. Regional Science and
Urban Economics, 42, 198-210.
MAGLIOCCA, N., SAFIROVA, E., MCCONNELL, V. & WALLS, M. 2011. An economic agent-based model of coupled housing and land markets (CHALMS). Computers Environment and Urban Systems, 35, 183-191.
MALPEZZI, S. 2002. Hedonic Pricing Models: A Selective and Applied Review. In: O’SULLIVAN, K. G. A. A. (ed.) Housing Economics: Essays in Honor of Duncan Maclennan. Wisconsin.
MANSFIELD, C., PATTANAYAK, S. K., MCDOW, W., MCDONALD, R. & HALPIN, P. 2005. Shades of Green: Measuring the value of urban forests in the housing market. Journal of Forest
Economics, 11, 177-199.
MELICHAR, J. & KAPROVA, K. 2013. Revealing preferences of Prague's homebuyers toward greenery amenities: The empirical evidence of distance-size effect. Landscape and Urban Planning, 109, 56-66.
MILLS, D. E. 1981. Growth, Speculation and Sprawl in a Monocentric City. Journal of Urban
Economics, 10, 201-226.
MILLS, E. S. & HAMILTON, B. 1994. Urban Economics, Harper-Collins.
NETUSIL, N. R. 2013. Urban environmental amenities and property values: Does ownership matter?
Land Use Policy, 31, 371-377.
O'SULLIVAN, A. 2000. Urban Economics, New York, USA.
PANDIT, R., POLYAKOV, M., TAPSUWAN, S. & MORAN, T. 2013. The effect of street trees on property value in Perth, Western Australia. Landscape and Urban Planning, 110, 134-142.
PANDURO, T. E. & VEIE, K. L. 2013. Classification and valuation of urban green spaces-A hedonic house price valuation. Landscape and Urban Planning, 120, 119-128.
PARKER, D. C., MANSON, S. M., JANSSEN, M. A., HOFFMANN, M. J. & DEADMAN, P. 2003. Multi-agent systems for the simulation of land-use and land-cover change: A review. Annals of the
Association of American Geographers, 93, 314-337.
PARKER, D. C. & MERETSKY, V. 2004. Measuring pattern outcomes in an agent-based model of edge-effect externalities using spatial metrics. Agriculture Ecosystems & Environment, 101, 233-250.
ROEBELING, P. C., FLETCHER, C. S., HILBERT, D. W. & UDO, J. 2007a. Sustainable management of urbanizing landscapes in coastal Queensland: project progress report 2005/2006. Report to
ROEBELING, P. C., FLETCHER, C. S., HILBERT, D. W. & UDO, J. 2007b. Welfare gains from urbanizing landscapes in Great Barrier Reef catchments? A spatial environmental-economic modelling approach. Sustainable Development and Planning III, Vols 1 and 2, 102, 737-749.
ROEBELING, P. C., TEOTÓNIO, C. & ALVES, H. 2012. Inventory of needs and approach for development and piloting Decision Support Tool. Aqua-Add Technical Report nº1.
ROEBELING, P. C., TEOTÓNIO, C., ALVES, H. & SARAIVA, M. 2014. Sustainable Urbanizing Landscape Development (SULD) decision support tool: report on frontrunner Aqua Cases. Aqua-Add
project, Aqua-Add Technical Report Aveiro, Portugal: Centre for Environmental and Marine
Studies (CESAM), Department of Environment and Planning (DAO), University of Aveiro (UA). SALAZAR, S. D. & MENENDEZ, L. G. 2007. Estimating the non-market benefits of an urban park: Does
proximity matter? Land Use Policy, 24, 296-305.
SAPHORES, J. D. & LI, W. 2012. Estimating the value of urban green areas: A hedonic pricing analysis of the single family housing market in Los Angeles, CA. Landscape and Urban Planning, 104, 373-387.
SIRMANS, G., MACPHERSON, D. & ZIETZ, E. 2005. The Composition of Hedonic Pricing Models.
Journal of Real Estate Literature, 13, 3-43.
SYPHARD, A. D., CLARKE, K. C. & FRANKLIN, J. 2005. Using cellular automaton model to forecast the effect of urban growth on habitat pattern in southern California. Ecological Complexity, 2, 185-203.
TEEB 2011. TEEB Manual for Cities: Ecosystem Services in Urban Management. www.teebweb.org.
TYRVAINEN, L. & MIETTINEN, A. 2000. Property prices and urban forest amenities. Journal of
Environmental Economics and Management, 39, 205-223.
WALTERT, F. & SCHLAPFER, F. 2010. Landscape amenities and local development A review of migration, regional economic and hedonic pricing studies. Ecological Economics, 70, 141-152. WANG, F. 2012. A Cellular Automata Model to Simulate Land-use Changes at Fine Spatial Resolution.
PhD, University of Calgary.
WARD, D. P., MURRAY, A. T. & PHINN, S. R. 2003. Integrating spatial optimization and cellular automata for evaluating urban change. Annals of Regional Science, 37, 131-148.
WHITE, R. & ENGELEN, G. 2000. High-resolution integrated modelling of the spatial dynamics of urban and regional systems. Computers, Environment and Urban Systems, 24, 383-400. WU, J. J. 2003. Amenities, sprawl, and the economic landscape [Online].
WU, J. J. 2006. Environmental amenities, urban sprawl, and community characteristics. Journal of
Environmental Economics and Management, 52, 527-547.
WU, J. J. & IRWIN, E. 2003. Human-Nature Interactions and the Spatial Pattern of Land Use. AERE
Workshop “Spatial Theory, Modeling, and Econometrics in Environmental and Resource Economics”. Madison, Wisconsin.
WU, J. J. & PLANTINGA, A. J. 2003. The influence of public open space on urban spatial structure.
Journal of Environmental Economics and Management, 46, 288-309.
ZHANG, B. A., XIE, G. D., ZHANG, C. Q. & ZHANG, J. 2012. The economic benefits of rainwater-runoff reduction by urban green spaces: A case study in Beijing, China. Journal of Environmental