Internatio:wi j ournal of Computer and Electrical Engineering
A Multi-Agent System for Outliers Accommodation in
Wireless Sensor Networks
Paulo Gill. 3*, Amancio Santosz, Lufs Palma3, Alberto Cardosol
1 CISUC-Informatics Engineering Department, University of Coimbra, 3030-290, Coimbra, Portugal. 2 Polytechnic Institute of Coimbra, ISEC, DEIS, 3030-199, Coimbra, Portugal.
3 UNINOVA-CTS, Department of Electrical Engineering, Faculty of Science and Technology, New University of Lisbon, 2829-516, Caparica, Portugal.
*
Corresponding author. Email: [email protected]Manuscript submitted July 11, 2014; accepted November 5, 2014. doi: 10.7763/ijcee.2014.v6.864
Abstract: In monitoring applications the accuracy of data is paramount. When considering wireless sensor networks the quality of readings taken from the environment may be hampered by outliers in raw data collected from transmitters attached to nodes' analogue-to-digital converter ports. To improve the data quality sent to the base-station, a real-time data analysis should be implemented at nodes' level, while taking into account their computing power and storage limitations. This paper deals with the problem of outliers detection and accommodation in raw data. The proposed approach relies on univariate statistics within an hierarchical multi-agent framework. Results from experiments on a real monitoring scenario, at a major oil refinery plant, show the relevance of the proposed approach.
Key words: Oil refinery plant, real-time monitoring, wireless sensor networks, outliers detection and accommodation, multi-agent systems.
1. Introduction
Wireless Sensor Networks (WSNs) consist of small, low-cost sensor nodes spatially distributed over a given environment, where readings are taken from. Each node includes a miniature electronic device with wireless communication interface, programmable micro-controller, power source, and possibly multi-type sensors or analogue-to-digital converters (ADCs). The small dimension of these devices, absence of wired connections and external power supply, easy of deployment, flexible installation and fully mobile operation, make them ideal for a myriad of applications, namely in process industry.
Sensor nodes can be grouped in single-hop or multi-hop networks with a varying number of self-organized devices, which can be used, for instance, to detect and classify events [1], or gather data from the environment. However, harsh environmental conditions, along with constraints on resources, in particular limited processing, small data storage, narrow bandwidth and autonomy may lead to artefacts in the raw data [2], commonly referred to as outliers. Generically, they can be defined as readings that considerably deviate from the normal pattern of sensed data [3].
inlernatiorwl journal of Computer and Elecl:ricai' EniJineerhi[J
collected data. The above conjectures make clear the need for mechanisms to allow detecting and accommodating of outliers that could effectively be deployed on each sensor node. Such an endeavor, which constitutes one of the contributions of this work, can conceptually be accomplished by incorporating into the code, running at each node, cooperative autonomous threads, under the form of mobile agents. These agents can further be functionally aggregated into a multi-agent framework, where information can be exchanged among agents.
In order to cope with computational constraints, the proposed approach relies on univariate statistics, within the Shewhart control chart framework. Its implementation on sensor nodes uses a hierarchical multi-agent system, together with an oversampling technique within each sampling interval. To deal with transient time-series the oversampled data-series is assumed to be linearly time-dependent, being the underlying parameters computed by a linear regression technique. The incorporation of an oversampling mechanism within the pro-posed framework enables the Shewhart control chart based approach to behave statistically more consistent.
The performance of the proposed architecture towards outliers accommodation in WSNs environments, was evaluated on a real oil refinery monitoring process, where a number of experiments have been conducted.
2. Multi-Agents Systems
2.1. Agents and Multi-Agents
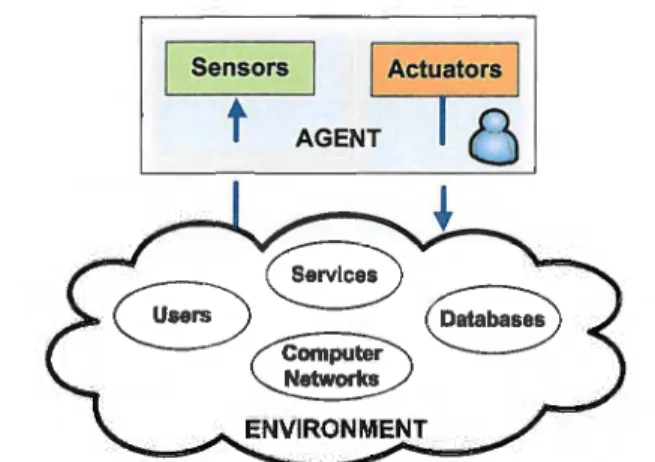
An intelligent agent, or agent for short, can be defined as a computing entity embedded in a given environment, comprising a certain degree of autonomy and possessing the ability to perceive the world in which it is immersed. Further, it possesses the ability to interact with other agents, while presenting idiosyncratic pro-activity features, in the sense that can assume initiatives in a way to persistently fulfil its own goals [S]. Therefore, an agent is supposed to act or react spontaneously; executing pre-emptive and independent actions, according to predefined goals [6]. Fig. 1 illustrates the use of an intelligent agent in the context of distributed control systems.
Sensors Actuators
Fig. 1. Agent model and information environment.
Although in some particular cases agents can act on their own, it is more common to find clusters of agents, in different functions, carrying out a number of tasks. In this sense, a multi-agent system (MAS) can holistically be regarded as a collection of heterogeneous multi-tasking intelligent agents organised in a particular topology, with co-operation and interaction capabilities.
International journal of Computer and Electrical Engineering
networks (WSANs), in which several agents that are responsible for monitoring and control are locally coordinated by a master-agent. The master-agent's main purpose is to carry out extensive management tasks related to lower-level agents, as well as monitoring the communication status between local nodes and the WSAN's sink. Agents belonging to the lowest layer are used to interface directly, and in a distributed way, with sensor readings. They analyse queries, pre-process collected data from the environment, and extract useful information from these readings, as instructed by the upper-level agent, based on a centralised goal-driven conditioning strategy.
2.2. Multi-Agent Architecture for WSNs
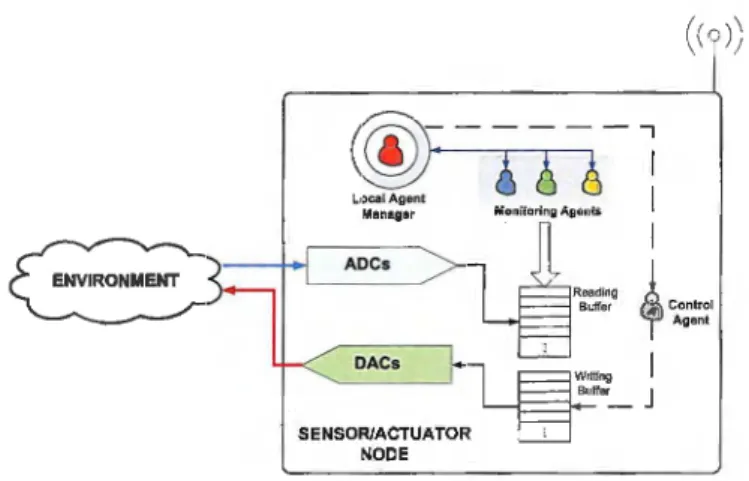
The HMAS architecture is composed of two layers, namely a higher-level layer with coordination functionalities and a bottom layer comprising subordinate agents that are committed to specific tasks, such as monitoring ADCs readings, detection of outliers and their subsequent accommodation. Each lower-level agent available at the local repository can be independently launched, paused, resumed and stopped at run-time. Additionally, the agents' configuration can be remotely modified by means of appropriate command messages.
Table 1. Messa e Pa load
Message Node Control
Type ID ID
Data
ID
Agent Agent
ID MSG
Each message comprises a header and a payload. The header includes the sender and destination addresses within the WSN, message sequence number, hops, along with a control identifier. Regarding the message payload (see Table 1) it consists of Message Type: the message can be originated from the system's application or from a local agent; Node JD: denoting the node address; Control ID: the command flag for local agents; Data ID: data collected in the node ID; Agent ID: agent's identifier that will be launched, stopped or resumed; Agent MSG: data provided by an agent. With respect to mobile agents' commands, the platform is provided with: i) Start Agent: starts a monitoring agent at the sensor node by sending the command flag, the agent's ID and the node's destination address; ii) Stop Agent: stops a particular monitoring agent; iii) Start All Agents: starts all monitoring agents stacked at the sensor node memory; iv) Stop All Agents: stops all monitoring agents that are running at the sensor node.
• Master-Agent:
ADCs
DA Cs
SENSOR/ACTUATOR NODE
Writing L...ji:=::j.-Bufler_ J
Fig. 2. Illustration of a multi-agent system. (1 )\ \ \ J
International journal of Computer and Electrical Bn,qi11eering
with lower-level agents, such as launching, stopping and resuming agents, and their configuration; monitoring the communication channel between the sensor node and the sink, using a two-way beaconing system; sending alarms to the base- station. By default, this agent is always launched whenever the sensor node is switched on or rebooted. When started, it executes several diagnostic routines, and launches predefined subordinate agents, aiming at real-time monitoring of raw data, outliers detection and accommodation. In addition, the master- agent is also engaged in monitoring the "health" of lower-level agents. If of one of these agents crashes the master-agent will kill the corresponding thread, reloads the agent's "clone" from the local repository, and eventually starts it. Moreover, if a given monitoring agent is no longer necessary, the master- agent removes it from the device memory, by killing the corresponding thread.
• Monitoring Agents:
Subordinate agents are launched by the master-agent. They have to be started with a number of parameters as argument, in order to detect and accommodate possible outliers in the readings by using the univariate statistical approach presented in Section 3.3. These parameters are described in Algorithm 1, and include the sampling and oversampling frequencies, along with the standard normal deviate. If the sample taken at a given sampling time (k
+
1)T5 is tagged as an outlier the corresponding value is replaced by theprediction of the oversampled data linear approximation, computed at t = (k
+
1)T5 , and an alarm is triggered and sent to the master-agent.3. Outliers Detection and Accommodation
Outliers detection methodologies can be categorized into statistical-based, nearest neighbour-based, clustering-based, classification-based and spectral decomposition-based approaches (see e.g. [7]). The first category can be further split into parametric [8] and non-parametric [9] methods according to how the statistical model is built. Both approaches rely on an estimate for the underlying probability distribution characterizing the time-series, while evaluating raw samples in terms of the available statistical model. Regarding nearest neighbour methods, they rely on particular metrics to compute distances among objects or samples with clear geometric interpretation, according to which a so-called outlier factor is calculated [10]. In clustering-based techniques [11] data sets are grouped into clusters consisting of similar attributes, being an object classified as an outlier when lying outside identified clusters. This kind of techniques is appealing in the sense that they do not require a priori knowledge of the data statistics, and can be used in an incremental model [4]. Classification-based methods, on the other hand, are based on machine learning techniques to come up with a classification model, which is apprehended or learnt from the available data set. A drawback of these techniques is that they are computationally intensive to be implementable in real-time on sensor nodes. At last, spectral decomposition based approaches [12] use principal component analysis (PCA) based techniques to identify normal modes of behaviour in data sets, at the expense of a high computational complexity.
3.1. Preliminaries
Consider the single-input single-output (SISO) nonlinear dynamic discrete-time system described by,
x(k+l)
=
f(x(k),u(k),µ(k))y(x) = h(x(k),u(k),v(k)) (1)
where x E JR{n denotes the state vector, u E JR{m the input vector, y E JR{P the output vector, and µ E
JR{nand v E JR{n random variables. The mappings
f:
JR{n X JR{m x IR{n ~ IR{n and h: IR{n x JR{m x JR{P ~ JR{P arei ntemational jaunwl vf Computer and EJearica! E'11gineering
By considering that the source of uncertainty in readings is due to environmental conditions or sampling anomalies, which imply in both cases an additive noise disturbance, (1) can be rewritten as follows:
x(k + 1)
=
f(x(k),u(k)) y(k) = h(x(k),u(k)) + m(k)(2)
with w E JRl.P a stochastic variable.
If w is Gaussian in continuous-time, its probability distribution can be described by,
(3)
with
w
the distribution's mean and rr2 its variance.Taking into account the central limit theorem, given certain conditions, the mean of a sufficiently large number (N-too) of independent random variables, each with finite mean and variance, will be
approximately Gaussian distributed. As a corollary of the central limit theorem, it is plausible to expect that, for a stationary deterministic-stochastic system, the readings taken from sensor nodes should follow approximately a Gaussian distribution.
3.2.
Outliers Identification Approach
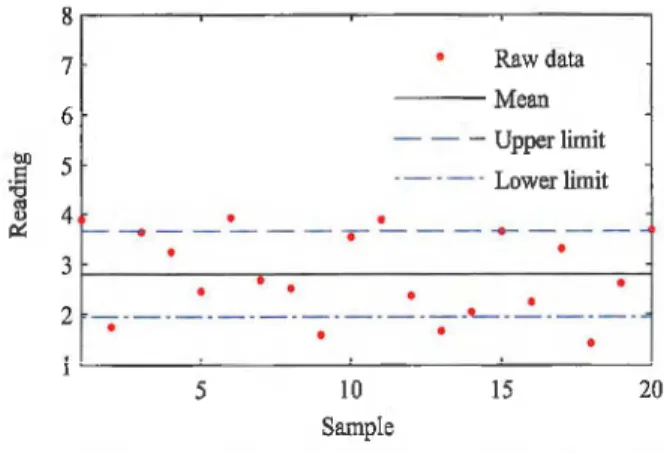
The univariate statistical-based approach to limit sensing assumes that a single physical variable is observed through a sensor reading, which is used to determine boundary thresholds for in-control operation [13]. The violation of these computed limits by sampled data will indicate a possible outlier. It
should be mentioned that the upper (Liu) and lower (Lil) limits on the Shewhart chart are particularly critical to the performance of the method, in terms of sensitivity and specificity (see Fig. 3). More specifically, tight threshold limits result in a high rate of false outliers, while loose thresholds increase the missed detection rate
8..----...--~---.---.---,
7
6
Raw data
- - - Mean
- - - Upper limit
-- -- - Lower limit
4 • •
f-- - . - - - ...-- - - - ...- - -
-• •
3f---~~-
•
• - --- ----,.---I• •
2 . L
-5 10 15 20
Sample
Fig. 3. Illustration of a Shewhart chart.
Statistical hypothesis theory can be used to predict false outlier and missed detection rates on a given ensemble. Let z be a monitoring variable, for which any deviation from its mean
z,
results from additive errors, and assume that its variability follows a Gaussian distribution N(z, rr2) with standard deviation rr.Then, the probability P of z lying within a given interval is described by:
Internatio nal }ournai of
(5)
where ca;2 is the standard normal deviate corresponding to the (1 - a/2) percentile and athe level of significance, which specifies the degree of trade-off between false outliers and missed detection rates. Some
typical values for the standard normal deviate include Ca;2
=
{1.0,1.5,3.0}. In the case of a standard normaldeviate Ca;2 = 1.5, the probability
P{z
-
ca;2a}::;
z::;P{z
+
ca;2a}
= 86.64%.In order to improve the consistency of the univariate statistical approach, the present work resorts to an oversampling mechanism within each sampling interval, namely fort E [kTs, (k
+
l)Ts], with Ts the sampling period, t the continuous time, and k the discrete-time. This enables collecting a statisticallyrepresentative time-series, which is subsequently used within the underlying Shewhart control chart. If the sample taken at time(k
+
l)Ts lies outside the threshold limits it is tagged as an outlier; and accordingly replaced by a plausible estimate.3.3.
Transient Time Series
In the case of non-stationary physical variables, the corresponding readings can be represented by the
concatenation of a non-stationary random process and a deterministic time trend. If the sampling period Ts
is adequately chosen, taking into account the bandwidth of the system, the deterministic-stochastic time-series for r E [kTs, (k
+
l)Ts) can be approx-imated by a linear regression, as in (6).z(r) = a+bxr (6)
The computation of those deterministic parameters in the equation (6) is carried out by minimising the
x
2 merit function given by,x2(a,b) =
i
z(r;)-a-b.r;i=l O';
(7)
with Ns the number of samples and ai the readings' standard deviate.
Since the uncertainty associated with each measurement included in the data set is not a priori known,
some considerations concerning the
x
2 fitting have to be taken, so as to derive a plausible value for ai. Ifone assumes that all the samples in the time-series have equal standard deviation (ai =a) and the model
fits well enough, then it is possible, without loss of generality, to assign an arbitrary value to the standard deviation a, in particular a = 1 for simplicity's sake. In this case, the
x
2 merit function can be rewritten asthe residual sum of squares shown in (8).
N,
X2(a,b)
=
z>(r;)-a-b.r;
S(t)
=
L/i
S(t2) =
L/f
i=IS(z)
=
Lizi
S(t·z) =
L/i
·ziThe computation of
e
= [a b]T can be carried out according to:(S(t
2
) -S(t))
() _ S(t) 1 ( S(t) )
- sct2)+s2(t) S(t · z)
(8)
(9)
Jntematiorwi journal of Com put.er and Eiectricni Engineering
If the sensor reading taken at time r
=
(k+
1)T8 is outside the threshold limits, then it is considered an outlier and consequently is replaced by the trend provided by the oversampling time-series, which is computed using (6). The underlying methodology is outlined in Algorithm 1.Algorithm 1: Outliers Accommodation in Transient Time-Series
Input: f s - Sampling Frequency f os - Oversampling Frequency
snd - Standard Normal Deviate Output: Sample/ Accommodated Sample
1 Ts ~ 1 / f s; / / sampling period
2 T os ~ 1 / f os; / / oversampling period
3 ti ~ GetTime; / / initial time
4 i ~ O; //initial iteration
5 repeat / / oversampling until next sample time
6 i ~ i + 1; / / iteration
7 z[1] ~ GetSample; //oversample
8 Sleep(T os); //node sleep for Tos seconds until GetTime ;;?: ti + Ts;
9 y ~ GetSample; / / sample
10 (a, b) ~ DataFitting(z); //a and b from Eq. (10) 11 z[i + 1] ~a+ b x (i + 1 ); //next value from linear model
12 l:m ~ z[i + 1] + snd x STD(z); //upper threshold 13 /::,,/ ~ z[i + 1] - snd x STD(z); //lower threshold 14 ify E/ [Ll/, Llu] then returny;// the sample is not an outlier 15 else return z[i + 1]; /( is an outlier: accommodated
4. Refinery Case-Study
The proposed approach to deal with outliers in WSNs was implemented in an oil refinery, namely at the Petrogal oil refinery, located at Sines, Portugal. The refinery environment is highly challenging in terms of wireless communications, as huge thick metal structures and non-stop operating machines contribute to a high noise level, which may seriously hamper the WSN performance and the quality of raw data.
4.1. Scenario Description
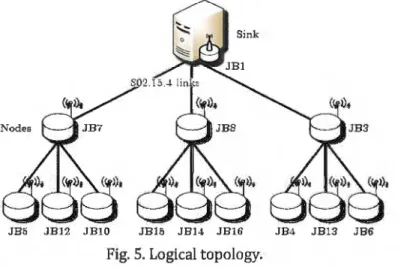
The test-bed included a WSN consisting of 12 sensor nodes, deployed at the water treatment area (Line 4) and a sink located at the portable office, which is connected to a Linux OS server computer. In this machine Dispatcher software pre-processes packets stemming from the WSN and forwards those via a TCP /IP connection to the GINSENG middleware running on a different PC located in the Refinery control room. Additionally, the Dispatcher relays system's configuration commands, originated at the middleware, to individual sensor nodes, being the middleware responsible for the configuration of the whole network and the local multi-agent architecture (Section 2.2).
The WSN was consisted of 12 Crossbow's TelosB (TPR2400) nodes, plus one sink These devices are IEEE 802.15.4 compliant, and incorporate eight 12-bit ADC ports and another two 12-bit ADC ports for the internal thermistor and battery voltage monitoring. Also, they include two light transducers and one humidity/temperature transducer on-board connected to 14-bit ADC ports. The nodes were enclosed in ATmosphere EXplosive (ATEX) junction boxes attached to external 9 dB antennas, in order to cope with the wireless signal attenuation using the on-board (internal) TelosB nodes' antenna. Fig. 4 shows one of the deployed nodes at the water treatment area within an ATEX junction box. The junction boxes are listed in Table 2, along with the corresponding attached transmitters and nodes' ID.
International journal of Computer and Electrical Engineering
Table 2. Junction Boxes DeElol;'.ed in Line 4
!unction Box 1'.YEe Transmitter Nodeld Tree Position
JBl (sink) 101 N-0-0
JB7 Flow FT-5147 107 N-1-0
JBS Flow FT-5141 102 N-1-1
JB12 Pressure PT-5170 108 N-1-2
JBlO Flow FT-5147 110 N-1-3
JBS Pressure PT-5170 109 N-2-0
JBlS Pressure PT-5100 112 N-2-1
JB14 Pressure PT-5100 105 N-2-2
JB16 Flow FT-5100 113 N-2-3
JB3 Flow FT-5130 111 N-3-0
JB4 Flow FT-5141 106 N-3-1
JB13 Flow FT-5130 103 N-3-2
JB6 Flaw FT-500 104 N-3-3
Fig. 4. Sensor node in an ATEX junction box.
JB5 JB12 JBlO J B 15 JB14 JB16 JB4 JB13 JB6 Fig. 5. Logical topology.
lnternaliona.l jou n iai of Computer and EiectricuJ Engineering
satisfying a 3-3 network envelope, where the sink has 3 children nodes, with each of these nodes also having 3 children nodes. As such, the nodes N-1-0, N-2-0 and N-3-0 of the first level are responsible for forwarding messages originated at the associated set of 3 children nodes, of the second level, to the sink, and configuration message semanated by the middleware through the sink to lower level nodes.
4.2.
Experiments
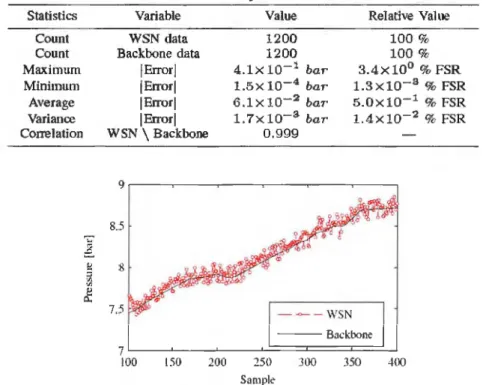
The first experiment aim at comparing the reliability consistency between readings associated with sensor nodes ADC against those provided by the existing wired solution. It was performed using the signal from the transmitter PT-5170, which is attached to the ADCO of the sensor node N-1-2 (ID#109). As can be observed in Fig. 6, there is a noticeable mismatch between the wired delivered PT-5170 signal and the node ID#109 readings that were sent to the sink. The signal degradation can partly be attributed to artefacts in the readings provided by the node N-1-2. Such an observation is corroborated by the metrics presented in Table 3, where the error is computed as the difference between both time synchronised signals.
Statistics
Count Count Maximum Minimum Average Variance Correlation
~
~
~
V'i
µ
c:
Table 3. Accuracy Test Statistics
Variable
WSN data Backbone data
!Error! !Error! !Error! !Error! WSN \Backbone
8.5
8
7.5
7
IOO 150 200
Value Relative Value
1200 100 %
1200 100 %
4.lx 10-1 bar 3.4x l0° % FSR l.5x io-4 bar
l.3x10-3 % FSR
6.lx 10-2 bar 5.0x10⁻¹ % FSR 1. 7x io-3 bar l.4x10-2 % FSR
0.999
- - 0 -- WSN
250
Sam pit"
- - -B ~ ckbo nc
300 350 400
Fig. 6. Comparison between the wired PT-5170 signal in JBOS and sensor node (ID#109).
The next experiment intends to assess the performance of the proposed approach to deal with artefacts on raw data. The experiment included readings taken from a flow rate transmitter and a static pressure transmitter, which were previously attached to ADC ports of sensor nodes. Flow rate samples were collected in seven different locations, while static pressure readings were taken in five different points of the set-up. To allow the detection and accommodation of outliers the monitoring agents were launched by the underlying master-agent, at start-up. The readings were taken every 1 s (Ts= ls), while the oversampling frequency fos was chosen as 100 Hz and the standard normal deviate defined as 1:5.
The message payload associated with the sensor readings that is transmitted to the sink includes: the sample number (k), ); reading (yk); oversampling variance (a-2); upper threshold for the oversampling data
Internationai}oimw.! of Computer rm d Electrical Engineering
100
90
--:- 80
~ 70
...
~ 60~ c 50 LL: 40 .lO 0
.
200 400 600
Sample
Outlier - - - Upper ---- - Lower - - Sent out
800 1000 1200
Fig. 7. Detection and accommodation of outliers in the refinery flow transmitter FT-5130.
7..i
7 ··)
+ I
7 . 1
0 200 -WO 600
Sample
Outlier
- - - Upper - - -- - Lower
- - Sent ou t
+
.
+
800 1000 1200
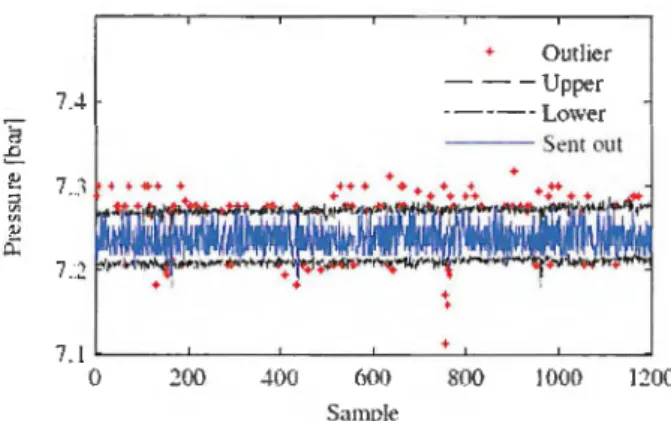
Fig. 8. Detection and accommodation of outliers in the refinery flow transmitter PT-5100.
Table 4. FT-5130 (JB13) Statistics
Statistics Variables Absolute Value Relative Value
Count samples 1200 100%
Count outliers 448 12.4%
Minimum accommodations -16.9 m3 /h -10.5% FSR Maximum accommodations 20.9 m3 /h 13.1% FSR
Mean accommodations -0.7m3 /h -0.5% FSR Std. Deviation accommodations 9.6 m3 /h 6.0 % FSR
Table 5. PT-5100 (IB15) Statistics
Statistics Variables Absolute Value Relative Value
Count samples 1200 100%
Count outliers 456 12.7%
Minimum accommodations -0.13bar -1.1 % FSR Maximum accommodations 0.08 bar 0.6 % FSR
Mean accommodations O.Olbar 0.1 % FSR Std. Deviation accommodations 0.04 bar 0.3 % FSR
Experimental results taken from flow rate transmitter FT-5130, located at JB13 and the pressure transmitter PT-5100 at JB15 are shown, respectively, in Fig. 7 and Fig. 8, where detected outliers are represented by a red asterisk. After being identified, outliers are replaced by a first order prediction based on the linear regression obtained with oversampled time-series. The green line represents the data time-series sent to sink. As can be observed, in both cases the implementation of the online solution proves to be invaluable in improving the quality of the data, which is corroborated by the statistical metrics presented in Table 4 and Table 5. More specifically, in the case of flow transmitter FT-5130, on 20 min of running time, represented by 1200 samples, the algorithm detected 478 outliers, which accounts fo r approximately 12.4 % ofall the readings. With respect to the transmitter PT-5100, it was found 403 outliers in 1200 samples, which represents roughly 12.7 % of the time-series length.
5. Conclusion
This paper focused on the problem of real-time outliers detection and accommodation in data collected with wireless sensor networks. The development of feasible methodologies, from the practicality point of view, to deal with these kinds of artefacts in readings is crucial to improve the quality of data sent out through wireless sensor networks.
ln terrwtfonaI journa l of Computer and Electric::if Engineering
time-series, the approach assumes the system's time response approximated by a linear regressive model within each sampling interval. The time-series used in the linear regression is obtained by oversampling the
transmitters' signal provided to sensor nodes. Whenever a reading, taken at a given sampling time, is tagged as an outlier, it is replaced by the linear prediction at that discrete-time.
In order to assess the feasibility of the proposed methodology, real monitoring scenario tryouts were conducted at a major oil refinery, namely at the water treatment area. Results from these experiments prove the practicality and implement ability of the proposed approach and highlights the inherent benefits for
improving the quality of data collected with wireless sensor networks.
Acknowledgment
This work has been partially supported by the European Commission under the contract FP7-ICT-224282 (GINSENG) and Project CENTR0-07-ST24-FEDER-002003 (iCIS-Intelligent Computing in the Internet of
Services).
References
[1] Taylor, H.J., & Slipp, J. (2010). An integrated testbed for advanced wireless networked control systems technology. Proceedings of !ECON 36th Annual Conference on IEEE Industrial Electronics Society (pp. 2101-2106).
[2] Gungor, V. C., & Haneke, G. P. (2009). Industrial wireless sensor networks: Challenges, design principles, and technical approaches. IEEE Transactions on Industrial Electronics, 56(10), 4258-4265. [3] Chandola, V., Banerjee, A., & Kumar, V. (2007). Anomaly detection: A survey. University of Minnesota,
Tech. Rep.
[4] Zang, Y., Meratnia, N., & Havinga, P. (2010). Outlier detection techniques for wireless sensor networks: A survey. IEEE Communications Surveys & Tutorials, 12(2), 159-170.
[5] Paolucci, M., & Sacile, R. (2005). Agent-based manufacturing and control system: new agile manufacturing. CRC Press LLC.
[6] Oliveira, E., Fischer, K., & Stepankova, 0. (1999). Multi-agent systems: which research for which
applications. Robotics and Autonomous Systems, 27(1), 91-106.
[7] Gogoi, P., Bhattacharyya, D., Borah, B., & Kalita, J. K. (2011). A survey of outlier detection methods in network anomaly identification. The Computer journal, 54( 4), 570-588.
[8] Wu, W., Cheng, X., Ding, M., Xing, K., Liu, F., & Deng, P. (Aug. 2007). Localized outlying and boundary data detection in sensor networks. IEEE Transactions on Knowledge and Data Engineering, 19(8),
1145-1157.
[9] Sheng, B., Li, Q., Mao, W., & Jin, W. (2007). Outlier detection in sensor networks. Proceedings of the 8th ACM International Symposium on Mobile Ad Hoc Networking And Computing (pp. 219-228), New York, NY, USA.
[10] Branch, J., Szymanski, B., Giannella, C., Wolff, R., & Kargupta, H. (2006). Innetwork outlier detection in
wireless sensor networks. Proceedings of 26th IEEE International Conference on Distributed Computing
Systems (p. 51).
[11] Zhang, Y.-Y., Chao, H.-C., Chen, M., Shu, L., Park, C.-H., & Park, M.-S. (December 2010). Outlier detection
and countermeasure for hierarchical wireless sensor networks. Information Security, 4(4), 361-373.
[12] Chatzigiannakis, V., Papavassiliou, S., Grammatikou, M., & Maglaris, B. (June 2006). Hierarchical
anomaly detection in distributed large-scale sensor networks. Proceedings of 11th IEEE Symposium on
Computers and Communications (pp. 761-767).
International journal of Computer and Electrical Engineering
Springer, 2001.
[14] Pottner, W.-B., Wolf, L., Cecilio,
J.,
Furtado, P., Silva, R., Silva,J.,
Santos, A., Gil, P., Cardoso, A., Zinonos, Z., et al. (June 2011). Wsn evaluation in industrial environments first results and lessons learned. Proceedings of 2011 International Conference on Distributed Computing in Sensor Systems and Workshops (pp. 1-8).[15] Dunkels, A., Gr"onvall, B., & Voigt, T. (November 2004). Contiki-a lightweight and flexible operating system for tiny networked sensors. Proceedings of the First IEEE Workshop on Embedded Networked Sensors, Tampa, Florida, USA.
[16] Suriyachai, P., Brown,
J.,
& Roedig, U. (2010). Time-critical data delivery in wireless sensor networks. InR. Rajaraman, T. Moscibroda, A. Dunkels, & A. Scaglione, (Eds.), Lecture Notes in Computer Science: Vol. 6131. Distributed Computing in Sensor Systems (pp. 216-229). Heidelberg: Springer Berlin.
Paulo Gil was born in Lisbon, Portugal. He received the licentiate's degree in mechanical engineering and the M.Sc. degree in informatics engineering from the University of Coimbra, and the Ph.D. degree in electrical engineering, specialty of automatic control from the Universidade Nova de Lisboa. He is an assistant professor with the Departamento de Engenharia Electrot' ecnica, Faculdade de crencias e Tecnologia of Universidade Nova de Lisboa, Lisbon, Portugal, since 2004, and a member of IEEE Control Systems Society. His current research interests include, distributed control systems, networked control systems, wireless sensor and actuator networks, intelligent systems and multi-agent systems.
Am"ancio Santos was born in Marinha Grande, Portugal. He received the licentiate's degree in informatics engineering and the M.Sc. degree in systems and automation from the University of Coimbra. He is an adjoint professor with the Instituto Polit' ecnico de Coimbra. His current research interests include, distributed systems, wireless sensor and actuator networks and multi-agent systems.
Luis Palma was born in Almada, Portugal. He received the licentiate's degree in physics engineering, and the Ph.D. degree in electrical engineering from the Universidade Nova de Lisboa. He is an assistant professor with the Department of Electrical Engineering of Faculdade de crencias e Tecnologia of Universidade Nova de Lisboa, Lisbon, Portugal, since 2007. His current research interests include fault detection and diagnosis, fault tolerant control systems, intelligent control systems, distributed control systems and automation and remote systems.