1 Bacterial community variations in an alfalfa-rice rotation system revealed by 16S rRNA 1
gene 454-pyrosequencing 2
3
Lopes ARa,b, Manaia CMb and Nunes OCa 4
5
aLEPAE, Dpto Engenharia Química, Faculdade de Engenharia, Universidade do Porto, 6
Rua Dr. Roberto Frias, 4200-465 Porto, Portugal 7
bCBQF - Centro de Biotecnologia e Química Fina - Laboratório Associado, Escola 8
Superior de Biotecnologia, Universidade Católica Portuguesa/Porto, Rua Dr. António 9
Bernardino Almeida, 4200-072 Porto, Portugal 10 11 Corresponding author: 12 Olga C. Nunes 13 e-mail: [email protected] 14
LEPAE – Departamento de Engenharia Química, 15
Faculdade de Engenharia - Universidade do Porto 16 4200-465 Porto, Portugal 17 Telephone: +351 225081917 18 Fax: +351 225081449 19 20
Running title: Bacterial diversity in alfalfa-rice crop rotation 21
22 23 24 25
This article was published in FEMS Microbiol. Ecology, 87, 650-663, 2014 http://dx.doi.org/10.1111/1574-6941.12253
2
Abstract
26 27
Crop rotation is a practice harmonized with the sustainable rice production. 28
Nevertheless, the implications of this empirical practice are not well characterized, 29
mainly in relation to the bacterial community composition and structure. In this study, 30
the bacterial communities of two adjacent paddy fields in the 3rd and 4th year of the crop 31
rotation cycle and of a non-seeded sub-plot were characterized before rice seeding and 32
after harvesting, using 454-pyrosequencing of the 16S rRNA gene. Although the phyla 33
Acidobacteria, Proteobacteria, Chloroflexi, Actinobacteria and Bacteroidetes
34
predominated in all the samples, there were variations in relative abundance of these 35
groups. Samples from the 3rd and 4th years of the crop rotation differed on the higher 36
abundance of groups of presumable aerobic bacteria and of presumable anaerobic and 37
acidobacterial groups, respectively. Members of the phylum Nitrospira were more 38
abundant after rice harvest than in the previously sampled period. Rice cropping was 39
positively correlated with the abundance of members of the orders Acidobacteriales and 40
"Solibacterales" and negatively with lineages such as Chloroflexi "Ellin6529". Studies 41
like this contribute to understand variations occurring in the microbial communities in 42
soils under sustainable rice production, based on real-world data. 43
44
Keywords: 454-pyrosequencing; bacterial community; crop rotation; diversity; PCoA;
45
rice paddy soil 46
47 48 49 50
3
Introduction
51 52
Soil is a privileged habitat for microorganisms and is amongst the most biodiverse 53
environments on Earth (Tamames et al., 2010). It is estimated that 1 gram of soil 54
contains about 1 billion of prokaryotic cells (Roesch et al., 2007). Although the vast 55
majority of microbial soil species are so far uncultivable, in the last decades, the 56
development and improvement of culture-independent methods (e.g., fluorescent in situ 57
hybridization-FISH, phyloarrays, fingerprinting techniques and sequencing of small-58
insert libraries of environmental DNA) (Newby et al., 2009), allowed to get important 59
insights into the phylogenetic diversity of soil microbiomes. Among them, high 60
throughput sequencing technologies gave a new impetus to microbial ecology studies 61
(Mardis, 2008; Mardis, 2011; Suenaga, 2012). In spite of the biases inherent to these 62
technologies (Suenaga, 2012; Zinger et al., 2012), the pyrosequencing of phylogenetic 63
marker genes, such as the 16S rRNA gene offers new insights into the composition and 64
structure of environmental microbial communities, allowing inferences about 65
biogeographical or ecological patterns in different habitats (e.g., soil, rhizosphere, 66
sediments) (Gomes et al., 2010; Baldrian et al., 2012; Zhang et al., 2012) or 67
environmental gradients (e.g., depth, pH, N amendments) (Lauber et al., 2009; Eilers et 68
al., 2012; Ramirez et al., 2012).
69
Due to the increasing demand for productivity, in the beginning of the past century 70
ancient agriculture practices gave way to conventional farming (Matson et al., 1997; 71
Ladha & Reddy, 2003). Despite the benefits on productivity, the use of synthetic 72
chemical compounds strongly alters soil microbial communities composition and 73
biogeochemical cycles (Hussain et al., 2009; Ramirez et al., 2012) and triggers strong 74
negative impacts on sustainable soil fertility and on environmental quality (Matson et 75
4
al., 1997; Quayle et al., 2006; Galloway et al., 2008). The expansion of sustainable
76
agriculture practices, which avoid or strongly reduce the use of pesticides and synthetic 77
fertilizers is a priority. Often relying on empirical practices, sustainable agriculture 78
production would benefit from science-based evidences, demonstrating the implications 79
of such management practices. 80
Crop rotation is an important alternative to conventional farming, because it offers high 81
productivity (Xuan et al., 2012) while contributes to environmental health (Rui & 82
Zhang, 2010). The cereal-legume rotation is a worldwide extended crop management, 83
which improves the yield and quality of cereal crops by reducing diseases and weeds 84
(Liebman & Davis, 2000; Fenández-Aparicio et al., 2007), fixing atmospheric N2 85
(Kelner et al., 1997), and contributing to increase the soil organic matter content (Rosen 86
& Allan, 2007). The legumes used in these rotation systems depend on the world region, 87
the water regime and the season where forage is being cropped (Ladha & Reddy, 2003). 88
Alfalfa (Medicago sativa L.) is a legume used in different world regions and with 89
different crops, which contributes to maintain soil organic carbon (SOC) and to the 90
accumulation of N in soil (Kelner et al., 1997; Pietsch et al., 2007). Nevertheless, 91
information about the effect of alfalfa-rice rotation system on the bulk soil bacterial 92
community is scarce. This study was based on the hypothesis that variations on the 93
bacterial community composition and structure (i.e. the groups present and the 94
abundance of each group, respectively) may coincide with i) the presence of rice crop; 95
ii) alterations in the climate conditions and agriculture management (e.g., flooding, rice 96
growth), occurring over the annual rice cycle; iii) alterations in the type of plant litter 97
and nutrients in soil, which are supposed to differ in distinct stages of the crop rotation. 98
To assess such variations, an exploratory comparative study based on the analysis of the 99
454-pyrosequencing 16S rRNA metagenome of rice paddies, was conducted. Bulk soil 100
5 samples of uncropped and cropped rice paddies at different stages of the alfalfa-rice 101
rotation system were collected before rice seeding and after rice harvesting. 102
103
Materials and Methods
104 105
Site description and soil sampling 106
107
The soil samples were collected in an experimental farm of the Portuguese Agriculture 108
Ministry (“Bico da Barca”, 40 º 11’ N; 08 º 41’ W), in the valley of river Mondego, 109
Montemor-o-Velho, Central Portugal. This farm is managed by the technical staff and 110
no special conditions were imposed or controlled for the present study in order to get a 111
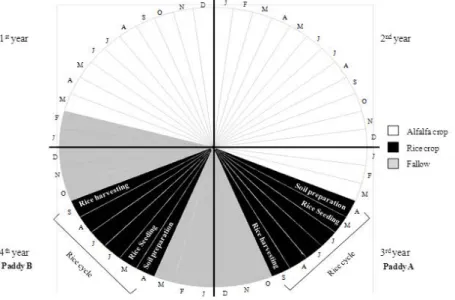
perspective of real-world data. Samples were collected in 2010 from two adjacent 112
organically farmed paddy fields, both under a four-year crop rotation system, in which 113
alfalfa (forage crop) rotates with rice (cereal crop). Briefly, alfalfa is continuously 114
cropped for two consecutive years (designated 1st and 2nd year) followed by two 115
consecutive years of rice cropping (designated 3rd and 4th year). In the years of rice 116
cropping, land is under fallow in autumn and winter to avoid the spreading of plant 117
diseases and weeds (Fig. 1). At the beginning of the study, paddies A (total area=3070 118
m2) and B (total area=1715 m2) were in the 3rd and 4th year of the crop rotation cycle, 119
respectively. The field management of both paddies was as follows: field preparation in 120
early April, flooding on 7 April; drainage and mechanical removal of weeds on 19 May; 121
flooding on 20 May; rice seeding on 21 May. A sub-plot (1 m2 with a periphery margin 122
of about 30 cm) of paddy A was left uncropped and is herein designated as ANS (non-123
seeded). During rice cropping paddies were drained for a few days and re-flooded at the 124
early stage of rice growth (drainage on the 1st and flooding on the 3rd June) and at active 125
6 tillering (drainage on the 17th and flooding on the 20th July) to promote the good 126
development of rice plants. Finally, both paddies were drained on the 15th September, 127
and rice was harvested between 15th and 24th September. Since the main objective of the 128
field studies in this experimental farm is the optimization of organic practices, i.e., high 129
productivity without utilization of synthetic fertilizers and pesticides, the regular 130
practice implemented several years ago includes the amendment with a plant residue 131
commercial compost (Fertiormont, 2 t ha-1) and with mineral gafsa (Fertigafsa, 300 kg P 132
ha-1). Therefore, in this study paddy B (4th year) but not paddy A (3rd year), was 133
amended during field preparation in early April before flooding. This was a corrective 134
measure used by the farmers because in previous years rice yields decreased from the 135
3rd to the 4th year of the crop rotation. 136
Soils were sampled on the 6th April 2010 before flooding (samples labelled AApr I, II, III 137
and BApr I, II, III,respectively) and after harvesting, on the 29th September (ASep I, II, III, 138
ANSSep I, II, III and BSep I, II, III, respectively) using a soil corer device (2.5-cm 139
diameter by 25-cm depth). In September, samples of paddies A and B were collected 140
between stubble rows. Three different composite samples per plot were obtained at each 141
sampling date. Each composite sample was composed of 20 (5 for ANS) individual soil 142
cores randomly collected over the total area of each plot (paddies A, B and subplot 143
ANS) from the upper 0-25 cm of the soil. To prepare each composite sample, 20 (or 5 144
for ANS) individual soil cores were pooled, homogenized and visible root debris was 145
removed. Each composite sample corresponded to one of the three replicas, named I, II, 146
III, for each plot and sampling date (AApr I, II, III; Asep I, II, III; ANSsep I, II, III; BApr I, 147
II, III; BSep I, II, III). Soil aliquots of each replica were immediately stored at 4 ºC for 148
soil physicochemical characterization and at -20 ºC for molecular characterization. 149
7
Soil characteristics
151 152
The total C and N contents, pH in water and water content of soil were determined 153
following the methods described by Guitián and Carballas (1976). Briefly, total organic 154
C was determined by wet oxidation with potassium dichromate, after treatment with 155
H2SO4 to facilitate digestion of the organic matter and to ensure the removal of any 156
inorganic C present. Total N was measured by the Kjeldahl digestion method and the 157
pH in water was determined in a soil:solution mixture (1:2.5 w:v), with a glass 158
electrode. The total available-P was determined after extraction with 0.5 M sodium 159
bicarbonate following the methods described in Trasar-Cepeda et al. (1990). 160
161
16S rRNA gene barcode 454-pyrosequencing
162 163
A barcode pyrosequencing approach was used for the characterization of soil bacterial 164
communities. Genomic DNA was extracted from 7 aliquots of each soil replica using 165
the Power SoilTM DNA Isolation Kit (MO BIO) as described before (Lopes et al., 2011), 166
collecting the seven extracts in a single tube. DNA was further purified (Bacteria 167
genomicPrep Mini Spin Kit, Amersham Biosciences, NJ, USA). The DNA 168
concentration in the final extracts (Qubit® Fluorometer (Invitrogen) with Quant-iTTM 169
dsDNA HS assay kit) was approximately 20 µg mL-1. DNA extracts were used as 170
template for the amplification by PCR of the hypervariable V3-V4 region of the 16S 171
rRNA gene. The PCR amplifications, performed in duplicate for each DNA extract, 172
were carried out using barcoded fusion primers containing the Roche-454 A and B 173
Titanium sequencing adapters, an eight-base barcode sequence in adaptor A, and 174
specific sequences for the ribosomal region (V3F 5’-ACTCCTACGGGAGGCAG-3’ 175
8 and V4R 5’-TACNVRRGTHTCTAATYC-3’) (Wang & Qian, 2009). PCR mixtures (25 176
μL) contained: 0.2 mM dNTPs (Bioron, Ludwigshafen am Rhein, Germany), 0.2 μM of 177
each primer, 5 % DMSO (Roche Diagnostics GmbH, Mannheim, Germany), 1x 178
Advantage 2 Polymerase Mix (Clontech, Mountain View, CA, USA), 1x Advantage 2 179
PCR Buffer, and 1-3 μL of target DNA (corresponding to 20 ng), and cycling conditions 180
consisted of a first denaturation step at 94 °C for 4 min, followed by 20 cycles at 94 °C 181
(30 s), 44 °C (45 s) and 68 °C (60 s), and a final 2 min extension at 68 °C. The 182
amplicons were quantified by fluorimetry with PicoGreen dsDNA quantitation kit 183
(Invitrogen, Life Technologies, Carlsbad, California, USA) and pooled at equimolar 184
concentrations. Pyrosequencing libraries were obtained using the 454 Genome 185
Sequencer FLX platform according to standard 454 protocols (Roche 454 Life Sciences, 186
Branford, CT, USA) at Biocant (Cantanhede, Portugal). The raw reads have been 187
deposited into the NCBI short-reads archive database (accession number: 188 SAMN01908502 to SAMN01908516). 189 190 Post-run analysis 191 192
Data generated from pyrosequencing was processed and analysed using QIIME pipeline 193
(Caporaso et al., 2010). Briefly, sequences shorter than 280 bp and with quality scores 194
lower than 25 were eliminated. Sequences (280 - 445 bp) were assigned to samples by 195
the 8-bp barcodes, grouped into operational taxonomic units (OTUs) using UCLUST 196
(Edgar, 2010) with a phylotype threshold of ≥ 97 % sequence similarity, and were 197
taxonomically assigned using QIIME defaults. The sequences comprising each OTU 198
were aligned using PyNAST (DeSantis et al., 2006) and were classified using 199
Ribosomal Database Project (RDP) classifier (Wang et al., 2007). At the 97 % identity 200
9 level, the final OTU table consisted of 67 566 sequences (average of 4504 sequences 201
per replica) distributed into 9480 OTUs, of those 4444 were represented by more than 202
one sequence. A phylogenetic tree containing the aligned sequences was produced using 203
FastTree (Price et al., 2009). 204
Both alpha and beta diversity metrics were determined using the QIIME pipeline. Alpha 205
diversity was assessed calculating the richness estimator (Chao 1) (Chao, 1984) and the 206
diversity indices (Simpson, Shannon and phylogenetic diversity-PD ) (Simpson, 1949; 207
Shannon & Weaver, 1963; Faith, 1992). Additionally, the sequences data was rarefied 208
(2700 sequences per replica) (Caporaso et al., 2010) and beta diversity patterns of 209
rarefied samples were assessed using the UniFrac metric (Lozupone & Knight, 2005). 210
211
Statistical analysis
212 213
The soil physicochemical properties and alpha diversity metrics among the five soil 214
samples (AApr,Asep,ANSsep ,BApr and Bsep) were compared using the two-way analysis 215
of variance (ANOVA) and the post-hoc Tukey test (SPSS Statistics 19, IBM). 216
Taxon and phylogenetic-based analyses were used to compare 16S rRNA gene 217
sequences among the soil samples and to identify the bacterial groups that significantly 218
changed between i) paddy A and paddy B (crop rotation), ii) April and September 219
(season, i.e., rice crop cycle) and iii) sub-plot ANSSep and paddies A and B (i.e., that 220
may have been affected by the presence of rice plants). For the taxon-based analyses, 221
the percentage of abundance OTUs were compared using ANOVA combined with post 222
hoc Tukey test. Phylogenetic-based comparisons were done using QIIME pipeline. 223
Jackknifed principal coordinate analysis (PCoA) and dendrograms based on 224
(un)weighted UniFrac distances were obtained. Statistical differences between bacterial 225
10 communities from the studied samples plotted on both PCoA were tested using analysis 226
of similarity (ANOSIM). A Mantel test was conducted to evaluate if any of the 227
determined soil physicochemical properties were related to the (un)weighted UniFrac 228
values determined for soil samples and plotted on the PCoA. 229 230 Results 231 232 Physicochemical properties 233 234
The texture of the sampled soil was about 28, 50 and 21 % of sand, silt and clay, 235
respectively (Lopes et al., 2011). The analyses of the five soil samples showed similar 236
physicochemical characteristics, although with some significant differences in pH, 237
water and total nitrogen contents, and concentration of total available phosphorus (Table 238
1). The total carbon content was not significantly different in the analysed samples. 239
240
Bacterial diversity
241 242
In total, 67 566 high-quality sequences from the 15 analysed metagenomes (triplicate of 243
the samples AApr, Asep, ANSsep,BApr and BSep) were obtained. Approximately 2 % of 244
these sequences were not affiliated to the domain Bacteria and were excluded from 245
further analyses. A variable number of high-quality sequences was obtained (ranging 246
from 2754 to 7023). For this reason replicas were normalized by rarefaction to 2700 247
sequences per replica (total of 8100 sequences per soil sample), as recommended by the 248
QIIME pipeline instructions (Caporaso et al., 2010). 249
11 Similar values of estimator Chao1 and Simpson index were obtained for all samples, 250
demonstrating similar diversity coverage and an even distribution of sequences in the 251
studied samples, respectively. The number of OTUs per rarefied soil sample varied 252
between 1170 (BSep) and 1290 (ANSsep). Accordingly, sample ANSSep showed the 253
highest values of PD and Shannon indices (P < 0.05) (Table 2), which indicates that the 254
bacterial community in this sample was more diverse than in those of cropped soils 255
(AApr,Asep , BApr andBsep). 256
257
Taxonomic affiliation of the total rarefied sequences
258 259
Each analysed metagenome included sequences that could not be assigned beyond the 260
bacterial domain (average of 2.2 ± 0.3 %). The remaining bacterial sequences were 261
affiliated to 39 phyla, with 19 presenting sequence abundances above 0.1 % (Fig. 2 and 262
Table S1). Among these 19 phyla, sequences classified as Acidobacteria (32.4 %), 263
Proteobacteria (26.3 %), Chloroflexi (8.6 %), Actinobacteria (7.5 %), Bacteroidetes
264
(7.3 %), and Gemmatimonadetes (6.6 %) comprised about 80–90 % of all sequences. 265
Other phyla with average abundance >1 % included Nitrospira (2.7 %), Elusimicrobia 266
and Firmicutes (both averaging 1.0 %). The phyla Chlorobi, Cyanobacteria, 267
Verrucomicrobia, Planctomycetes and candidate phyla, such as TM7 and AD3, were
268
less abundant (abundance ranging from 0.1 to 1 %) (Fig. 2). 269
Acidobacteria, the most abundant phylum, were represented mainly by sequences
270
affiliated to the classes Acidobacteria (16.0 %, out of which 99 % belonged to 271
"Koribacteraceae") and "Solibacteres" (11.0 %, all included in "Solibacteraceae").
272
Most of the Proteobacteria sequences were affiliated to Alphaproteobacteria (23.3 %, 273
half of which belonged to the Sphingomonadaceae) (Table S2). Thus, these three were 274
12 the most abundant families in the analysed metagenomes, representing 26–43 % of the 275
total of sequences (Fig. S1 and Table S4). 276
Given the small length of the 16S rRNA gene fragments analysed (280 - 445 bp, 277
average of ~360 bp), the low resolution of the 16S rRNA gene sequence analysis for 278
certain bacterial groups (Fox et al., 1992; Bennasar et al., 1996; Nübel et al., 1996; 279
Ibrahim et al., 1997; Lebuhn et al., 2000; Jaspers & Overmann, 2004), and the eventual 280
existence of organisms not yet affiliated to known taxa, only 33 % of the total 281
sequences could be classified at the genus level. As expected, the most abundant genera 282
belonged to the predominant families, and were “Candidatus Solibacter” (10.9 %), 283
“Kaistobacter" (9.8 %), and “Candidatus Koribacter” (3.7 %) of the families 284
"Solibacteraceae”, Sphingomonadaceae and “Koribacteraceae", respectively. Other 285
abundant genera included Rhodoplanes (1.6 %) and Nitrospira (1.3 %) of the families 286
Hyphomicrobiaceae and Nitrospiraceae, respectively. The abundance of the other
287
genera was below 1 % (Table S5). 288
289
OTUs distribution and taxonomic affiliation
290 291
Considering the nucleotide sequence similarity threshold value of ≥ 97 %, a total of 292
6748 OTUs were obtained from rarefied data of the five soil samples analysed. Of these 293
OTUs, 470 were common to all samples, 601 were common to the cropped samples 294
(AApr, Asep, BApr and BSep), and 688 were common to samples A, irrespective of rice 295
plant presence (AApr, Asep andANSsep) (Fig. S2a and b). 296
Among the 6748 OTUs, 371 presented abundance > 0.1 % in the three replicas of at 297
least one sample, and are from this point forward referred to as representative OTUs of 298
that given sample(s). Of these, 276 were common to all samples, 297 were common to 299
13 samples AApr, Asep, BApr andBsep and 299 were common to samples A, irrespective of 300
rice plant presence (AApr,Asep and ANSsep). Thus, about 80 % of the representative 301
OTUs were common to all samples and unique OTUs were, in general, rare (less than 302
0.1 % abundance). Regardless of the threshold of abundance used to create Venn 303
diagrams, sample ANSsep showed the highest number of unique OTUs (Fig. S2). 304
Among the 276 OTUs common to the five samples, only 82 had abundance > 0.1 % in 305
all the samples, being considered core OTUs. These OTUs were affiliated to the most 306
abundant phyla, except one that was assigned to the candidate phylum AD3 (Table 3). 307
As could be expected, the majority of core OTUs was evenly distributed, presenting 308
abundances between 0.1 and 1 %. Exceptions were two OTUs assigned to the families 309
Sphingomonadaceae (“Kaistobacter") and "Koribacteraceae", which represented, on 310
average, 6.9 and 1.3 % of the total recovered diversity (Table 3 and Fig. S1). 311
312
Relationship between bacterial communities and edaphic factors
313 314
To compare the composition and structure of the bacterial communities of the analysed 315
soil samples, the beta diversity was assessed. In this analysis, the three replicas of each 316
of the five samples were compared as 15 independent data sets. The unweighted and 317
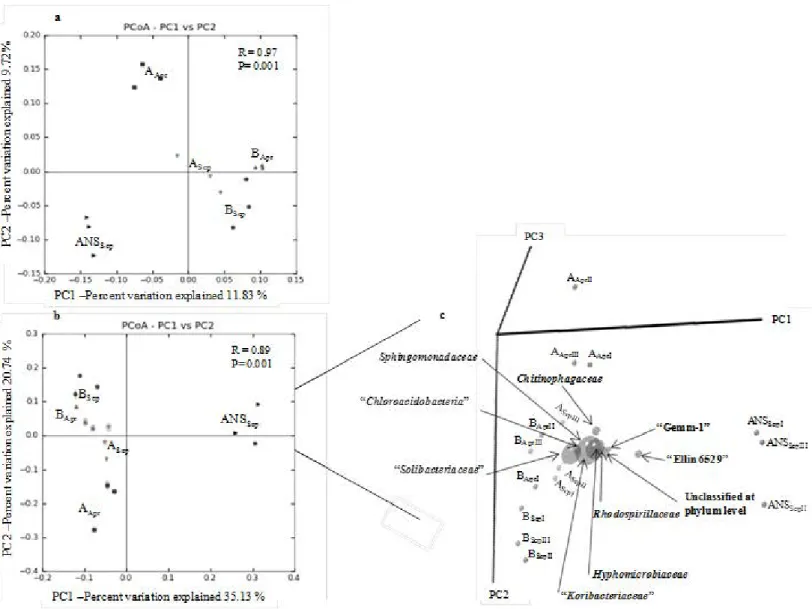
weighted UniFrac-based PCoA explained, respectively, 21.6 and 55.9 % of the total 318
variation among the composition and structure of the bacterial communities, and 319
supported the distribution of samples in distinct groups (Fig. 3a and b). ANOSIM 320
confirmed that the groups plotted in both PCoA were significantly different 321
(unweighted UniFrac: R= 0.97, P = 0.001; weighted UniFrac: R= 0.89, P = 0.001). 322
Bacterial lineages affiliated to abundant phyla (Fig. 2) contributed to the variations 323
observed in the weighted UniFrac PCoA (Fig. 3b and c). Correlations between UniFrac 324
14 values and edaphic parameters were determined using Mantel tests (Table 4). A mild 325
correlation between unweighted distances and water, total carbon and total available-P 326
contents, and C:P and N:P ratios was observed. When weighted distances were 327
considered only correlations with the water and total carbon contents were observed. 328
329
Comparison of rice cropped and uncropped soil
330 331
A strong primary clustering of AApr, Asep, BApr and BSep versus ANSsep soil sample, 332
represented in both UniFrac-based PCoA biplots (Fig. 3a and b), evidenced differences 333
between the bacterial communities of cropped and uncropped soil samples. In fact, the 334
average UniFrac distances measured between uncropped (ANSsep) and cropped soil 335
samples (AApr, Asep, BApr or Bsep) were the highest (Fig. S4). Several representative 336
OTUs in cropped samples (including in ASep), such as those assigned to 337
“Solibacteraceae" (“Candidatus Solibacter”), "Koriobacteraceae" (“Candidatus 338
Koribacter” among others), and Sphingomonadaceae (“Kaistobacter" among others), 339
were absent or rare in the uncropped soil sample. Inversely, several representative 340
OTUs in sample ANSSep, affiliated to Chloroflexi ("Ellin 6529"), "Acidobacteria-2", 341
AD3, Nostocaceae, among others, were absent or rare in samples AApr,Asep, BApr and 342
BSep (Table S6). The majority of these OTUs were affiliated to bacterial lineages that 343
correlated most with the different groups depicted in the weighted PCoA (Fig. 3b and 344
c). Also the higher abundance of unclassified sequences in ANSSep than in the other 345
samples contributed to distinguish its bacterial community from the others. 346
347
Comparison of soils at different crop rotation stages
348 349
15 The bacterial communities from the 3rd (A
Apr and Asep) and 4th year (BApr andBsep)of 350
crop rotation, compared based on UniFrac-based PCoA (Fig. 3a and b), did not cluster 351
(Fig. 3a and b, and S3a and b). Samples of paddies A and B were distributed along axis 352
2 of the weighted UniFrac-based PCoA biplot (Fig. 3b), with the most divergent being 353
AApr and BSep. The highest and lowest average UniFrac distance between each pair of 354
these samples was found for the pairs AApr/Bsep and BApr/Bsep, respectively (Fig. S4a and 355
b). A higher similarity between the bacterial communities of soil B sampled in April 356
and September than with samples of soil A was evidenced. The bacterial community of 357
sample ASep was as closer to samples of the 4th year of crop rotation (BApr and BSep,) as 358
to AApr. 359
Sample AApr contained a higher number of rare and representative unique OTUs than the 360
ASep, BApr and BSep samples (Fig. S2). Representative unique OTUs assigned to 361
Actinobacteria (Cellulomonadaceae) and Bacteroidetes (Sphingobacteriales, mainly of
362
the family Chitinophagaceae) (Table S7) present in AApr made this sample the most 363
distinct amongst the cropped soil samples (Fig. 3b and c). 364
The distinction of the bacterial communities over the crop rotation was supported by 365
some OTUs whose abundance was higher [e.g., assigned to Bacteroidetes 366
(Sphingobacteriales, Flavobacteriales), and Alphaproteobacteria (Caulobacteraceae)] 367
or lower [e.g., assigned to Acidobacteria (Acidobacteriales, "Solibacterales"), 368
Bacteroidetes (Bacteroidales), Chloroflexi (Anaerolineae) and Chlorobi ("SJA-28")] in
369
samples of the 3rd year (AApr and Asep) than of the 4th year (BApr and Bsep) of crop 370
rotation (Table S7). 371
372
Comparison of soils before rice seeding and after harvesting
373 374
16 The average UniFrac distances obtained between cropped soil samples collected in 375
April and September in the 3rd (AApr andAsep,)or in the 4th year (BApr andBsep) (Fig. S4a 376
and b) indicate variations, although small, of the bacterial communities before rice 377
seeding and after harvesting, mainly in soil A. Unweighted, but not weighted, UniFrac 378
clustering via UPGMA showed some overlapping in the composition of 4th year (B) 379
bacterial communities of April and September (Fig. S3a). It is, thus, suggested that 380
major variations in the bacterial community over this period were mainly due to 381
modifications on the relative abundance of soil bacterial members. OTUs assigned to 382
"Thermodesulfovibrionaceae" within the phylum Nitrospira, which were more abundant 383
in September than in April in both cropped soils (A and B), may have contributed to the 384
observed variation (Table S8). 385
386
Discussion
387 388
Composition and structure of bulk soil bacterial community
389 390
The predominance of Acidobacteria, Proteobacteria, Chloroflexi, Actinobacteria and 391
Bacteroidetes in the paddy soils studied was expected, since these groups have been
392
described as common inhabitants of agriculture soils (İnceoğlu et al., 2011; Fierer et al., 393
2012; Kuramae et al., 2012), including rice paddy soils (Tanahashi et al., 2005; 394
Asakawa & Kimura, 2008; Xuan et al., 2012). Half of the 82 core OTUs identified in 395
this study belonged to the classes Acidobacteria, "Solibacteres" and 396
Alphaproteobacteria. Alphaproteobacteria comprise organisms with diverse 397
physiological properties (Rappé & Giovannoni, 2003). Therefore, a clear prediction 398
about the ecology and biochemical role of these members in that habitat seems difficult. 399
17 However, it is noted that Alphaproteobacteria related with core OTUs enclose 400
chemoorganotrophs, some of which are catalase producers and may be involved in 401
lignin (e.g., Caulobacter) (Steinman et al., 1997) or aromatic compounds degradation 402
(e.g., Sphingomonadaceae) (Kersters et al., 2006). Nitrogen fixation is another relevant 403
function found in presumably (photo)organotrophic Alphaproteobacteria found in the 404
studied soils (e.g., Rhodospirillaceae, Hyphomicrobiaceae) (Heising & Schink, 1998; 405
Boer et al., 2005; Kersters et al., 2006; DeAngelis et al., 2011). In comparison to 406
Alphaproteobacteria, Acidobacteria and Gemmatimonadetes are poorly characterized,
407
since only a small fraction of these bacteria were cultivated (Barns et al., 1999; Quaiser 408
et al., 2003; Rappé & Giovannoni, 2003; Davis et al., 2005; Kielak et al., 2008;
409
DeBruyn et al., 2011). Nevertheless, Gemmatimonadetes represents a phylum with 410
ubiquitous distribution (Rappé & Giovannoni, 2003; DeBruyn et al., 2011). 411
Acidobacteria mainly from sub-divisions 1, 2, 3, 4 and 6 are common soil inhabitants
412
(Jones et al., 2009; Eichorst et al., 2011). These organisms are described as chemo-413
organotrophic, oligotrophic bacteria, with slow growth and K-selected life strategy 414
(Davis et al., 2005; Fierer & Jackson, 2006; Pankratov et al., 2008; Davis et al., 2011; 415
DeAngelis et al., 2011; Eichorst et al., 2011). The edaphic characteristics of the 416
analysed soils seem to have favoured the abundance of members of this phylum, mainly 417
of the families "Koriobacteraceae" and "Solibacteraceae", of sub-divisions 1 and 3, 418
respectively. Cultivable members of these sub-divisions, respectively related with 419
“Candidatus Koribacter versatilis” and “Candidatus Solibacter usitatus”, are described 420
as growing optimally at the pH values found in the sampled soils (Eichorst et al., 2011). 421
They are capable of decomposing complex substrates (e.g., xylan, hemicellulose, 422
cellulose, pectin), a property that would support an active intervention in the 423
degradation of plant litter in soils (Ward et al., 2009; Eichorst et al., 2011). In addition, 424
18 some members of Acidobacteria subdivision 1, in which the family “Koriobacteraceae" 425
is included, are capable of feeding on readily oxidizable carbon (Eichorst et al., 2011). 426
Based on the characteristics previously described for bacterial groups related with the 427
core bacterial members of the analysed samples, it can be hypothesized that they may 428
have an important role in the cycling of organic carbon derived from plants litter or root 429
exudates (DeAngelis et al., 2011; Baldrian et al., 2012; Eichorst & Kuske, 2012), a 430
crucial activity in ecosystems, including rice paddies (Asari et al., 2007; Rui et al., 431
2009). 432
Verrucomicrobia have been described as abundant inhabitants of paddy soils (Kikuchi
433
et al., 2007; Asakawa & Kimura, 2008; Xuan et al., 2012), although presented low
434
abundance in the current study. This observation may be due to the primers used, since 435
in silico analyses demonstrated that this primer set may fail the detection of
436
verrucomicrobial sequences (Wang & Qian, 2009), explaining the underestimation of 437
this phylum, even using culture independent methods (Bergmann et al., 2011). 438
439
Variations in the composition and structure of bulk soil bacterial community
440 441
Diversity analyses revealed a richer bacterial community in uncropped soil (ANSSep) 442
than in rice cropped soil samples (AApr, Asep, BApr and Bsep). This observation may be 443
supported by previous studies which demonstrate that the bacterial communities of the 444
rhizosphere are less diverse than those of bulk soil (Sørensen, 1997; Garbeva et al., 445
2004; Berg & Smalla, 2009; Gomes et al., 2010; Uroz et al., 2010). Given ANS was a 446
subplot of paddy A, the influence of flooding and climate conditions was identical in 447
samples ASep and ANSSep. Hence, a lower diversity in ASep than in ANSSep suggests that 448
the presence of rice plants contributed to attenuate eventual bacterial community 449
19 variations occurring in sample ANSSep due to flooding and climate conditions. The 450
dense root mat characteristic of rice cropped paddy soils (Liesack et al., 2000), 451
combined with the usual flooding state of paddy fields may promote the distribution of 452
root exudates in flooded soils. Given their presumable nutritional profile, the high 453
relative abundance of "Solibacteraceae", "Koriobacteraceae" and Sphingobacteraceae 454
observed in cropped soils may have been due not only to the presence of rice plants 455
litter, but also of rice exudates. In addition, the proliferation of the organisms of these 456
groups may have contributed to lessen the relative abundance of others, such as 457
unclassified bacteria and members of "Acidobacteria-2" and AD3, absent or rare in 458
cropped soil. In contrast, the absence of rice rhizosphere and the consequent scarcity of 459
plant litter and root exudates in the uncropped soil could have favoured the development 460
of other bacterial lineages with slow growth and ability to survive under low substrate 461
availability (e.g., Chloroflexi "Ellin6529"), as was described before for members of this 462
phylum (Acosta-Martínez et al., 2010). Water content is a parameter affected by several 463
external conditions, including the climate. However, since ANS was a sub-plot of paddy 464
A, it was under the same flood regime. Thus, the presence of rice crop in ASep may have 465
contributed to the significantly higher water content observed in this sample than in the 466
uncropped soil. Indeed, the ability of plants to increase the retention of water in soil is 467
reported (Chapin & Körner, 1995). Also, the higher abundance of OTUs affiliated to 468
Nostocaceae in uncropped than in cropped soil samples may be related with the same
469
abiotic parameter. Nostoc members have been referred to as being more prevalent in dry 470
than in wet paddy soils (Roger et al., 1993). In addition, the poor plant cover in the 471
uncropped sub-plot may have also favoured the access to sun light, and thus, the 472
development of these photosynthesizing microorganisms. 473
20 The stage of the crop rotation affected the bacterial community of cropped bulk soil. 474
Through the weighted UniFrac analysis, a gradient from AApr toBSep was observed. The 475
high number of rare and representative unique OTUs (Bacteroidetes/Sphingobacteriales 476
and Actinobacteria/Cellulomonadaceae) together with the abundance of other 477
presumably aerobic chemoorganotrophs (Bacteroidetes/Flavobacteriales and 478
Alphaproteobacteria/Caulobacteraceae) in sample AApr, contributed to distinguish this 479
sample from the others. Given that sample AApr was collected soon after alfalfa 480
harvesting, it can be hypothesized that the root exudates and debris of the forage crop 481
may have favoured the development of these bacterial groups. However, additional 482
studies involving the analysis of samples collected from a subplot where alfalfa was not 483
cultivated are needed to confirm this hypothesis. The abundance of Alphaproteobacteria 484
(Caulobacteraceae) and Bacteroidetes (Sphingobacteriales and Flavobacteriales) was
485
higher in paddy A than in paddy B. Inversely, the abundance of Acidobacteriales and 486
"Solibacterales” was higher in paddy B than in paddy A. These variations may have 487
been due to several alterations in the soil environment. The presence of alfalfa debris in 488
paddy A and of rice root exudates/litter in paddy B may have contributed to the 489
observed differences. However, the influence of soil amendments with mineral P and 490
compost in paddy B cannot be disregarded. Also the abundance of presumable obligate 491
anaerobic chemo-organotrophs (Chloroflexi/Anaerolineae and 492
Bacteroidetes/Bacteroidales) and phototrophs (Chlorobi "SJA-28") was higher in paddy
493
B than in paddy A. Beside the changes in the available nutrients, derived from the 494
substitution of alfalfa for rice root exudates/litter and from the soil amendments, also 495
the higher water content observed in samples BApr andBsep than inAApr and Asep could 496
have contributed to the increased abundance of these presumable anaerobic bacteria in 497
21 paddy B. It is worth mentioning that despite the amendments made, the rice productivity 498
decreased from the 3rd to the 4th year of the crop rotation. 499
Although this kind of studies in real agriculture fields has several advantages, including 500
the avoidance of microcosms or mesocosms biases, these latter approaches are required 501
to get a reliable assessment of the influence of some variables. Such studies would be 502
useful to assess the contribution of each of the varying parameters, i.e., paddy A/paddy 503
B soil properties, alfalfa/rice litter and/or exudates, P/organic amendments, flooding, 504
soil water content, while maintaining the climate conditions. 505
According to the results obtained, variations on the bulk soil bacterial communities over 506
time, i.e., variations over the rice annual cycle, were mainly due to alterations in the 507
abundance of some bacterial lineages rather than to presence/absence shifts. Similar 508
findings were reported in previous studies based on community analyses fingerprinting 509
(Kikuchi et al., 2007; Lopes et al., 2011). Among the representative bacterial lineages 510
occurring in the studied soils, members affiliated to "Thermodesulfovibrionaceae”, 511
within Nitrospira, stood out as having higher abundance in cropped soils after rice 512
harvesting (ASep and BSep) than before rice seeding. The increased abundance of this 513
phylum after rice harvesting was reported before (Xuan et al., 2012), and may be due to 514
the availability of inorganic compounds resultant from organotrophic metabolism of 515
plant debris and root exudates. Indeed, Nitrospira includes chemolithotrophs involved 516
in the N, Fe and S cycles through the activity of nitrite- and ferrous iron-oxidizing and 517
sulfate-reducing bacteria (Henry et al., 1994; Ehrich et al., 1995; Hippe, 2000). The 518
development of sulfate-reducing bacteria, most probably obligate anaerobes, may have 519
been also favoured by the flooding conditions prevalent during the growth of rice 520
plants. The proliferation of members of these lineages during the late stage of the 521
growth of rice plants, may explain their apparent predominance after rice harvesting. 522
22 Indeed, the activity of sulfate- and iron-reducers is important in paddy soils (Liesack et 523
al., 2000), and can be observed in aged rice roots, due to blackening by ferrous sulfide
524
precipitation at the late stage of the growth of rice plants. 525
In summary, the hypothesis supporting this study was confirmed, since bacterial 526
community variations coincided with the occurrence of rice cropping and different 527
periods of the annual rice cycle or crop rotation. The variations observed can be 528
summarized in three major highlights: a) In September, rice cropped soil (ASep) 529
presented a lower diversity and lower relative abundance of rare OTUs (e.g., 530
Chloroflexi "Ellin6529", Nostocaceae) than the uncropped (ANSSep) soil; b) From April 531
to September, a relative increase in the abundance of “Thermodesulfovibrionaceae” was 532
observed; c) In the 4th year of the crop rotation, the relative abundance of Acidobacteria 533
and of presumably anaerobic bacteria was higher than in the 3rd year; in contrast, the 534
abundance of presumable aerobic bacteria was higher in the 3rd than in the 4th year, 535
mainly in April. 536
In future studies, the interpretation of the observed bacterial community variations in 537
relation to other indicators of nutrients availability and/or microbial activity may bring 538
additional insights into the factors driving the dynamics of bacterial populations in this 539 type of environment. 540 541 542 Acknowledgments 543 544
Authors gratefully acknowledge Serafim Andrade (DRAP Centro, Portugal) for 545
valuable help in soil sampling and for giving all the information concerning the farming 546
management. Dr. Angeles Prieto-Fernández and Dr. Carmen Trasar-Cepeda (IIAG-547
23 CSIC, Santiago de Compostela, Spain) are acknowledge for the determination of the 548
soil physicochemical parameters, and Dr. Conceição Egas and Dr. Miguel Pinheiro 549
(Advanced Services Unit, Biocant, Portugal) for the technical guidance on 454 550
pyrosequencing data analyses. Jonathan Barber (CICA, Faculdade de Engenharia 551
Universidade do Porto, Portugal) for the technical guidance with bioinformatic tools. 552
This work was financially supported by Fundação para a Ciência e a Tecnologia in the 553
form of PhD grant SFRH/BD/44876/2008 and through projects PEst-554
OE/EQB/LA0016/2011 and PEst-C/EQB/UI0511/2011. 555
556
References
557 558
Acosta-Martínez V, Dowd SE, Sun Y, Wester D & Allen V (2010) Pyrosequencing 559
analysis for characterization of soil bacterial populations as affected by an integrated 560
livestock-cotton production system. Appl Soil Ecol 45: 13-25. 561
Asakawa S & Kimura M (2008) Comparison of bacterial community structures at main 562
habitats in paddy field ecosystem based on DGGE analysis. Soil Biol Biochem 40: 563
1322-1329. 564
Asari N, Ishihara R, Nakajima Y, Kimura M & Asakawa S (2007) Succession and 565
phylogenetic composition of eubacterial communities in rice straw during 566
decomposition on the surface of paddy field soil. Soil Sci Plant Nutr 53: 56-65. 567
Baldrian P, Kolarik M, Stursova M et al. (2012) Active and total microbial communities 568
in forest soil are largely different and highly stratified during decomposition. ISME J 6: 569
248-258. 570
24 Barns SM, Takala SL & Kuske CR (1999) Wide distribution and diversity of members 571
of the bacterial kingdom Acidobacterium in the environment. Appl Environ Microbiol 572
65: 1731-1737.
573
Bennasar A, Rosselló-Mora R, Lalucat J & Moore ERB (1996) 16S rRNA gene 574
sequence analysis relative to genomovars of Pseudomonas stutzeri and proposal of 575
Pseudomonas balearica sp. nov. Int J Syst Bacteriol 46: 200-205.
576
Berg G & Smalla K (2009) Plant species and soil type cooperatively shape the structure 577
and function of microbial communities in the rhizosphere. FEMS Microbiol Ecol 68: 1-578
13. 579
Bergmann GT, Bates ST, Eilers KG, Lauber CL, Caporaso JG, Walters WA, Knight R 580
& Fierer N (2011) The under-recognized dominance of Verrucomicrobia in soil 581
bacterial communities. Soil Biol Biochem 43: 1450-1455. 582
Boer Wd, Folman LB, Summerbell RC & Boddy L (2005) Living in a fungal world: 583
impact of fungi on soil bacterial niche development. FEMS Microbiol Rev 29: 795-811. 584
Caporaso JG, Kuczynski J, Stombaugh J et al. (2010) QIIME allows analysis of high-585
throughput community sequencing data. Nat Methods 7: 335-336. 586
Chao A (1984) Nonparametric estimation of the number of classes in a population. 587
Scand J Stat: 265-270.
588
Chapin FS, III & Körner C (1995) Arctic and alpine biodiversity: patterns, causes and 589
ecosystem consequences. Springer-Verlag, Berlin.
590
Davis KER, Joseph SJ & Janssen PH (2005) Effects of growth medium, inoculum size, 591
and incubation time on culturability and isolation of soil bacteria. Appl Environ Microb 592
71: 826-834.
25 Davis KER, Sangwan P & Janssen PH (2011) Acidobacteria, Rubrobacteridae and 594
Chloroflexi are abundant among very slow-growing and mini-colony-forming soil
595
bacteria. Environ Microbiol 13: 798-805. 596
DeAngelis KM, Allgaier M, Chavarria Y, Fortney JL, Hugenholtz P, Simmons B, 597
Sublette K, Silver WL & Hazen TC (2011) Characterization of trapped lignin-degrading 598
microbes in tropical forest soil. PLoS ONE 6: e19306. 599
DeBruyn JM, Nixon LT, Fawaz MN, Johnson AM & Radosevich M (2011) Global 600
biogeography and quantitative seasonal dynamics of Gemmatimonadetes in soil. Appl 601
Environ Microb 77: 6295-6300.
602
DeSantis TZ, Hugenholtz P, Larsen N, Rojas M, Brodie EL, Keller K, Huber T, Dalevi 603
D, Hu P & Andersen GL (2006) Greengenes, a chimera-checked 16S rRNA gene 604
database and workbench compatible with ARB. Appl Environ Microb 72: 5069-5072. 605
Edgar RC (2010) Search and clustering orders of magnitude faster than BLAST. 606
Bioinformatics 26: 2460-2461.
607
Ehrich S, Behrens D, Lebedeva E, Ludwig W & Bock E (1995) A new obligately 608
chemolithoautotrophic, nitrite-oxidizing bacterium, Nitrospira moscoviensis sp. nov. 609
and its phylogenetic relationship. Arch Microbiol 164: 16-23. 610
Eichorst SA & Kuske CR (2012) Identification of cellulose-responsive bacterial and 611
fungal communities in geographically and edaphically different soils by using stable 612
isotope probing. Appl Environ Microb 78: 2316-2327. 613
Eichorst SA, Kuske CR & Schmidt TM (2011) Influence of plant polymers on the 614
distribution and cultivation of bacteria in the phylum Acidobacteria. Appl Environ 615
Microbiol 77: 586-596.
26 Eilers KG, Debenport S, Anderson S & Fierer N (2012) Digging deeper to find unique 617
microbial communities: the strong effect of depth on the structure of bacterial and 618
archaeal communities in soil. Soil Biol Biochem 50: 58-65. 619
Faith DP (1992) Conservation evaluation and phylogenetic diversity. Biol Conserv 61: 620
1-10. 621
Fenández-Aparicio M, Sillero JC & Rubiales D (2007) Intercropping with cereals 622
reduces infection by Orobanche crenata in legumes. Crop Prot 26: 1166-1172. 623
Fierer N & Jackson RB (2006) The diversity and biogeography of soil bacterial 624
communities. Proc Natl Acad Sci U S A 103: 626-631. 625
Fierer N, Lauber CL, Ramirez KS, Zaneveld J, Bradford MA & Knight R (2012) 626
Comparative metagenomic, phylogenetic and physiological analyses of soil microbial 627
communities across nitrogen gradients. ISME J 6: 1007-1017. 628
Fox GE, Wisotzkey JD & Jurtshuk P (1992) How close is close: 16S rRNA sequence 629
identity may not be sufficient to guarantee species identity. Int J Syst Bacteriol 42: 166-630
170. 631
Galloway JN, Townsend AR, Erisman JW, Bekunda M, Cai Z, Freney JR, Martinelli 632
LA, Seitzinger SP & Sutton MA (2008) Transformation of the nitrogen cycle: recent 633
trends, questions, and potential solutions. Science 320: 889-892. 634
Garbeva P, van Veen JA & van Elsas JD (2004) Microbial diversity in soil: selection of 635
microbial populations by plant and soil type and implications for disease 636
suppressiveness. Annu Rev Phytopathol 42: 243-270. 637
Gomes NCM, Cleary DFR, Pinto FN, Egas C, Almeida A, Cunha A, Mendonça-Hagler 638
LCS & Smalla K (2010) Taking root: enduring effect of rhizosphere bacterial 639
colonization in mangroves. PLoS ONE 5: e14065. 640
27 Guitián OF & Carballas T (1976) Técnicas de análisis de suelos. Pico Sacro, Santiago 641
de Compostela. 642
Heising S & Schink B (1998) Phototrophic oxidation of ferrous iron by a 643
Rhodomicrobium vannielii strain. Microbiology 144: 2263-2269.
644
Henry EA, Devereux R, Maki JS, Gilmour CC, Woese CR, Mandelco L, Schauder R, 645
Remsen CC & Mitchell R (1994) Characterization of a new thermophilic sulfate-646
reducing bacterium. Arch Microbiol 161: 62-69. 647
Hippe H (2000) Leptospirillum gen. nov. (ex Markosyan 1972), nom. rev., including 648
Leptospirillum ferrooxidans sp. nov. (ex Markosyan 1972), nom. rev. and
649
Leptospirillum thermoferrooxidans sp. nov. (Golovacheva et al. 1992). Int J Syst Evol
650
Micr 50: 501-503.
651
Hussain S, Siddique T, Saleem M, Arshad M & Khalid A (2009) Impact of pesticides 652
on soil microbial diversity, enzymes, and biochemical reactions. Advances in agronomy, 653
Vol. 102 (Donald LS, eds.), pp. 159-200. Academic Press, San Diego.
654
Ibrahim A, Gerner-Smidt P & Liesack W (1997) Phylogenetic relationship of the 655
twenty-one DNA groups of the genus Acinetobacter as revealed by 16S ribosomal DNA 656
sequence analysis. Int J Syst Bacteriol 47: 837-841. 657
İnceoğlu Ö, Al-Soud WA, Salles JF, Semenov AV & van Elsas JD (2011) Comparative 658
analysis of bacterial communities in a potato field as determined by pyrosequencing. 659
PLoS ONE 6: e23321.
660
Jaspers E & Overmann J (2004) Ecological significance of microdiversity: identical 16S 661
rRNA gene sequences can be found in bacteria with highly divergent genomes and 662
ecophysiologies. Appl Environ Microb 70: 4831-4839. 663
28 Jones RT, Robeson MS, Lauber CL, Hamady M, Knight R & Fierer N (2009) A 664
comprehensive survey of soil acidobacterial diversity using pyrosequencing and clone 665
library analyses. ISME J 3: 442-453. 666
Kelner DJ, Vessey JK & Entz MH (1997) The nitrogen dynamics of 1-, 2- and 3-year 667
stands of alfalfa in a cropping system. Agric Ecosyst Environ 64: 1-10. 668
Kersters K, De Vos P, Gillis M, Swings J, Vandamme P & Stackebrandt E (2006) 669
Introduction to the Proteobacteria. The Prokaryotes, Vol. 5 (Dwarkin M, Falkow S, 670
Rosenberg E, Schleifer KH, and Stackebrandt E, eds.), pp. 3–37. Springer, New York. 671
Kielak A, Pijl AS, van Veen JA & Kowalchuk GA (2008) Phylogenetic diversity of 672
Acidobacteria in a former agricultural soil. ISME J 3: 378-382.
673
Kikuchi H, Watanabe T, Jia Z, Kimura M & Asakawa S (2007) Molecular analyses 674
reveal stability of bacterial communities in bulk soil of a Japanese paddy field: 675
estimation by denaturing gradient gel electrophoresis of 16S rRNA genes amplified 676
from DNA accompanied with RNA. Soil Sci Plant Nutr 53: 448-458. 677
Kuramae EE, Yergeau E, Wong LC, Pijl AS, van Veen JA & Kowalchuk GA (2012) 678
Soil characteristics more strongly influence soil bacterial communities than land-use 679
type. FEMS Microbiol Ecol 79: 12-24. 680
Ladha JK & Reddy PM (2003) Nitrogen fixation in rice systems: state of knowledge 681
and future prospects. Plant Soil 252: 151-167. 682
Lauber CL, Hamady M, Knight R & Fierer N (2009) Pyrosequencing-based assessment 683
of soil pH as a predictor of soil bacterial community structure at the continental scale. 684
Appl Environ Microb 75: 5111-5120.
685
Lebuhn M, Achouak W, Schloter M, Berge O, Meier H, Barakat M, Hartmann A & 686
Heulin T (2000) Taxonomic characterization of Ochrobactrum sp. isolates from soil 687
29 samples and wheat roots, and description of Ochrobactrum tritici sp. nov. and 688
Ochrobactrum grignonense sp. nov. Int J Syst Evol Micr 50: 2207-2223.
689
Liebman M & Davis AS (2000) Integration of soil, crop and weed management in low-690
external-input farming systems. Weed Res 40: 27-47. 691
Liesack W, Schnell S & Revsbech NP (2000) Microbiology of flooded rice paddies. 692
FEMS Microbiol Rev 24: 625-645.
693
Lopes AR, Faria C, Prieto-Fernández Á, Trasar-Cepeda C, Manaia CM & Nunes OC 694
(2011) Comparative study of the microbial diversity of bulk paddy soil of two rice 695
fields subjected to organic and conventional farming. Soil Biol Biochem 43: 115-125. 696
Lozupone C & Knight R (2005) UniFrac: a new phylogenetic method for comparing 697
microbial communities. Appl Environ Microb 71: 8228-8235. 698
Mardis ER (2008) Next-generation DNA sequencing methods. Annu Rev Genomics 699
Hum Genet 9: 387-402.
700
Mardis ER (2011) A decade's perspective on DNA sequencing technology. Nature 470: 701
198-203. 702
Matson PA, Parton WJ, Power AG & Swift MJ (1997) Agricultural intensification and 703
ecosystem properties. Science 277: 504-509. 704
Newby DT, Marlowe EM & Maier RM (2009) Nucleic acid-based methods of analysis. 705
Environmental microbiology, (Maier RM, Pepper IL, and Gerba CP, eds.), pp. 243-284.
706
Academic Press, Burlington. 707
Nübel U, Engelen B, Felske A, Snaidr J, Wieshuber A, Amann RI, Ludwig W & 708
Backhaus H (1996) Sequence heterogeneities of genes encoding 16S rRNAs in 709
Paenibacillus polymyxa detected by temperature gradient gel electrophoresis. J
710
Bacteriol 178: 5636-5643.
30 Pankratov TA, Serkebaeva YM, Kulichevskaya IS, Liesack W & Dedysh SN (2008) 712
Substrate-induced growth and isolation of Acidobacteria from acidic Sphagnum peat. 713
ISME J 2: 551-560.
714
Pietsch G, Friedel JK & Freyer B (2007) Lucerne management in an organic farming 715
system under dry site conditions. Field Crop Res 102: 104-118. 716
Price MN, Dehal PS & Arkin AP (2009) FastTree: computing large minimum evolution 717
trees with profiles instead of a distance matrix. Mol Biol Evol 26: 1641-1650. 718
Quaiser A, Ochsenreiter T, Lanz C, Schuster SC, Treusch AH, Eck J & Schleper C 719
(2003) Acidobacteria form a coherent but highly diverse group within the bacterial 720
domain: evidence from environmental genomics. Mol Microbiol 50: 563-575. 721
Quayle WC, Oliver DP & Zrna S (2006) Field dissipation and environmental hazard 722
assessment of clomazone, molinate, and thiobencarb in Australian rice culture. J Agr 723
Food Chem 54: 7213-7220.
724
Ramirez KS, Craine JM & Fierer N (2012) Consistent effects of nitrogen amendments 725
on soil microbial communities and processes across biomes. Global Change Biol 18: 726
1918-1927. 727
Rappé MS & Giovannoni SJ (2003) The uncultured microbial majority. Annu Rev 728
Microbiol 57: 369-394.
729
Roesch LFW, Fulthorpe RR, Riva A, Casella G, Hadwin AKM, Kent AD, Daroub SH, 730
Camargo FAO, Farmerie WG & Triplett EW (2007) Pyrosequencing enumerates and 731
contrasts soil microbial diversity. ISME J 1: 283-290. 732
Roger PA, Zimmerman WJ & Lumpkin TA (1993) Microbiological management of 733
wetland rice fields. Soil microbial ecology: applications in agricultural and 734
environmental mangement, (Metting FB, eds.), pp. 417-455. Marcel Dekker, Inc, New
735
York. 736
31 Rosen CJ & Allan DL (2007) Exploring the benefits of organic nutrient sources for crop 737
production and soil quality. HortTechnology 17: 422-430. 738
Rui J, Peng J & Lu Y (2009) Succession of bacterial populations during plant residue 739
decomposition in rice field soil. Appl Environ Microb 75: 4879-4886. 740
Rui W & Zhang W (2010) Effect size and duration of recommended management 741
practices on carbon sequestration in paddy field in Yangtze delta plain of China: a meta-742
analysis. Agric Ecosyst Environ 135: 199-205. 743
Shannon CE & Weaver W (1963) The mathematical theory of communication. 744
University of Illinois Press, Urbana. 745
Simpson EH (1949) Measurement of diversity. Nature 163: 688. 746
Sørensen J (1997) The rizosphere as a habitat for soil microorganisms. Modern soil 747
microbiology, (van Elsas J, Trevors J, and Wellington E, eds.), pp. 21-45. Marcel
748
Dekker, New York. 749
Steinman HM, Fareed F & Weinstein L (1997) Catalase-peroxidase of Caulobacter 750
crescentus: function and role in stationary-phase survival. J Bacteriol 179: 6831-6836.
751
Suenaga H (2012) Targeted metagenomics: a high-resolution metagenomics approach 752
for specific gene clusters in complex microbial communities. Environ Microbiol 14: 13-753
22. 754
Tamames J, Abellan J, Pignatelli M, Camacho A & Moya A (2010) Environmental 755
distribution of prokaryotic taxa. BMC Microbiol 10: 85. 756
Tanahashi T, Murase J, Matsuya K, Hayashi M, Kimura M & Asakawa S (2005) 757
Bacterial communities responsible for the decomposition of rice straw compost in a 758
Japanese rice paddy field estimated by DGGE analysis of amplified 16S rDNA and 16S 759
rRNA fragments. Soil Sci Plant Nutr 51: 351-360. 760
32 Trasar-Cepeda MC, Gil-Sotres F & Guitian-Ojea F (1990) Relation between phosphorus 761
fractions and development of soils from Galicia (NW Spain). Geoderma 47: 139-150. 762
Uroz S, Buée M, Murat C, Frey-Klett P & Martin F (2010) Pyrosequencing reveals a 763
contrasted bacterial diversity between oak rhizosphere and surrounding soil. Environ 764
Microbiol Rep 2: 281-288.
765
Wang Q, Garrity GM, Tiedje JM & Cole JR (2007) Naïve bayesian classifier for rapid 766
assignment of rRNA sequences into the new bacterial taxonomy. Appl Environ Microb 767
73: 5261-5267.
768
Wang Y & Qian P-Y (2009) Conservative fragments in bacterial 16S rRNA genes and 769
primer design for 16S ribosomal DNA amplicons in metagenomic studies. PLoS ONE 4: 770
e7401. 771
Ward NL, Challacombe JF, Janssen PH et al. (2009) Three genomes from the phylum 772
Acidobacteria provide insight into the lifestyles of these microorganisms in soils. Appl
773
Environ Microb 75: 2046-2056.
774
Xuan D, Guong V, Rosling A, Alström S, Chai B & Högberg N (2012) Different crop 775
rotation systems as drivers of change in soil bacterial community structure and yield of 776
rice, Oryza sativa. Biol Fertil Soils 48: 217-225. 777
Zhang T, Shao M-F & Ye L (2012) 454 Pyrosequencing reveals bacterial diversity of 778
activated sludge from 14 sewage treatment plants. ISME J 6: 1137-1147. 779
Zinger L, Gobet A & Pommier T (2012) Two decades of describing the unseen majority 780
of aquatic microbial diversity. Mol Ecol 21: 1878-1896. 781
782 783
33
Table 1. Physicochemical properties of soils AApr,Asep, ANSsep,BApr and BSep. Values are means ± standard deviation (n=3). 784 785 786 787 788 789 790
The rice productivity was higher in paddy A than in paddy B (productivity ratio B:A = 0.63).
791
a-d, Homogeneous subsets among paddies (A
Apr,Asep, ANSsep,BApr andBSep), as determined by the Tukey test at P<0.05.
792 793
Parameter AApr ASep ANSSep BApr BSep
pH 5.97 ± 0.03 c 5.88 ± 0.02 b 5.87 ± 0.02 b 5.94 ± 0.06 b,c 5.70 ± 0.02 a
Water content (%) (g H2O /100 g wet soil) 22.4 ± 0.1 b,c 21.8 ± 0.4 b 19.2 ± 0.5 a 27.1 ± 0.8 d 23.4 ± 0.2 c
Total C (%) 1.33 ± 0.10 1.33 ± 0.13 1.38 ± 0.27 1.68 ± 0.04 1.60 ± 0.05
Total N (%) 0.14 ± 0.00 a 0.14 ± 0.00 a 0.14 ± 0.00 a 0.15 ± 0.01 a 0.18 ± 0.00 b
34
Table 2. Diversity of bacterial rRNA gene fragment sequences in soil samples AApr,Asep, ANSsep,BApr andBSep. The diversity measurements 794
(Number of OTUs, Chao1, Shannon and Simpson indices and Phylogenetic diversity) were determined at a rarefaction of 2700 sequences per 795
replica. Values are means ± standard deviation (n =3). 796
AApr ASep ANSSep BApr BSep
No. OTUs 1236 ± 12 a,b 1206 ± 41 a,b 1290 ± 45 b 1212 ± 40 a,b 1170 ± 29 a
Chao1 3150 ± 114 2967 ± 148 2967 ± 184 3060 ± 163 3010 ± 36
Shannon index 9.30 ± 0.02 b,c 9.26 ± 0.07 a,b,c 9.44 ± 0.08 c 9.25 ± 0.03 a,b 9.12 ± 0.03 a
Simpson index 0.99 ± 0.00 0.99 ± 0.00 0.99 ± 0.00 0.99 ± 0.00 0.99 ± 0.00
Phylogenetic Diversity (PD) 87.2 ± 1.2 a 89.7 ± 2.8 a 99.2 ± 4.1 b 90.5 ± 2.7 a,b 88.2 ± 1.7 a
797
a-c, different letters indicate differences in alpha diversity metrics values among the bacterial communities of the analysed samples (one-way ANOVA followed by Tukey
798
post-hoc test, P < 0.05).