Food Science and Technology
DO:
D https://doi.org/10.1590/1678-457X.17317
OSSN 0101-2061 (Print) OSSN 1678-457X (Dnline)
1 Introduction
Genipap (Genipa americana L.) belongs to Rubiacea family and Genipa genus. Ot is a native plant from America, found mainly in Central and South regions of this continent (Djerassi et al., 1960; Ramos-de-la-Peña et al., 2015b). When in its ripe stage the genipap pulp is succulent, acidic and hard which is consumed mainly as juices, jams and liqueurs (Pino et al., 2005; Prance, 2003).
The unripe genipap fruit is rich in iridoids, which are secondary metabolites usually found in many plants, normally as glycosides. Structurally, iridoids are bicyclic monoterpenes (C10), whose basic skeleton is a cyclopentane-[C]-pyran ring typically fused with a six-membered heterocycle oxygenate (Bianco, 1994; Dinda et al., 2007). Among the iridoids present in the fruit, genipin and geniposide stand out as natural sources for obtaining the blue color (Velásquez et al., 2014).
The genipin is a colorless substance, present in unripe fruits of genipap, that is able to react spontaneously in the presence of oxygen, with primary amine groups of amino acids, peptides or proteins and form blue color (Djerassi et al., 1960). The genipin is present in Genipa americana L. in the proportion of 1-3% of fruit (Ramos-de-la-Peña et al., 2014). The genipin can be obtained directly from genipap by extraction with organic solvents or after enzymatic hydrolysis of geniposide with β-glycosidases (Ramos-de-la-Peña et al., 2015a; Thomas & Farrugia, 2013).
The geniposide is often used in Asian countries as a natural colorant and very traditional in Chinese culture for its medicinal effects in treating liver and inflammatory diseases. This iridoid represents about 4 to 6% of the dry fruit (Butler et al., 2003). The chemical structure of these compounds is shown in Figure 1.
Genipap has been used since ancient times by indigenous for body painting and nowadays it appears as an alternative for obtaining blue colorants for food and chemical industries (Ferreira, 2015). Currently, natural colorants applications have been greatly increased due to the interest for replacing synthetic additives by natural compounds. On addition to providing color, these compounds have biological activity against oxidative damage, inhibition of tumor and anti-inflammatory activities of great interest for pharmaceutical industry (Buchweitz, 2016; Koo et al., 2006).
Genipin and geniposide identification and quantification in real samples are mainly made by High-Performance Liquid Chromatography (HPLC). The major disadvantage of the existing methods is related to the analysis time. Some methods take between 35 and 75 minutes (Bentes & Mercadante, 2014; Bergonzi et al., 2012; Lee et al., 2014; Li et al., 2016; Wang et al., 2016) which limits its use on genipin and geniposide production scale.
Identification and quantification of genipin and geniposide from
Genipa americana
L.
by HPLC-DAD using a fused-core column
Grazielle NÁTHOA-NEVES1, Gislaine Chystina NDGUEORA1, Renata VARDANEGA1, Maria Angela de Almeida MEORELES1*
Received 18 May, 2017 Accepted 15 Oct., 2017
1 Laboratório de Tecnologia Supercrítica Extração, Fracionamento e Identificação de Extratos Vegetais – LASEFI, Departamento de Engenharia de Alimentos – DEA, Faculdade de Engenharia de Alimentos – FEA, Universidade Estadual de Campinas – UNICAMP, Campinas, SP, Brazil
*Corresponding author: [email protected] Abstract
On this work, it was developed a fast, simple and selective method for quantification of genipin and geniposide from unripe fruits of genipap, which are known as natural colorants, blue and yellow, respectively. The compounds separation was performed in a fused-core C18 column using as mobile phase water (A) and acetonitrile (B) both acidified with 0.1% formic acid, with the following gradient: 0 min, 99% A; 9 min, 75% A; 10 min, 99% A and 13 min, 99% A. The temperature and flow rate that allowed the best chromatographic performance were 35 °C and 1.5 mL/min, respectively, resulting a total run time of 13 min, including column clean-up and re-equilibration. This short analysis time represents an advantage compared to the methods reported in the literature where the running times are 2-5 times greater. The detection wavelength was set at 240 nm. The method validation was performed based on specificity, linearity, detection and quantification limits, precision and accuracy, according to OCH methodology. Finally, the developed method was suitable for monitoring analysis of those compounds content in vegetable samples.
Keywords: blue natural colorant; method validation; iridoids.
To meet the demands for replacing synthetic by natural colorants, new methods to extract selectively these color additives have been developed. Therefore, it is interesting to develop also selective methods for the quantitation of these compounds. The aim of this study was to develop and to validate a reliable and fast HPLC method for simultaneous determination of genipin and geniposide from Genipa americana L. This method is helpful for natural colorants and pharmaceutical industries that use these iridoids in their formulations.
2 Materials and methods
2.1 Chemical and solvents
HPLC grade acetonitrile was purchased from Scharlau (Barcelona, Spain), formic acid and ethanol was obtained from Dinâmica (São Paulo, Brazil). Ultrapure water was supplied by a Milli-Q Advantage 8 Purifier System from Millipore (Bedford, USA). Genipin and geniposide standards (purity > 98%) were purchased from Sigma-Aldrich (St. Louis, USA).
2.2 Samples
The unripe genipap fruits were obtained from Sítio do Bello (Paraibuna, Brazil). The fruits were frozen with liquid nitrogen and stored in domestic freezer (-20 °C) until being processed for the extraction. The samples were prepared and extracted according to Náthia-Neves et al. (2017). The samples were extracted at 50 °C and 0.2 MPa with ethanol during 30 min. For each extraction assay 4 g of raw material and 20 g of solvent were used, resulting in a solvent to sample ratio of 5:1. After the extraction, the extracts were filtered through a 0.45 µm nylon seringe filter (Sinergia Cientifica, Campinas, Brazil) and diluted 5 times (200 µL of extract in 800 µL of solvent) to acetonitrile:water (1:1) for chromatographic analysis.
2.3 Chromatographic instrumentation
HPLC analysis was carried out on an Alliance 2695/2695D Separation Module (Waters, Milford, USA) with integrated column heater and auto-sampler and a photodiode array detector (2998, Waters, Milford, USA). Compounds separation was carried out on a fused-core C18 column (Kinetex, 100 × 4.6 mm i.d.; 2.6 µm; Phenomenex, Torrance, USA). The kinetic dead volume (Vm) of
the column was 740 ± 5 µL and the extra-column volume was 62.5 ± 0.1 µL, as described in a previous study (Dsorio-Tobón et al., 2016). The HPLC system dwell volume was described by the manufacturer as < 650 µL.
Chromatographic conditions development
The mesocarp ethanolic extract from genipap was the sample employed in all the chromatographic tests for the quantification of iridoids genipin and geniposide. The chromatographic conditions tested were the mobile phase composition consisted of water (acidified or not with formic acid 0.1% v/v, solvent A) and acetonitrile (acidified or not with formic acid 0.1%, v/v, solvent B), temperatures (30, 35 and 40 °C), flow rates
(0.5, 1.0 and 1.5 mL/min) and equilibration times (1-5 min). UV spectra was monitored between 200 and 600 nm and the peaks of the iridoids were integrated at 240 nm.
Method validation
The method was validated according to OCH guidelines based on specificity, linearity and range, limits of detection and quantification, precision and accuracy (Onternational Council for Harmonisation, 2005), with some adaptations to food material.
Specificity
The identification of iridoids present in the sample was achieved by the comparison of retention times and UV spectra of separated compounds with the authentic standard. Column efficiency was evaluated on basis of retention time, width, K prime, selectivity, symmetry factor, width at baseline and resolution of the peaks of iridoids geniposide and genipin. All performance parameters were calculated using the US Pharmacopeia (USP) option by the Empower 3 software.
Linearity and range
The stock solution of genipin standard was prepared by dissolving 25 mg of genipin in 10 mL of acetonitrile:water (1:1). The stock solution of geniposide standard was prepared by dissolving 10 mg of geniposide in 10 mL of acetonitrile:water (1:1). The curve of each iridoids was prepared in triplicate by plotting the concentration (0.1-1000 µg/mL for geniposide and 0.1-2500 µg/mL for genipin) against area of the peak. Regression equations and correlation coefficient (r2) were calculated using
DriginPro® v. 9.0 software.
Limits of detection and quantitation
The limit of detection (LoD) and limit of quantitation (LoQ) were determined by calculation of the signal-to-noise ratio. A signal-to-noise ratio of 3:1 was considered for estimating the LoD and the signal-to-noise ratio of 10:1 corresponded to the LoQ.
Precision and accuracy
The repeatability and intermediate precision of the developed method were evaluated in terms of peak area and retention time of the iridoids. A total of 30 HPLC analyses were performed
on three successive days (10 analyses per day) using the same sample, a mesocarp ethanolic extract from genipap.
The accuracy of the method was tested by the spiking/recovery technique. Firstly, three independent solutions of extract were prepared with the following iridoid concentrations: 28.65, 64.21 and 124.40 µg/mL. 200 µL of each solution were spiked with 3.86 µg of geniposide and 3.13 µg of genipin by adding 70 µL of each standard solution containing 55.15 µg/mL and 44.70 µg/mL of geniposide and genipin, respectively and each one was injected three times. The average percentage recovery was calculated for each level of concentration.
3 Results and discussion
3.1 Optimization of chromatographic conditions
The better overall peaks separation and resolution were obtained with the solvents acidified with formic acid. The reduction of pH of the mobile phase is commonly used for the separation of iridoids (Bentes & Mercadante, 2014; Bergonzi et al., 2012) as well as other bioactive compounds, such as curcurminoids (Dsorio-Tobón et al., 2016), beta-ecdysone (Rostagno et al., 2014) and bixin (Chisté et al., 2011), among others.
The column temperature selected was 35 °C because a better resolution and reproducibility were obtained and it was below the maximum column operating temperature of 60 °C. The increase of temperature slightly decreased the retention time of iridoids. On the literature, temperatures between 25 and 30 °C were used for iridoids separation (Bentes & Mercadante, 2014; Bergonzi et al., 2012; Wang et al., 2016).
The mobile phase flow rate was increased step-by-step from 0.5 to 1.5 mL/min. Maintaining the temperature column at 35 °C, the retention time decreased 40% for the iridoids by increasing the flow rate. The separation of the iridoids was achieved in approximately 9 minutes, which is a short time for the separation
of the compounds. Re-equilibration time is necessary in gradient HPLC to ensure that the column environment has returned to the initial stable conditions. These conditions are particularly important when using gradient elution because the difference between the initial and final organic composition of the mobile phase is significant (Zabot et al., 2014). Ot was necessary 4 min between runs to clean-up and return to the initial conditions of the method. The re-equilibration time represent 31% of the total run time, which was 13 minutes (including elution, clean-up and re-equilibration) and is equivalent to 9.4 volumes of the column.
3.2 Characteristics of the HPLC method
The optimized conditions of the chromatographic method consisted of the following gradient: 0 min, 99% A; 9 min, 75% A; 10 min, 99% A and 13 min, 99% A. The column was maintained at 35 °C, working with a flow rate of 1.5 mL/min and a re-equilibration time of 4 minutes. Representative chromatograms of the ethanolic extract of genipap and the iridoids standards are shown in Figure 2. Genipin and geniposide were identified through the retention times and maximum absorption wavelength.
The retention times of geniposide and genipin were 5.73 and 6.65, respectively. The elution order was the same observed by other authors (Bentes & Mercadante, 2014; Wang et al., 2016). However, duration of the methods reported in the literature is much longer (up to 75 min) when compared to the obtained in this study (13 min). Resolution, width of peaks, selectivity, symmetry factor and K prime were calculated by Empower 3 software and were for geniposide 1.62, 15.37, 1.05, 0.90 and 1.30; for genipin were 1.74, 15.37, 1.05; 0.91 and 1.67, respectively. These results indicate the good chromatographic method developed for the separation of iridoids because the resolution for the both compounds was higher than 1.5 and the symmetry factor was 0.90. The parameters mentioned above were not found in the methods reported in the literature.
3.3 Method validation
Linearity and range
Linearity was determined for geniposide and genipin on eleven and ten levels of concentration, respectively. Geniposide showed a linear response from 0.41-1000 µg/mL and genipin showed a linear response from 0.41-625 µg/mL. All curves presented coefficients of linear correlation higher than 0.9998. Geniposide linearity found in the methods reported in the literature was between 1.0 and 1000 µg/mL (Bergonzi et al., 2012; Liu et al., 2011; Sheu & Hsin, 1998; Wu et al., 2014) and genipin linearity was between 0.5 and 100 µg/mL (Bentes & Mercadante, 2014; Wu et al., 2014).
Limit of detection and quantification
Geniposide and genipin at a concentration of 0.41 µg/mL presented a signal-to-noise ratio higher than 3:1, which were assumed as the limit of detection (LoD) for the both compounds. Geniposide at 6.5 µg/mL and genipin at 1.63 µg/mL presented a signal-to-noise ratio higher than 10:1, representing the limit of quantification (LoQ). The genipin limits were similar to reported by Bentes & Mercadante (2014), while the geniposide limits were approximately 10 times higher than the reported in the literature (Bergonzi et al., 2012; Liu et al., 2011; Wu et al., 2014).
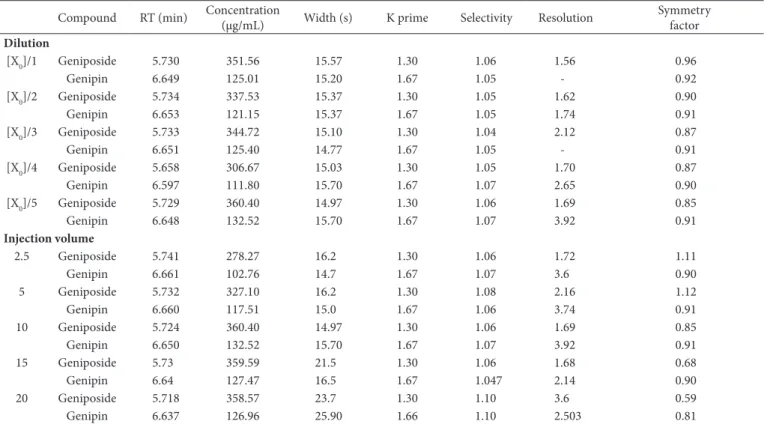
Robustness
Table 1 shows the robustness results for the developed method concerning sample concentration/dilution and injection volume, respectively. The chromatographic performance was slightly affected by the sample concentration and injected volume. These results are related to the high performance of the fused-column
used in this study because columns with this technology can operate with low amount of sample due to an increased diffusion of the sample in the solvent (Dsorio-Tobón et al., 2016).
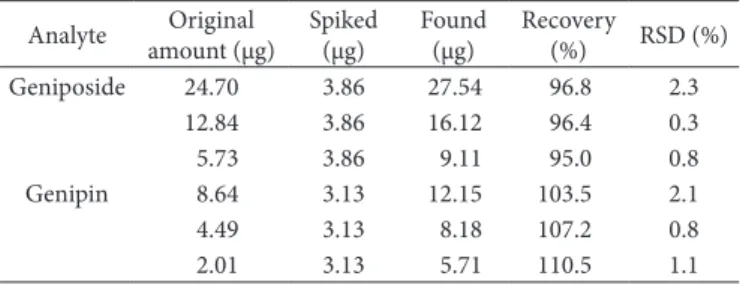
Precision and accuracy
The intraday and interday precision were evaluated in terms of retention time and peak area by injecting the sample 10 times within a day and by duplicating the experiment once a day during three consecutive days. The relative standard deviation (RSD) was lower than 0.04% for retention time and lower than 0.67% for peak area for the intraday precision. For interday precision the RSD was lower than 0.03% and 3.05% for retention time and peak area, respectively.
The accuracy of the developed method was determined by analyzing the percentage recovery of the both iridoids into different concentration levels of the genipap extract. As shown in Table 2, the geniposide recovery ranged between 95.0 and 96.8%, while the genipin recovery ranged between 103.5 and 110.5%.
Specificity
No deviations were observed in the geniposide and genipin UV-spectra at the beginning, at the apex and at the end of peaks of each constituent obtained from the genipap extract sample (Figure 3), demonstrating the purity of the peaks.
3.4 Application to real samples
To evaluate the performance of the chromatographic method, these iridoids were quantified in ethanolic extracts obtained from different parts of the genipap fruit. Figure 4 shows the chromatograms of the ethanolic extracts obtained for five different
Table 1. Effect of sample concentration and injection volume on the chromatographic performance.
Compound RT (min) Concentration
(µg/mL) Width (s) K prime Selectivity Resolution
Symmetry factor
Dilution
[X0]/1 Geniposide 5.730 351.56 15.57 1.30 1.06 1.56 0.96
Genipin 6.649 125.01 15.20 1.67 1.05 - 0.92
[X0]/2 Geniposide 5.734 337.53 15.37 1.30 1.05 1.62 0.90
Genipin 6.653 121.15 15.37 1.67 1.05 1.74 0.91
[X0]/3 Geniposide 5.733 344.72 15.10 1.30 1.04 2.12 0.87
Genipin 6.651 125.40 14.77 1.67 1.05 - 0.91
[X0]/4 Geniposide 5.658 306.67 15.03 1.30 1.05 1.70 0.87
Genipin 6.597 111.80 15.70 1.67 1.07 2.65 0.90
[X0]/5 Geniposide 5.729 360.40 14.97 1.30 1.06 1.69 0.85
Genipin 6.648 132.52 15.70 1.67 1.07 3.92 0.91
Injection volume
2.5 Geniposide 5.741 278.27 16.2 1.30 1.06 1.72 1.11
Genipin 6.661 102.76 14.7 1.67 1.07 3.6 0.90
5 Geniposide 5.732 327.10 16.2 1.30 1.08 2.16 1.12
Genipin 6.660 117.51 15.0 1.67 1.06 3.74 0.91
10 Geniposide 5.724 360.40 14.97 1.30 1.06 1.69 0.85
Genipin 6.650 132.52 15.70 1.67 1.07 3.92 0.91
15 Geniposide 5.73 359.59 21.5 1.30 1.06 1.68 0.68
Genipin 6.64 127.47 16.5 1.67 1.047 2.14 0.90
20 Geniposide 5.718 358.57 23.7 1.30 1.10 3.6 0.59
Figure 3. Dverlay of three UV-spectra (240 nm) at the beginning, at the apex and at the end of the peaks of geniposide at 5.73 min and genipin at 6.65 min.
(166060/2015-1 and 152148/2016-7). M.A.A. Meireles thanks CNPq for the productivity grant (302423/2015-0).
References
Bentes, A. S., & Mercadante, A. Z. (2014). Onfluence of the stage of ripeness on the composition of iridoids and phenolic compounds in genipap (Genipa americana L.). Journal of Agricultural and Food
Chemistry, 62(44), 10800-10808. PMid:25323434. http://dx.doi.
org/10.1021/jf503378k.
Bergonzi, M. C., Righeschi, C., Osacchi, B., & Bilia, A. R. (2012). Odentification and quantification of constituents of Gardenia
jasminoides Ellis (Zhizi) by HPLC-DAD-ESO-MS. Food Chemistry,
134(2), 1199-1204. PMid:23107748. http://dx.doi.org/10.1016/j. foodchem.2012.02.157.
Bianco, A. (1994). Recent developments in iridoids chemistry. Pure and
Applied Chemistry, 66(10-11), 2335-2338. http://dx.doi.org/10.1351/
pac199466102335.
Buchweitz, M. (2016). Natural solutions for blue colors in food. On R. Carle & R. Schweiggert (Eds.), Handbook on natural pigments in food and beverages: industrial applications for improving food color
(355 p.). Cambridge: Elsevier.
Butler, M. F., Ng, Y.-F., & Pudney, P. D. A. (2003). Mechanism and kinetics of the crosslinking reaction between biopolymers containing primary amine groups and genipin. Journal of Polymer Science. Part
A, Polymer Chemistry, 41(24), 3941-3953. http://dx.doi.org/10.1002/
pola.10960.
Chisté, R. C., Yamashita, F., Gozzo, F. C., & Mercadante, A. Z. (2011). Simultaneous extraction and analysis by high performance liquid chromatography coupled to diode array and mass spectrometric detectors of bixin and phenolic compounds from annatto seeds.
Journal of Chromatography A, 1218(1), 57-63. PMid:21111424.
http://dx.doi.org/10.1016/j.chroma.2010.10.094.
Dinda, B., Debnath, S., & Harigaya, Y. (2007). Naturally occurring iridoids: a review, Part 1. Chemical & Pharmaceutical Bulletin, 55(2), 159-222. PMid:17268091. http://dx.doi.org/10.1248/cpb.55.159. Djerassi, C., Gray, J. D., & Kincl, F. A. (1960). Naturally occurring
oxygen heterocyclics. OX.1 Osolation and characterization of genipin2.
The Journal of Organic Chemistry, 25(12), 2174-2177. http://dx.doi.
org/10.1021/jo01082a022.
Ferreira, M. K. L. (2015). Ontroduction. On M. K. L. Ferreira, Mapping time, space and the body: indigenous knowledge and mathematical
thinking in Brazil (pp. 1-28). Rotterdam: SensePublishers.
Onternational Council for Harmonisation – OCH. (2005). Harmonised tripartite guideline: validation of analytical procedures: text and methodology Q2 (R1). On International Conference on Harmonization of Technical Requirements for the Registration of Pharmaceuticals for
Human Use (pp. 13). Geneva: OCH.
Koo, H. J., Lim, K. H., Jung, H. J., & Park, E. H. (2006). Anti-inflammatory evaluation of gardenia extract, geniposide and genipin. Journal of
Ethnopharmacology, 103(3), 496-500. PMid:16169698. http://dx.doi.
org/10.1016/j.jep.2005.08.011.
Lee, E. J., Hong, J. K., & Whang, W. K. (2014). Simultaneous determination of bioactive marker compounds from Gardeniae fructus by high performance liquid chromatography. Archives of Pharmacal Research, 37(8), 992-1000. PMid:24277694. http://dx.doi.org/10.1007/s12272-013-0293-1.
Li, J., Xu, B., Zhang, Y., Dai, S., Sun, F., Shi, X., & Qiao, Y. (2016). Determination of geniposide in Gardenia jasminoides Ellis fruit by near-infrared spectroscopy and chemometrics. Analytical Letters, 49(13), 2063-2076. http://dx.doi.org/10.1080/00032719.2015.1130714.
parts (endocarp + seeds, endocarp, seeds, mesocarp and peel) of the genipap fruit. The concentration of iridoids recovered from each part of the fruit is shown in Table 3. The iridoids profiles observed in Figure 4 were not directly proportional because the samples needed to be differently diluted in order to achieve the linear range for both compounds. Geniposide was mainly found in mesocarp (58.7 mg/g) and peel (40.25 mg/g) of the fruit, whereas significant amount of genipin was observed in all parts of the fruit except for seeds, which showed a content of 1.17 mg/g. Regarding the total iridoids recovery, the seeds also presented the lowest value (1.23 mg/g), while the mesocarp showed the highest (79.35 mg/g). This result corroborates the literature that reports the mesocarp as the main source of geniposide and the endocarp as the main source of genipin (Bentes & Mercadante, 2014). The results indicated that the proposed method was successfully applied to quantitatively analyze the main iridoids of the genipap fruit.
4 Conclusions
The two major iridoids from genipap fruit were accurately separated and quantified in a short time of 13 min of analysis. The method showed an excellent performance regarding the simplicity, precision, accuracy and robustness. The validated data showed a good performance for the different dilutions and injection volumes tested and also presented low deviation in terms of intermediate precision. This method has a great potential to be used by the industry for analysis of genipin and geniposide.
Acknowledgements
The authors are grateful to Sao Paulo Research Foundation (FAPESP 2015/13299-0) for financial support. G. Náthia-Neves thanks Coordination for the Omprovement for the Higher Education Personnel (CAPES) for a Ph.D. assistantship. G.C. Nogueira and R. Vardanega thank National Council for Scientific and Technological Development (CNPq) for the P.D. assistantship
Table 3. Concentration of iridoids (mg/g of raw material) in different unripe genipap fruit parts.
Geniposide Genipin Total Oridoids
Endocarp + seeds 0.12 23.07 23.19
Endocarp 0.08 38.96 39.04
Seeds 0.06 1.17 1.23
Mesocarp 58.70 20.65 79.35
Peel 40.25 7.51 47.76
RSD: Relative standard deviation.
Table 2. Recovery of iridoids.
Analyte Driginal amount (µg) Spiked (µg) Found (µg) Recovery
(%) RSD (%)
Geniposide 24.70 3.86 27.54 96.8 2.3
12.84 3.86 16.12 96.4 0.3
5.73 3.86 9.11 95.0 0.8
Genipin 8.64 3.13 12.15 103.5 2.1
4.49 3.13 8.18 107.2 0.8
2.01 3.13 5.71 110.5 1.1
impact non-uniformity in genipin recovery by high pressure processing. Food Chemistry, 187, 444-450. PMid:25977049. http:// dx.doi.org/10.1016/j.foodchem.2015.04.114.
Rostagno, M. A., Debien, O. C. N., Vardanega, R., Nogueira, G. C., Barbero, G. F., & Meireles, M. A. A. (2014). Fast analysis of beta-ecdysone in Brazilian ginseng (Pfaffia glomerata) extracts by high-performance liquid chromatography using a fused-core column. Analytical
Methods, 6(8), 2452-2459. http://dx.doi.org/10.1039/C3AY42276C.
Sheu, S. J., & Hsin, W. C. (1998). Odentification and determination of the major constituents in traditional Chinese medicine Longdan Xiegan Pill by HPLC-DAD-ESO-MS. Journal of Separation Science, 21(9), 523-526.
Thomas, P., & Farrugia, K. (2013). An investigation into the enhancement of fingermarks in blood on paper with genipin and lawsone. Science
& Justice, 53(3), 315-320. PMid:23937940. http://dx.doi.org/10.1016/j.
scijus.2013.04.006.
Velásquez, C. L., Rivas, A., & Dcanto, O. S. (2014). Dbtención de Genipina a partir de frutos de caruto (Genipa americana L.) del llano venezolano. Avances en Química, 9(2), 75-86.
Wang, L., Liu, S., Zhang, X., Xing, J., Liu, Z., & Song, F. (2016). A strategy for identification and structural characterization of compounds from Gardenia jasminoides by integrating macroporous resin column chromatography and liquid chromatography-tandem mass spectrometry combined with ion-mobility spectrometry. Journal
of Chromatography. A, 1452, 47-57. PMid:27208986. http://dx.doi.
org/10.1016/j.chroma.2016.05.026.
Wu, X., Zhou, Y., Yin, F., Mao, C., Li, L., Cai, B., & Lu, T. (2014). Quality control and producing areas differentiation of Gardeniae Fructus for eight bioactive constituents by HPLC–DAD–ESO/MS.
Phytomedicine, 21(4), 551-559. PMid:24183952. http://dx.doi.
org/10.1016/j.phymed.2013.10.002.
Zabot, G. L., Moraes, M. N., Rostagno, M. A., & Meireles, M. A. A. (2014). Fast analysis of phenolic terpenes by high-performance liquid chromatography using a fused-core column. Analytical Methods, 6(18), 7457-7468. http://dx.doi.org/10.1039/C4AY01124D. Liu, H., Su, J., Liang, X., Zhang, X., He, Y.-J., Huang, H.-Q., Ye, J., &
Zhang, W.-D. (2011). Odentification and determination of the major constituents in traditional Chinese medicine Longdan Xiegan Pill by HPLC-DAD-ESO-MS. Journal of Pharmaceutical Analysis, 1(1), 1-7. http://dx.doi.org/10.1016/S2095-1779(11)70001-6.
Náthia-Neves, G., Tarone, A. G., Tosi, M. M., Maróstica Júnior, M. R., & Meireles, M. A. A. (2017). Extraction of bioactive compounds from genipap (Genipa americana L.) by pressurized ethanol: Oridoids, phenolic content and antioxidant activity. Food Research
International, 102, 595-604. PMid:29195990. http://dx.doi.org/10.1016/j.
foodres.2017.09.041.
Dsorio-Tobón, J. F., Carvalho, P. O. N., Barbero, G. F., Nogueira, G. C., Rostagno, M. A., & Meireles, M. A. A. (2016). Fast analysis of curcuminoids from turmeric (Curcuma longa L.) by high-performance liquid chromatography using a fused-core column.
Food Chemistry, 200, 167-174. PMid:26830575. http://dx.doi.
org/10.1016/j.foodchem.2016.01.021.
Pino, J., Marbot, R., & Vazquez, C. (2005). Volatile constituents of genipap (Genipa americana L.) fruit from Cuba. Flavour and
Fragrance Journal, 20(6), 583-586. http://dx.doi.org/10.1002/ffj.1491.
Prance, G. T. (2003). Fruits of tropical climates: fruits of Central and South America. On B. Caballero (Ed.), Encyclopedia of food sciences
and nutrition (2nd ed., pp. 2810-2816). Dxford: Academic Press.
Ramos-de-la-Peña, A. M., Renard, C. M., Wicker, L., Montanez, J. C., Garcia-Cerda, L. A., & Contreras-Esquivel, J. C. (2014). Environmental friendly cold-mechanical/sonic enzymatic assisted extraction of genipin from genipap (Genipa americana). Ultrasonics
Sonochemistry, 21(1), 43-49. PMid:23871416. http://dx.doi.
org/10.1016/j.ultsonch.2013.06.008.
Ramos-de-la-Peña, A. M., Renard, C. M. G. C., Montañez, J. C., Reyes-Vega, M. L., & Contreras-Esquivel, J. C. (2015a). Ultrafiltration for genipin recovery technologies after ultrasonic treatment of genipap fruit. Biocatalysis and Agricultural Biotechnology, 4(1), 11-16. http:// dx.doi.org/10.1016/j.bcab.2014.09.009.