ISSN: 1809-4430 (on-line)
_________________________
1 Grupo de Pesquisa em Ciências Agro-Ambientais, Universidade Estadual do Oeste do Paraná/ Cascavel - PR, Brasil.
CORN FERTILIZATION USING SWINE WASTEWATER AND SOIL-WATER ENVIRONMENTAL QUALITY
Doi:http://dx.doi.org/10.1590/1809-4430-Eng.Agric.v37n4p801-810/2017
DANIELLE M. ROSA1, SILVIO C. SAMPAIO2*, PÂMELA A. M. PEREIRA3,
RALPHO R. DOS REIS1, MARIANA SBIZZARO1
2*Corresponding author. Grupo de Pesquisa em Ciências Agro-Ambientais, Universidade Estadual do Oeste do Paraná/
Cascavel - PR, Brasil. E-mail: [email protected]
ABSTRACT: Soil application of swine wastewater for nutrient cycling may represent a correct destination of these residues and reduction in production costs. However, when applied to soil, such residue may cause environmental impacts. This study aimed to analyze the chemical characteristics of the soil, corn, and leachate after successive swine wastewater applications associated with mineral fertilization. The experiment was developed in drainage lysimeters under field conditions. Wastewater doses applied were 0, 100, 200, and 300 m3 ha−1 with and without mineral fertilization.
The results were submitted to analysis of variance and Tukey’s test. After nine years of application, a special attention should be taken regarding water quality from a dose of 200 m3 ha−1 since some
elements may leach into the soil. In addition, a synchronism between residue application and crop requirements needs to be taken into account. Doses of 200 and 300 m3 ha−1 are considered as
satisfactory to meet corn nutritional requirements. Moreover, an increase in fertility characteristics was observed, but a caution regarding Cu and Zn contents should be taken since these elements produce a cumulative effect in the soil.
KEYWORDS: liquid residue of swine, no-tillage, water reuse.
INTRODUCTION
Favorable regions for hog raising require in loco scientific studies on the environmental impact inherent to this activity since residue application in corn crop is common. Hog raising and corn production are practically inseparable in these regions from the economic point of view. In this case, a great availability of swine residues used as fertilizer is found in these farms, increasing soil contents of nitrogen, organic matter, exchangeable Ca, K, and Mg due to pH increase (Lourenzi et al., 2014 a), and inorganic phosphorus (Ceretta et al., 2010; Lourenzi et al., 2014a,b). However, the nutrient concentration may exceed the assimilation capacity of soil and plant when not absorbed by the soil-plant system at the same rate at which they are applied, becoming contaminants and causing environmental impacts.
In this sense, continuous application of swine wastewater in the soil, without considering the soil support capacity, may cause soil contamination, mainly by Cu and Zn (Lucas et al., 2013), which can reduce growth and yield of crops in long term, in addition to impacts caused to water bodies by nitrate leaching and entrainment of nitrogen and phosphorus. This implies the need to monitor soil and water quality in order to guarantee the benefits of the use of swine residues in improving soil quality.
Maggi et al., 2011) and entrainment of ions (Wang et al., 2013), ammonia volatilization, and nitrous oxide emission (Gonzatto et al., 2013).
However, most of the studies related to swine wastewater application are carried out in short term. The experimental area used in this study has a nine-year history of experimentation, which induces to treatment stability and data reliability. In this sense, this study focused on determining the interference of successive applications of swine wastewater, mineral fertilization, and their association with soil, plant, and leachate chemical characteristics after a nine-year period of experimentation.
MATERIAL AND METHODS
Location, characterization, and history of the experimental area
The experimental area was located at the geographical coordinates 24°48′ S and 53°26′ W, with an altitude of 760 m. Regional climate is classified as subtropical humid (Cfa), with an average annual precipitation of 1800 mm, warm summers, infrequent frosts, a tendency of rainfall concentration in summer months, and no defined dry season. The municipality presents an average temperature of 20 °C and average air relative humidity of 75%. Figure 1 shows the meteorological data of precipitation and average temperature, in addition to cultural practices carried out during corn cultivation cycle.
FIGURE 1. Monthly precipitation (mm) and average temperature (°C) in 2014 obtained at the SIMEPAR Meteorological Station.
The soil of the experimental area was classified as an Oxisol (Haplorthox). In the area, 24 drainage lysimeters were distributed in three lines, spaced 0.4 m vertically and 0.6 m horizontal (longitudinal and transversal). Each drainage lysimeter presented a volume of 1 m3 and an area of
1.60 m2 (depth of 0.91 m and diameter of 1.43 m) and composed an experimental plot. Swine wastewater application
Swine wastewater (SW) used was collected on a rural property that has an integrated biosystem of manure treatment. The collection was carried out in the channel prior to wastewater entrance in the biodigester. SW was applied manually and evenly distributed throughout the lysimeter area. Table 1 shows the data of SW characterization.
Leachate collection
SW application
and corn sowing
Corn harvest and soil sampling
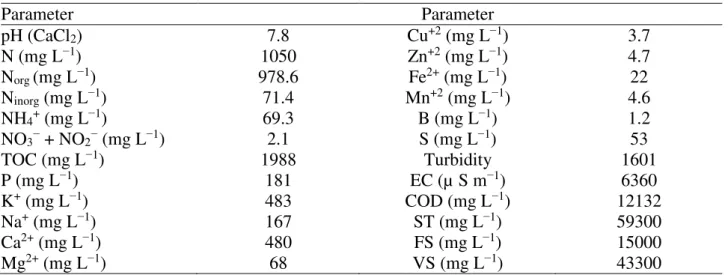
TABLE 1. Swine wastewater characterization.
Parameter Parameter
pH (CaCl2) 7.8 Cu+2 (mg L−1) 3.7
N (mg L−1) 1050 Zn+2 (mg L−1) 4.7
Norg (mg L−1) 978.6 Fe2+ (mg L−1) 22
Ninorg (mg L−1) 71.4 Mn+2 (mg L−1) 4.6
NH4+ (mg L−1) 69.3 B (mg L−1) 1.2
NO3− + NO2− (mg L−1) 2.1 S (mg L−1) 53
TOC (mg L−1) 1988 Turbidity 1601
P (mg L−1) 181 EC (µ S m−1) 6360
K+ (mg L−1) 483 COD (mg L−1) 12132
Na+ (mg L−1) 167 ST (mg L−1) 59300
Ca2+ (mg L−1) 480 FS (mg L−1) 15000
Mg2+ (mg L−1) 68 VS (mg L−1) 43300
TOC – Total organic carbon; EC – Electric conductivity; COD – Chemical oxygen demand; TS – Total solids; SF – Fixed solids; VS
– Volatile solids.
Description of treatments
The adopted option was to continue with the doses applied in the experimental area in order to form a history since 2006. Thus, the established SW doses were 0, 100, 200, 300 m3 ha−1 based on
nitrogen content, as defined by Prior et al. (2009). In the first years of use of the experimental area, SW received a treatment with biodigester and stabilization ponds (Prior et al., 2009; Maggi et al., 2011; Smanhotto et al., 2013). Subsequently, SW received a biodigester treatment (Kessler et al., 2013a; Kessler et al., 2013b; Castaldelli et al., 2015; Lucas et al., 2013). In this study, SW was used without treatment since previous studies indicate the possibility of using crude SW.
In addition to the doses of SW application, the effect of mineral fertilization (MF) was assessed on sowing. Therefore, the treatments applied to plots in this experiment consisted of four SW doses associated or not with MF, totaling eight treatments. Treatment 1 (0SW–A) was called environmental control and received no SW and MF. Treatment 2 (0SW–P) was denominated as an agronomic control because it received MF at the recommended dose for the cultivar but no SW. Treatment 3 (100SW–A) received an SW dose of 100 m3 ha−1 but no MF. Treatment 4 (100SW–P)
received an SW dose of 100 m3 ha−1 and MF. Treatment 5 (200SW–A) received an SW dose of 200
m3 ha−1 but no MF. Treatment 6 (200SW–P) received an SW dose of 200 m3 ha−1 and MF.
Treatment 7 (300SW–A) received an SW dose of 300 m3 ha−1 but no MF. Treatment 8 (300SW–P)
received an SW dose of 300 m3 ha−1 and MF.
Implantation of commercial corn cultivation
TABLE 2. Total nutrients (kg ha−1) applied through mineral fertilization and swine wastewater, per
treatment, in the previous 18 production cycles, and in the current cycle (19th). Previous cycles
Mineral fertilization (kg ha−1) Swine wastewater (kg ha−1)
N P K N P K Cu Zn
0SW–A 0 0 0 0 0 0 0 0
0SW–P 937.5 850 825 0 0 0 0 0
100SW–A 0 0 0 827.6 185.9 493.8 80.2 44.5
100SW–P 937.5 850 825 820.1 185.9 493.8 80.2 44.5
200SW–A 0 0 0 1667.2 371.5 985.6 160.4 89
200SW–P 937.5 850 825 1659.7 371.5 985.6 160.4 89
300SW–A 0 0 0 2509.8 446.9 1449.4 240.6 133.4
300SW–P 937.5 850 825 2502.3 556.9 1449.4 240.6 133.4
Current cycle (19th)
Mineral fertilization (kg ha−1) Swine wastewater (kg ha−1)
N P K N P K Cu Zn
0SW–A 0 0 0 0 0 0 0 0
0SW–P 120 80 90 0 0 0 0 0
100SW–A 0 0 0 97.8 18.1 48.3 0.37 0.47
100SW–P 120 80 90 97.8 18.1 48.3 0.37 0.47
200SW–A 0 0 0 195.7 36.2 96.6 0.74 0.94
200SW–P 120 80 90 195.7 36.2 96.6 0.74 0.94
300SW–A 0 0 0 293.5 54.3 144.9 1.11 1.41
300SW–P 120 80 90 293.5 54.3 144.9 1.11 1.41
Assessed parameters
Soil samples were collected from each plot (lysimeter) at a depth of 0–20 cm for determining pH, OM, P (Mehlich), K+, Ca+2, Mg+2, CEC, Cu+2, Zn+2, Na+, EC, total N, inorganic N, organic N,
NO3−, and NH4+ according to the methodologies described by Raij (2011). Soil used in the
experiment presented 5.90% of sand, 14.62% of silt, and 79.48% of clay.
Leaf analyses of macro and micronutrients were performed at all plots in order to assess the crop nutrition: P, N, K+, Ca2+, Mg2+, S, Fe, Na+, Cu2+, B, Zn2+, and Mn.
Leachate samples were collected from each plot (lysimeter) after SW application, without considering the first precipitation. Samples were stored in plastic bottles under refrigeration for the analyses of pH, electrical conductivity, total N, NO3−, NO2−, P, Cu, Zn+2, Ca+2, Mg2+, and K+.
Experimental design and statistical analysis
The experimental design was a randomized complete block design in a 4 × 2 factorial scheme with three replications. Four SW doses (0, 100, 200, and 300 m3 ha−1 in the cycle) and two MF
levels (absence and presence at sowing time) were used. Before performing the analysis of variance, a descriptive analysis of the data and verification of normality of errors were carried out. In the parameters with no normal distribution of errors, a data transformation was performed. When significant effects of treatment were found, the Tukey’s test (p<0.05) was performed in order to compare the means and, in some cases, regression.
RESULTS AND DISCUSSION Soil
The means of pH (6.41 to 7.15), OM (25.6 to 28.8 g dm−3), S (5.5 to 16.8 mg dm−3), Al (0 to
0.8 mmolc dm−3), H+Al (5.1 to 35.5 mmolc dm−3), Ca2+ (53.5 to 58.6 mmolc dm−3), Mg2+ (26.3 to
31.8 mmolc dm−3), SB (83.3 to 92.3 mmolc dm−3), BS (72.5 to 94.8%), Mn (81.1 to 91.7 mg dm−3),
Fe (19, 1 to 26.6 mg dm−3), NH
4+ (3.0 to 4.2), NO3−+NO2− (5.3 to 7.7), Norg (1135 to 1529), and
Ninorg (8.4 to 10.9) presented no statistical difference. No interaction was observed between swine wastewater (SW) and mineral fertilization (MF). Thus, the isolated factors are discussed.
SW used in the experiment influenced all significant factors studied (Table 3); in addition, there was a progressive increase according to SW doses, except for Na.
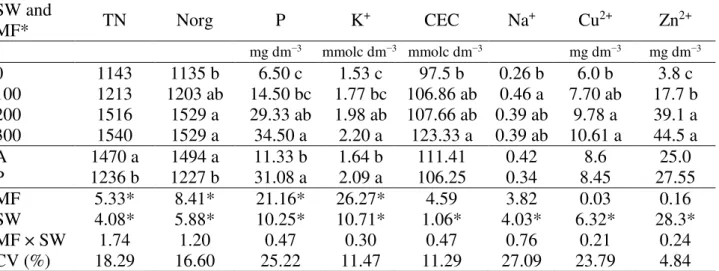
TABLE 3. Chemical characteristics of soil submitted to application of swine wastewater and mineral fertilization in the 19th crop cycle.
Data presenting non-normality were transformed into . *Means followed by different letters differ statistically from each other by the Tukey’s test. A: Absence of MF; P: Presence of MF; *: Significant at 5%; CV: Coefficient of variation.
The increase in N content, both total and organic, when SW was applied is expressive, especially for corn crops, as this element is the most required. This element is found in a high concentration in SW (Table 1). However, N content added is almost entirely organic (about 99%) and its release for plant absorption is slow and occurs during crop development.
The P content in 0WS plots was considered very low, in 100SW and 200SW was low, and in 300SW was medium (Raij, 2011). Successive applications of swine wastewater increase P accumulation in the predominantly labile fractions of soil, which are available for plants (Ceretta et al., 2010). In this case, P increased 2.2, 4.5, and 5.3 times at the doses 100SW, 200SW, and 300SW, respectively, when compared to the treatment 0ARS. The relevance of this increase is important for commercial crop production since P is an element of low availability in these regions, proving this nutrient addition via SW application. However, attention should be taken regarding the transfer of this nutrient in the form drained because it represents a potential risk of water contamination (eutrophication).
The content of K+ increased as a function of SW doses. According to Raij (2011), we may
classify as low K+ values in 0SW plots and medium in the other ones. As seen in Table 1, SW is
rich in K+, which is readily available to plants but being partly leached (Table 5).
A higher content of P and K was observed in the presence of MF. This is justified by the presence of these elements in the fertilizer formulation, an NPK-based fertilizer. The content of total and organic N was higher in MF absence probably because in the presence of fertilizer a SW and
MF* TN Norg P K+ CEC Na+ Cu2+ Zn2+
mg dm−3 mmolc dm−3 mmolc dm−3 mg dm−3 mg dm−3
0 1143 1135 b 6.50 c 1.53 c 97.5 b 0.26 b 6.0 b 3.8 c
100 1213 1203 ab 14.50 bc 1.77 bc 106.86 ab 0.46 a 7.70 ab 17.7 b
200 1516 1529 a 29.33 ab 1.98 ab 107.66 ab 0.39 ab 9.78 a 39.1 a
300 1540 1529 a 34.50 a 2.20 a 123.33 a 0.39 ab 10.61 a 44.5 a
A 1470 a 1494 a 11.33 b 1.64 b 111.41 0.42 8.6 25.0
P 1236 b 1227 b 31.08 a 2.09 a 106.25 0.34 8.45 27.55
MF 5.33* 8.41* 21.16* 26.27* 4.59 3.82 0.03 0.16
SW 4.08* 5.88* 10.25* 10.71* 1.06* 4.03* 6.32* 28.3*
MF × SW 1.74 1.20 0.47 0.30 0.47 0.76 0.21 0.24
An increase in soil cation exchange capacity (CEC) was observed with SW application, which indicates that this soil has a good capacity to retain cations in an exchangeable form. This increase is related to the addition of organic matter via SW.
The content of Na+ was higher in the dose 100SW and no progressive increase was observed
possibly due to K+ saturation, which occupies the same adsorption site. However, despite the low
salinity (Table 1), successive SW applications may cause soil salinization, which is a limiting factor for this kind of application. This ion has a strong adsorption to colloids, which can lead to soil sodification. However, this problem was unnoticed because the highest concentration found (exchangeable sodium percentage, ESP = 0.49%) was lower than the limit for characterizing a sodic soil (ESP > 7%). In addition, the region presents a good precipitation, intense agriculture, and deep soils, such conditions make this process uncommon.
The contents of Cu2+ and Zn2+ increased as a function of SW doses (Table 3). However, all
observed values exceeded the maximum limits of 0.8 and 1.20 mg dm−3 (Raij, 2011), respectively,
including in the treatment 0SW, proving that these elements are significantly accumulated in the soil (Lucas et al., 2013). Concentrations of 1.1 and 1.4 kg ha−1 of Cu2+ and Zn2+ (Table 2) were
added, respectively, in the treatments with 300 m3 ha−1. At all previous experiments, at these same
plots, the total applied reached approximately 240 and 133 kg ha−1 of Cu2+ and Zn2+, respectively.
These elements are used in hog diets in order to increase feed conversion. However, they are excreted in larger amounts than those absorbed by the animals, which explains the high concentration in SW (Table 1). These elements are usually associated with organic compounds, mainly linked to humic substances. Thus, after SW application, the organic compounds need to be mineralized before being released, favoring the accumulation in the soil superficial layers and hence their transfer by surface runoff (Girotto et al., 2010; Scherer et al., 2010). However, when added to the soil via SW, these elements present a little mobility, accumulating in larger quantities in the superficial layer without greater environmental risks due to leaching (Table 5) (Scherer, 2010).
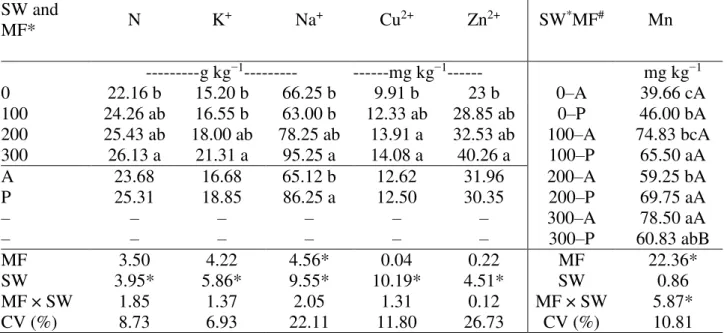
Leaf diagnosis
Non-significant means, such as those of P (2.33 to 2.58 g kg−1), Ca2+ (5.85 to 7.45 g kg−1),
Mg2+ (6.28 to 7.36 g kg−1), S (1.43 to 1.65 g kg−1), Fe (262 to 322 mg kg−1), and B (19.10 to 22.76
mg kg−1), were dismissed from Table 4.
SW application influenced the content of N, K+, Cu2+, and Zn2+, increasing as a function of
the dose (Table 4) as in the soil (Table 3).
A greater emphasis was given to N content for being the most required element by corn crops. Leaf N content was below that considered as adequate for the crop (27.5–32.5 g kg−1) (Malavolta,
1980) at all treatments. Although this element is present in the soil (Table 3), about 99% is in the organic form and, therefore, unavailable to plants. Since SW application was performed before planting, the N mineralization rate was expected to be sufficient to meet crop demand at the times of greatest need. Because there was no such factor, topdressing was recommended even with the association of SW and MF.
The amount of K in corn leaves was adequate only in the treatments 200SW and 300SW, above 17.5 g kg−1 (Malavolta, 1980). In these treatments, a greater K contribution was observed via
SW, as well as a greater availability of this element in the soil (Table 3).
The content of Cu2+ was below the ideal at all treatments (15–20 mg kg−1) even though
presenting an excess in the soil (Table 3). The content of Zn2+ was within an adequate range (15–50
mg kg−1) (Malavolta, 1980). Therefore, although at high amounts in the soil, the elements Cu2+ and
Zn2+ are unavailable to plants.
The content of Na+ was higher in the treatments 200SW and 300SW (Table 4). A special
attention should be taken since applications above 70 mg L−1 may cause damage to plant (Blum,
2003). In this study, the applied SW contained 167 mg L−1 of Na+ (Table 1). The presence of MF
more sites and more Na+ was free for absorption.
The content of Mn2+ presented higher values in the presence of SW, being adequate only in
corn leaves of plots that received SW (50–150 mg kg−1) (Raij, 2011). Thus, SW application is a
source of Mn2+, supplying corn demands.
TABLE 4. Amount of nutrients in corn leaves submitted to swine wastewater application and mineral fertilization in the 19th crop cycle.
Data presenting non-normality were transformed into . *Means followed by different letters differ statistically from each other. A: Absence of MF; P: Presence of MF; *: Significant at 5%; CV: Coefficient of variation. #: Breakdown of interaction. Means followed by lowercase letters in the column do not differ from each other by the Tukey’s test at 5% significance for the breakdown of SW within MF and means followed by the same uppercase letter in the column do not differ from each other by the Tukey’s test at 5% significance for the breakdown of MF within SW.
Leachate
The mean values of N (16.3 to 27.0 mg L−1), P (0.08 to 0.09 mg L−1), pH (6.7 to 6.8 mg L−1),
Mg (3.2 to 7.2 mg L−1), Mn (0), Zn (0.03 to 0.05 mg L−1), Cu (0.01 mg L−1), Fe (0.02 to 0.03 mg
L−1), B (0.01 to 0.02 mg L−1), NH
4− (1.20 to 36 mg L−1), and Norg (6.7 to 9.6 mg L−1) have no
statistical difference.
Analyzing the leachate after SW application (Table 5), the factors NO3−+NO2−, Ninorg, K+,
and EC increased as a function of the applied dose of SW. SW and
MF* N K+ Na+ Cu2+ Zn2+ SW*MF# Mn
---g kg−1--- ---mg kg−1--- mg kg−1
0 22.16 b 15.20 b 66.25 b 9.91 b 23 b 0–A 39.66 cA
100 24.26 ab 16.55 b 63.00 b 12.33 ab 28.85 ab 0–P 46.00 bA
200 25.43 ab 18.00 ab 78.25 ab 13.91 a 32.53 ab 100–A 74.83 bcA
300 26.13 a 21.31 a 95.25 a 14.08 a 40.26 a 100–P 65.50 aA
A 23.68 16.68 65.12 b 12.62 31.96 200–A 59.25 bA
P 25.31 18.85 86.25 a 12.50 30.35 200–P 69.75 aA
– – – – – – 300–A 78.50 aA
– – – – – – 300–P 60.83 abB
MF 3.50 4.22 4.56* 0.04 0.22 MF 22.36*
SW 3.95* 5.86* 9.55* 10.19* 4.51* SW 0.86
MF × SW 1.85 1.37 2.05 1.31 0.12 MF × SW 5.87*
TABLE 5. Amount of nutrients of the leachate collected after swine wastewater application and mineral fertilization in the 19th crop cycle.
Data presenting non-normality were transformed into . *Means followed by letters different letters differ statistically from
each other by the Tukey’s test. A: Absence of MF; P: Presence of MF; *: Significant at 5%; CV: Coefficient of variation; EC: Electrical conductivity.
This increase in N was expected because of its higher concentrations in SW (Table 1). In this study, the contents of NO3−+NO2− and Ninorg increased 1.6, 2.4, and 3.8 times with the use of 100,
200, and 300 m3 ha−1, respectively. This happened because this element has a high mobility and low
retention in soils. NO3− is weakly adsorbed in the soil and has a tendency to remain in solution,
mainly in superficial layers, where the organic matter accentuates the electronegative character of soil particles and repels NO3−, which is leached more easily through the soil profile. Because of
this, NO3− presents contaminant and pollutant potential of the surface and ground water, which can
alter water quality (Smanhotto et al., 2013). One of the main problems found with SW application in agriculture is the presence of nitrates in ground water due to the excess of N disposed of in the soil (SAMPAIO et al., 2010). Water with a concentration higher than 10 mg L−1 of NO
3− and 1.0
mg L−1 of NO
2− is considered as contaminated and the consumption of water with concentrations
above this limit can cause health problems (Brasil, 2005). In this case, the doses 200SW and 300SW may present a risk to the environment.
Furthermore, SW application occurred before crop sowing and there was no demand of N by corn, favoring the movement of NO3−+NO2− and Ninorg in the soil profile. The beneficial effect of
plants in this process of nutrient cycling is due to the absorption of mineral N from the percolated water. Thus, synchronism between SW application and crop requirements has to be respected.
The content of Ca2+ was higher at doses of 200SW and 300SW (Table 5). The amount of this
element is high in soil, ranging from 53.5–58.6 mmolc dm−3. Because CEC was high (Table 3), the
negative sites of soil were probably occupied with K+ and Mg2+ so that Ca2+ was free to be leached.
The content of K+ in the leachate increased as a function of the applied dose. The K+ present
in the residues was completely in the mineral form, being 100% available at the time of wastewater application (Table 5). In addition, the higher K+ value in the highest SW doses can be justified by
the high concentration of this element in this type of effluent (Maggi, 2011) (Table 1).
Wastewater application changed the electrical conductivity of the leachate (Table 5), which was higher according to the doses. The increase in EC from soluble salts is undesirable; however, the limit to fit leachate as freshwater Class I in Brazil is below 50 μm (Brasil, 2005).
The contents of K+ and S were higher in the presence of fertilization (Table 5) since both
elements are present in formulated chemical fertilizers.
SW and MF* NO3−+NO2− Ninorg Ca2+ K+ S EC
---mg L−1--- µS cm−1
0 5.5 b 6.65 b 1.08 b 0.33 b 2.47 14.35
100 8.65 b 9.97 ab 1.08 b 0.63 ab 3.05 18.18
200 13.10 ab 14.38 ab 1.71 ab 1.19 ab 2.30 28.81
300 21.10 a 18.90 a 2.41 a 1.86 a 2.97 33.46
A 13.34 13.59 1.59 0.64 b 0.83 b 21.95
P 10.83 13.27 1.55 1.37 a 4.57 a 25.45
MF 1.22 0.75 0.01 5.51* 16.73* 0.52
SW 8.88* 4.28* 4.06* 4.53* 0.20 3.47*
MF × SW 0.81 0.51 1.39 0.251 0.11 0.18
CONCLUSIONS
From a dose of 200 m3 ha−1, fertility increases and meets the nutritional corn requirements.
However, water quality must be taken into consideration since some chemical species can be leached, suggesting a synchronism between swine wastewater application and crop requirements. In addition, the levels of Cu2+ and Zn2+ should be monitored when swine wastewater is used associated
with mineral fertilization.
REFERENCES
Brasil (2005) Resolução CONAMA n. 357, de 17 de maio de 2005. Diário Oficial da República Federativa do Brasil 357(58):259-282.
Berenger P, Santiveri F, Boixadera J, Loveras J (2008) Fertilisation of irrigated maize with pig slurry combined with mineral nitrogen. European Jounal of Agronomy 28:635-645.
DOI:http://dx.doi.org/10.1016/j.eja.2008.01.010
Blum JRC (2003) Critérios e padrões da qualidade da água. In: Mancuso PCS, Santos HF. Reúso de água. Barueri, Manole, p125-174.
Brooks JP, Adeli A, Mclaughlin MR (2014) Microbial ecology, bacterial pathogens, and antibiotic resistant genes in swine manure wastewater as influenced by three swine management systems. Water Research 57:96-103. DOI: http://dx.doi.org/10.1016/j.watres.2014.03.017
Castaldelli APA, Sampaio SC, Tessaro D, Herrmann DR, Sorace M (2015) Meso e macrofauna de solo cultivado com milho e irrigado com água residuária da suinocultura. Engenharia Agrícola 35(5):905-917. DOI: http://dx.doi.org/10.1590/1809-4430
Ceretta CA, Lorensini F, Brunetto G, Girotto E, Gatiboni LC, Lourenzi CR, Tiecher TL, Conti L, Trentin G Miotto, A (2010) Frações de fósforo no solo após sucessivas aplicações de dejetos de suínos em plantio direto. Pesquisa Agropecuária Brasileira 45:593-602.
DOI:http://dx.doi.org/10.1590/S0100-204X2010000600009
Girotto E, Ceretta CA, Brunetto G, Santos DR, Silva LS, Lourenzi CR, Lorensini F, Vieira RCB, Schmatz R (2010) Acúmulo e formas de cobre e zinco no solo após aplicações sucessivas de dejeto líquido de suínos. Revista Brasileira de Ciência do Solo 34(3):955-965.
DOI:http://dx.doi.org/10.1590/S0100-06832010000300037
Gómez-Garrido M, Martínez-Martínez S, Faz Cano Á, Büyükkilif-Yanardag A, Arocena JM (2014) Soil fertility status and nutrients provided to spring barley (Hordeum distichon L.) by pig slurry. Chilean journal of agricultural research 74(1):73-82. DOI: http://dx.doi.org/10.4067/S0718-58392014000100012
Gonzatto R, Miola ECC, Doneda A, Pujol SB, Aita C, Giacomini SJ (2013) Volatilização de amônia e emissão de óxido nitroso após aplicação de dejetos líquidos de suínos em solo cultivado com milho. Ciência Rural, Santa Maria 43(9):1590-1596. DOI: http://dx.doi.org/10.1590/S0103-84782013000900009
Kessler NCH, Sampaio SC, Lucas SD, Sorace M, Citolin AC (2013a) Swine wastewater associated with mineral fertilization in soybean (Glycine max L.) cultures: 9th production cycle. Journal of Food, Agriculture & Environment 11(2):936-942.
Kessler NCH, Sampaio SC, Sorace M, Prado NV, Palma D, Cunha E, Andrade LH (2013b) Swine wastewater associated with mineral fertilization in blackoat (Avena sativa) cultures: 8th production cycle. Journal of Food, Agriculture & Environment 11(2):1437-1443.
Lourenzi CR, Ceretta CA, Brunetto G, Girotto E, Tiecher TL, Vieira R, Costa B, Cancian A, Ferreira PAA (2014a) Pig slurry and nutrient accumulation and dry matter and grain yield in various crops. Revista Brasileira de Ciência do Solo 38(3):949-958.
Lourenzi CR, Ceretta CA, Cerini JB, Ferreira PAA, Lorensini F, Girotto E, Tiecher TL, Schapanski DE, Brunetto G (2014b) Available content, surface runoff and leaching of phosphorus forms in a typic hapludalf treated with organic and mineral nutrient sources. Revista Brasileira de Ciência do Solo 38(2):544-556. DOI: http://dx.doi.org/10.1590/S0100-06832014000200019
Lucas SDM, Sampaio SC, Uribe-Opazo MA, Gomes SD, Kessler NCH, Prado NV (2013) Long-term behavior of Cu and Zn in soil and leachate of anintensive no-tillage system under swine wastewater and mineral fertilization. African Journal of Agricultural Research 8(7):639-647. DOI:http://dx.doi.org/10.5897/AJAR12.2063
Malavolta E (1980) Elementos de nutrição mineral de plantas. Piracicaba, Agronômica Ceres, 251p. Maggi CF, Freitas CLF, Sampaio SC, Dieter J (2011) Lixiviação de nutrientes em solo cultivado com aplicação de água residuária de suinocultura. Revista Brasileira de Engenharia Agrícola e Ambiental 15(2):170-177. DOI: http://dx.doi.org/10.1590/S1415-43662011000200010
Moura AC, Sampaio SC, Remor MB, Silva AP, Pereira PAM (2016) Long-term effects of swine wastewater and mineral fertilizer association on soil microbiota. Engenharia. Agrícola 36(2):318-328. DOI: http://dx.doi.org/10.1590/1809-4430-Eng.Agric.v36n2p318-328/2016
Oliveira DMS, Lima RP, Verburg EEJ (2015) Qualidade física do solo sob diferentes sistemas de manejo e aplicação de dejeto líquido suíno. Revista Brasileira de Engenharia Agrícola e Ambiental 19(3):280-285. DOI: http://dx.doi.org/10.1590/1807-1929/agriambi.v19n3p280-285
Passarin OM, Sampaio SC, Rosa DM, Reis RR, Correa MM (2016) Soybean nutritional status and seed physiological quality with swine wastewater. Revista Brasileira de Engenharia Agrícola e Ambiental 20(1):16-21. DOI: http://dx.doi.org/10.1590/1807-1929/agriambi.v20n1p16-21 Pereira PAM, Sampaio SC, Reis RR, Rosa DM, Correa MM (2016) Swine farm wastewater and mineral fertilization in corn cultivation. Revista Brasileira de Engenharia Agrícola e Ambiental 20(1):49-54. DOI: http://dx.doi.org/10.1590/1807-1929/agriambi.v20n1p49-54
Prior M, Smanhotto A, Sampaio SC, Nóbrega LHP, Opazo MAU, Dieter J (2009) Acúmulo e percolação de fósforo no solo devido à aplicação de água residuária de suinocultura na cultura do milho (Zea mays L.). Pesquisa Aplicada & Agrotecnologia 2:89-96.
Raij BV (2011) Fertilidade do solo e manejo de nutrientes. Piracicaba, International Plant Nutrition Institute, 420p.
Scherer EE, Nesi CN, Massotti Z (2010) Atributos químicos do solo influenciados por sucessivas aplicações de dejetos suínos em áreas agrícolas de Santa Catarina. Revista Brasileira de Ciência do Solo 34(4):1375-1383. DOI: http://dx.doi.org/10.1590/S0100-06832010000400034
Smanhotto A, Sampaio SC, Dal Bosco TC, Prior M, Soncela R (2013) Nutrients behavior from the association pig slurry and chemical fertilizers on soybean crop. Brazilian Archives of Biology and Tecnology 56(5):723-733. DOI: http://dx.doi.org/10.1590/S1516-89132013000500003
Tessaro D, Sampaio SC, Alves LFA, Dieter J, Cordovil CSCMS, Varennes A, Pansera WA (2013) Macrofauna of soil treated with swine wastewater combined with chemical fertilization. African Journal of Agricultural Research 8(1):86-92. DOI: http://dx.doi.org/10.5897/AJAR12.1829 Wang W, Liang T, Wang L, Liu Y, Wang Y, Zhang C (2013) The effects of fertilizer applications on runoff loss of phosphorus. Environmental Earth Science 68(5):1313–1319.