http://periodicos.uem.br/ojs/acta ISSN on-line: 1807-8621
Doi: 10.4025/actasciagron.v40i1.39322 CROP PRODUCTION
Application of lime, phosphogypsum and fertilization rates affect
soil fertility and common bean development in no-tillage system in
a Cerrado Oxisol
Maria da Conceição Santana Carvalho and Adriano Stephan Nascente*
Empresa Brasileira de Pesquisa Agropecuária, Embrapa Arroz e Feijão, Km12, Zona Rural GO-462, 75375-000, Santo Antônio de Goiás,Goiás, Brazil. *Author for correspondence. [email protected]
ABSTRACT. There is a lack of information about the effects of interactions among lime, phosphogypsum (PG) and fertilization on soil fertility and their effects on common bean yields in the tropics. This study aimed to determine the effects of annual application of PG and limestone and rates of fertilization on the chemical attributes of soil, fertilization efficiency, yield components and the grain yield of the common bean. The study was performed for three growing seasons in an acidic Oxisol. The experimental design was randomized blocks in a 4x4 factorial scheme. The treatments consisted of lime, lime + PG, PG, and control (without corrective application) with four fertilization rates. In an acidic and low-fertility Cerrado soil, limestone or limestone + PG applied annually at 1/3 of the total rate in a no tillage system increased the common bean yield and the efficiency of the fertilization, although the improvement of the soil acidity indicators did not reach the desired levels. The application of soluble fertilizers to provide adequate and balanced amounts of nutrients provided greater yield gains and improved soil fertility compared to surface liming without fertilization, but the combination of the two practices resulted in the greatest benefits to both plant and soil fertility.
Keywords:Phaseolus vulgaris; soil acidity; calcium carbonate; liming; phosphogypsum.
Calcário, fosfogesso e doses de fertilizantes afetando a fertilidade do solo e o
desenvolvimento do feijoeiro-comum em sistema de plantio direto em um Latossolo do
Cerrado
RESUMO. Existe carência de informação na região tropical sobre a interação entre calcário, fosfogesso (FG) e adubação na fertilidade do solo e seu efeito na produção do feijão-comum. O estudo objetivou determinar o efeito da aplicação anual de PG e calcário e níveis de adubação nos atributos químicos do solo, eficiência de fertilização, componentes de produção e rendimento de grãos do feijão-comum. A pesquisa foi realizada em três safras agrícolas em Latossolo vermelho ácrico. O delineamento experimental foi blocos casualizados em esquema fatorial 4x4. Os tratamentos consistiram na combinação de calcário, calcário + FG, FG e controle (sem corretivo) com quatro níveis de adubação. Em solo argiloso ácido e de baixa fertilidade do Cerrado, o parcelamento da dose de calcário ou calcário + FG com aplicação de 1/3 anualmente em SPD aumenta a produtividade do feijoeiro e a eficiência da adubação, embora a melhoria dos indicadores de acidez do solo não alcance os níveis desejados. A aplicação de fertilizantes solúveis para fornecer quantidades adequadas e equilibradas de nutrientes proporciona ganhos mais expressivos de produtividade e melhoria da fertilidade do solo, em comparação com a calagem superficial, mas a combinação das duas práticas resulta nos maiores benefícios para ambos, planta e solo.
Palavras-chave:Phaseolus vulgaris; acidez do solo; carbonato de cálcio; calagem; fosfogesso.
Introduction
The common bean (Phaseolus vulgaris L.) has great social and economic importance in several countries as an important source of protein. Despite its importance, technology is not frequently used by dry bean farmers, resulting in a global average grain yield of only 866 kg ha-1 (FAO, 2014). However, there are reports of yield ranging from 3,023 to
In a no-tillage system (NTS), soil acidity has been corrected by lime application on the surface without incorporation (Conyers, Heenan, McGhie, & Poile, 2003; Caires, Garbuio, Churka, Barth, & Corrêa, 2008; Churka Blum, Caires, & Alleoni, 2013). However, the limestone reaction is usually limited to the site of its application, since it has low soil mobility, which leads to questions about the viability of this practice to correct soil acidity in deeper layers (Caires et al., 1998; Soratto & Crusciol, 2008a). Previous studies conducted in Cerrado soil showed that the common bean crop responds strongly to improvement in soil acidity indexes (Fageria, 2008). Optimum values for maximum common bean grain yield in the 0 - 0.20 m soil layer were pH (in water) 6.5 and base saturation of 67% (Fageria, 2008). However, in the Cerrado region, it is common to find cropping areas with 30 - 35% base saturation in the 0 - 0.20 m layer, since other crops rotated with common beans, such as soybean and corn, are less sensitive to soil acidity indexes. In those cases, the required amounts of limestone to raise base saturation to 65 - 70% may be greater than 3 t ha-1, and a single application without incorporation may cause nutritional imbalances due to a possible super-liming effect on the topsoil (Padua, Silva, & Melo, 2006). An alternative is to split the calculated dose into two or three applications, but there is a lack of information about the efficiency of this practice for the common bean crop in the short and medium term.
It is also known that liming is one of the most important practices employed to increase the efficiency of fertilizer use, since the availability of most nutrients in the soil is optimal with pH (in water) between 6.0 and 7.0, except for cationic micronutrients, whose availability decreases with increasing pH (Fageria & Nascente, 2014). In addition, the neutralization of exchangeable Al and the supply of Ca favor the growth and distribution of roots in the soil profile, facilitating the uptake of nutrients applied through fertilizers. However, the application of high doses of fertilizers, mainly nitrogen fertilizers, causes soil acidification (Barbosa Filho, Fageria, & Silva, 2004). In recent years, it has been observed that the rates of fertilizer application to crops cultivated in Cerrado soils have been increasing, while liming has often been neglected. This behavior in tropical regions can be explained in part by the insufficiency of research results showing the interaction between these factors on soil fertility, plant nutrition and crop productivity in the different production systems.
For soils from the Cerrado region, the application of phosphogypsum (PG) as a subsoil improver is recommended when, in the 0.20 - 0.40 m and 0.40 - 0.60 m soil layers, the aluminum saturation is higher than 20% or the Ca content is lower than 5.0 mmolc
dm-3 (Sousa & Lobato, 2004). However, there is a lack of information on the response of the common bean to the application of PG alone or in combination with dolomitic limestone and their interactions with the application of increasing rates of fertilization in Cerrado soils in common bean crops. It is important to understand these interactions in order to establish management strategies that improve nutrient-use efficiency in long-term crop production, focusing on sustainable intensification.
This study was conducted to answer the following questions: First, in clay Cerrado soil cultivated in NTS, is the annual application of 1/3 of the total amount of limestone and PG on the soil surface without incorporation an effective practice to improve the soil acidity indicators to the levels required by the common bean crop and to increase the efficiency of fertilizer use? Second, how does the common bean grown with irrigation in a no-tillage system respond to different levels of fertilization in a Cerrado soil, with or without the annual application of limestone and PG. Third, what are the effects on soil fertility up to a depth of 0.40 m? Therefore, the study aimed to determine the effect of annual application of PG and limestone on the soil surface without incorporation and of rates of fertilization on the chemical attributes of the top layer of the soil, as well as on fertilization efficiency, yield components and the grain yield of irrigated common bean crops grown in a no-tillage system in the tropical Cerrado region.
Material and method
Site description
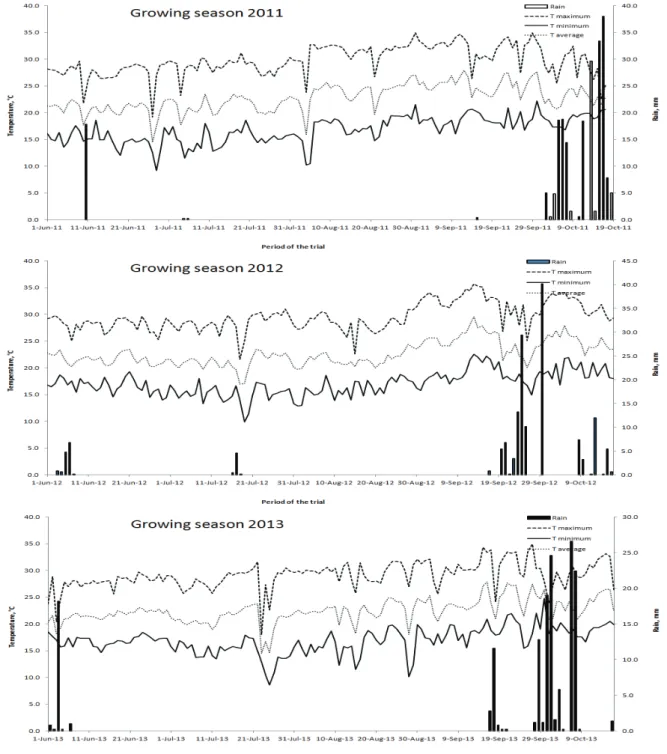
The experiment was conducted over three growing seasons (2011, 2012, and 2013) at the Capivara Farm, located in the city of Santo Antonio de Goiás, Goiás State, Brazil. The geographical coordinates of the site are 16° 28' 00" S, 49° 17' 00" W. The average daily temperature and precipitation during the experiment were monitored (Figure 1).
Figure 1. Temperature and rainfall in the experimental area during the experiment (June 2011 to Sept. 2013).
Table 1. Chemical characteristics of the soil before beginning the experiment, May 2011.
Depth Ca Mg Al H+Al K CEC¹ pH4
(m) ---cmolc dm
-3---
0 - 0.20 0.72 0.37 0.38 6.5 0.16 7.78 5.0
0.20 - 0.40 0.53 0.17 0.42 7.1 0.14 7.94 4.8
Depth V² SOM³ P Zn Cu Fe Mn
(m) % g kg-1 ---mg dm-3
---
0 - 0.20 16.0 18.3 6.0 3.1 2.1 58.7 11.7
0.20 - 0.40 10.6 17.0 2.3 3.1 2.1 58.7 11.7
¹Cation exchange capacity. ²Percent base saturation. ³Soil organic matter. 4pH in water. 5P Mehlich-1.
Experimental design and treatments
quantities were applied: 0, 60, 120, and 180 kg ha-1 N (urea); 0, 60, 120, and 180 kg ha-1 P2O5 (55% simple superphosphate – 16% P2O5, 12% S, 20% Ca and 45% triple superphosphate – 46% P2O5, 14% Ca); and 0, 30, 60, and 90 kg ha-1 K2O (potassium chloride – 60% K2O), respectively, for the four rates of fertilizer. Phosphorus and K were applied on the day of sowing, and the application of N was divided among the day of sowing, five days after emergence and the V4 growth stage (third trifoliate leaf).
The lime application rate (5.0 Mg ha-1) was calculated to increase the base saturation to 70% at a depth of 0 - 0.20 m. The amount of phosphogypsum (PG) used (2.5 Mg ha-1) was determined by the clay content of the soil (500 g kg-1) at a depth of 0.20 - 0.40 m as recommended by Sousa and Lobato (2004). These amendments were broadcasted on the surface of the soil without incorporation. The applications of lime and PG were divided into three applications as follows: on November 11th, 2010 (2 Mg ha-1 of lime and 1.0 Mg ha-1 PG), on November 11th, 2011 (2 Mg ha-1 of lime and 1.0 Mg ha-1 of PG) and on October 19th, 2012 (1 Mg ha-1 of lime and 0.5 Mg ha-1 of PG). The limestone used contained 26% Ca and 7.2% Mg. Its effective neutralizing value was 86.6%. The PG contained 21.8% Ca, 17.4% S, 1% P2O5 and traces of Si, Al, Mg, Na, Fe, Ce, Ti, La, K, Sr, Zr, and Pr.
Common bean cultivation (winter 2011, 2012 and 2013)
The sowing of the common bean cultivar ‘Perola’ was performed mechanically on June 6th, 2011, June 21st, 2012, and June 6th, 2013 using no-till graining with a row spacing of 0.45 m and a density of 12 seeds m-1. Each plot consisted of 10 rows that were each 5 m long. The usable area of each plot consisted of the 8 central rows, with 0.5 m on each side disregarded. Crop management was performed according to the crop recommendations to keep the area free of weeds, diseases and insects. An irrigation sprinkler system was used for water management.
Summer crops
In November 2010, November 2011, and November 2012, soybeans were cultivated in the same area and fertilized with 0, 40, 80, and 120 kg ha-1 P
2O5 (simple superphosphate) and 0, 40, 80, and 120 kg ha-1 of K2O (potassium chloride) in the plots corresponding to common bean fertilization rates of 0, 50, 100, and 150%, respectively (Carvalho & Nascente, 2014).
Soil characterization
A galvanized steel auger 4.5 cm in diameter was used to sample soil at depths of 0 to 0.10 m, 0.10 to 0.20 m, and 0.20 to 0.40 m in November 2013, 36 months after the first liming. For each soil layer, 15
random subsamples were collected from each plot and combined to form a composite sample. These samples were air dried, sieved (2 mm mesh) and analyzed to determine the pH (CaCl2 0.01 mol L-1), organic matter content, potential acidity (H + Al), Al, Ca, Mg, exchangeable K, and P (Mehlich-1). Percent base saturation (V) was calculated. Soil analyses were performed following the methods described by Donagema et al. (2011).
Yield components, grain yield, and efficiency of fertilizer use
The common bean crop was harvested on September 14th, 2011, October 2nd, 2012, and September 12th, 2013 from the usable area, first by hand and then using the thresher model BC 80 III. The common bean grain was weighed, and the yields were corrected to a moisture content of 130 g kg-1 and then converted to kg ha-1. Agronomic characteristics, the number of pods per plant and the number of grains per pod, were evaluated for 10 randomly chosen plants per plot, along with the 100-grain weight (calculated from 20 random samples per plot, adjusted to a moisture content of 130 g kg-1). To calculate the efficiency of fertilizer use, we summed the average yields in each treatment (control, lime, lime + PG, and PG) from the three growing seasons (2011, 2012, and 2013) and divided this sum by the amount of fertilizer used on the common bean crop during the three growing seasons.
Statistical analyses
An analysis of variance was performed for all variables. The soil corrective and level of fertilizer were considered fixed effects. Blocks, years and all interactions were considered random effects. A comparison of means was performed with a Tukey test (p ≤ 0.05). To analyze the efficiency of fertilizer use, we used an LSD test at p ≤ 0.05. A regression analysis was used for quantitative data (fertilizer levels). These analyses were performed using SAS statistical software.
Result
Alterations in soil chemical attributes
Table 2. Effects of the application of lime (L) and/or phosphogypsum (PG), fertilization rates and soil depth layers on the values of pH in water, Ca, Mg, Al, H+Al, K, cation exchange capacity (CEC) and base saturation (V) in the soil 36 months (November 2013) after the first application of the soil correction. Crop managed under the no-tillage system.
Soil corrective Depth 0-0.10 m
pH Ca Mg Al H+Al K CEC P V
---cmolc dm
-3--- mg kg-1 %
Control 5.33 b 1.24 c 0.41 c 0.12 a 5.1 a 0.18 a 7.0 b 11.2 a 26.2 b
Limestone 6.14 a 2.38 a 1.08a 0.00 b 3.3 b 0.19 a 6.9 b 12.1 a 52.9 a
L + PG 6.07 a 2.51 a 0.88 b 0.00 b 3.2 b 0.18 a 6.8 b 11.4 a 53.2 a
Phosphogypsum 5.37 b 1.60 b 0.38 c 0.10 a 5.3 a 0.19 a 7.5 a 9.8 a 29.2 b
Source of variation F probability
Soil corrective (SC) <0.001 <0.001 <0.001 <0.001 <0.001 0.0323 0.0013 0.0433 <0.001
Fertilization rate (F) <0.001 0.0744 0.0143 0.1829 <0.001 <0.001 0.0002 <0.001 0.0041
SC x F 0.7860 0.7820 0.5170 0.7660 0.7604 0.6906 0.5380 0.6763 0.8278
Soil corrective Depth 0.10-0.20 m
Control 5.02 b 0.76 c 0.23 b 0.34 a 5.3 ab 0.14 a 6.5 b 29.4 a 17.6 b
Limestone 5.29 a 1.19 ab 0.56 a 0.13 b 4.7 bc 0.13 a 6.6 ab 29.1 a 28.4 a
L + PG 5.27 a 1.41 a 0.47 a 0.13 b 4.4 c 0.14 a 6.4 b 31.6 a 31.5 a
Phosphogypsum 4.95 b 0.98 bc 0.22 b 0.34 a 6.0 a 0.14 a 7.3 a 29.5 a 18.6 b
Source of variation F probability
Soil corrective (SC) <0.001 <0.001 <0.001 <0.001 <0.001 0.0431 0.0095 0.0341 <0.001
Fertilization rate (F) 0.0142 0.3186 0.4606 0.2002 0.1330 <0.001 0.0347 <0.001 0.7874
SC x F 0.9622 0.8927 0.8197 0.6583 0.4339 0.8532 0.6052 0.6712 0.6071
Soil corrective Depth 0.20-0.40 m
Control 5.02 b 0.66 b 0.18 b 0.35 a 5.2 a 0.11 a 6.2 a 4.0 a 15.2 b
Limestone 5.03 ab 0.79 ab 0.32 a 0.29 ab 5.1 a 0.09 b 6.3 a 4.0 a 19.2 ab
L + PG 5.08 a 0.91 a 0.30 a 0.23 b 4.9 a 0.09 b 6.2 a 3.4 a 20.8 a
Phosphogypsum 5.04 ab 0.86 ab 0.21 b 0.30 ab 5.4 a 0.10 ab 6.5 a 3.5 a 17.9 ab
Source of variation F probability
Soil corrective (SC) 0.0451 0.0177 <0.001 0.0306 0.2368 0.0120 0.0343 0.6067 0.0057
Fertilization rate (F) 0.0213 0.1298 0.2771 0.4925 0.8743 0.0949 0.9958 <0.001 0.2640
SC x F 0.7598 0.6557 0.4041 0.8844 0.8056 0.7886 0.8328 0.7286 0.5581
¹Means followed by the same letter in a column within each depth do not differ by the Tukey test at p < 0.05.
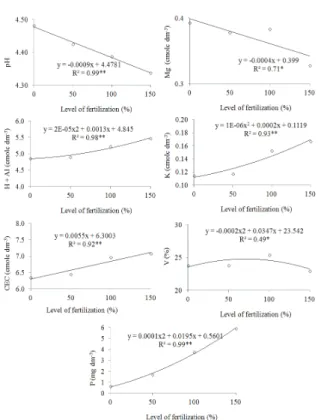
In the 0.20 - 0.40 m layer, the treatment with limestone + PG was the most effective at reducing soil acidity, resulting in the highest values of pH, Ca content and base saturation as well as the lowest value of exchangeable Al content. These results differed from the control, but were similar to limestone alone and PG alone (Table 2). The application of PG caused an increase in Ca content in the 0 - 0.10 m layer that differed from the control, increases of CEC in the 0 - 0.10 m soil layer that differed from all other treatments, and increases of CEC in the 0.10 - 0.20 m soil layer that differed from both the lime + PG treatment and the control. The available K content in the soil surface layers was not altered by the application of the correctives, but decreased significantly in the 0.20 - 0.40 m layer in limestone treatments (with or without PG) compared to the control. Fertilization rates affected pH, H + Al, base saturation, CEC, and Mg, K, and P contents available in the 0 - 0.10 m layer (Table 2). The pH, CEC, and Mg were adjusted to the linear regression model, and the other attributes were adjusted to the quadratic polynomial regression model (Figure 2). In the 0.10 - 0.20 m layer, significant effects were observed for pH, CEC, P, and K (Table 2), in which pH and CEC were adjusted to the linear regression model and P and K were fitted to a quadratic regression model (Figure 3). In the 0.20 - 0.40 m layer, fertilization rates affected only the pH and available P content; pH was adjusted to the linear regression model, and the available P was adjusted to a quadratic
regression model (Figure 4).
Yield components and grain yield
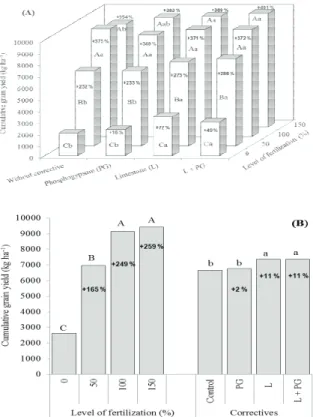
There was no interaction between soil amendments and fertilization rates for yield components or grain yield, but there were isolated effects of soil amendments and fertilization rates in the three growing seasons (Table 3). In the first growing season (2011), among the soils amendments, treatments with limestone provided the highest number of pods per plant, differing from the control, and grain yield of common bean, differing from both the control and PG alone.
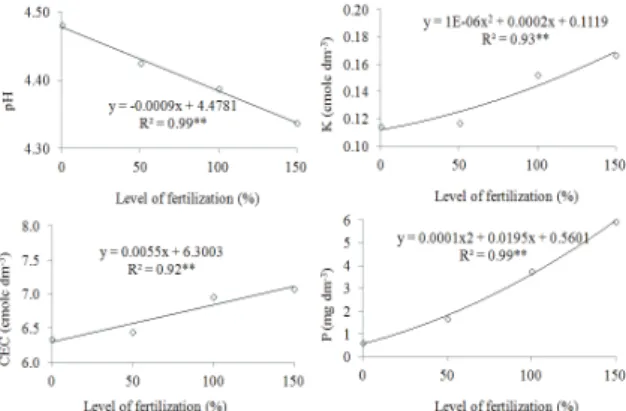
Figure 3. Chemical attributes of the soil (pH in water, CEC, K, and P) in the 0.10 - 0.20 m soil layer as a function of fertilization rates. Soil was measured 36 months after first application of lime and phosphogypsum under the no-tillage system.
The application of PG alone did not affect any of the variables (Table 3). Fertilization rates produced significant effects on the plant population and the number of pods per plant with linear adjustment and on number of grains per pods and grain yield with quadratic adjustment (Figure 6). In 2012, the application of limestone + PG provided the highest grain yield; while the grain yield produced with the application of limestone + PG was not significantly different from the treatment with limestone alone, it did differ from the control and the application of PG alone. Fertilization rates produced significant effects on the plant population with linear adjustment and on the number of pods per plant, the number of grains per plant and the grain yield with quadratic adjustment (Figure 6). In 2013, there was a significant effect of fertilization rates on all variables except plant population (Table 3), with quadratic adjustment for all four variables (Figure 7). The number of grains per pod was higher in the limestone treatment, differing from the control and the application of limestone + PG. Grain yield was higher with the application of limestone and limestone + PG, differing from the control treatment.
Table 3. Effects of application of lime (L) and/or
phosphogypsum (PG), fertilization rates and growing season on the plant population (POP), number of pods plant-1 (NPP),
number of grains pod-1
(NGP), 100-grain weight (W100) and grain yield (YIELD) of the common bean crop. Crop cultivated under the no-tillage system.
Soil corrective
Growing season 2011
POP NPP NGP W100 YIELD
n° x 1000 n° n° g kg ha-1
Control 284.4 a 6.67 b 4.10 a 23.5 a 1801 b
Limestone 278.8 a 9.04 a 4.05 a 23.6 a 2176 a
L + PG 272.0 a 8.57 ab 3.65 a 24.3 a 2106 ab
Phosphogypsum 278.8 a 8.58 ab 3.85 a 24.9 a 1826 b
Source of variation
F probability
Soil corrective (SC)
0.4300 0.0224 0.1781 0.3414 0.0076
Fertilization (F) <0.001 <0.001 <0.001 0.2508 <0.001
SC x F 0.1405 0.7899 0.6554 0.7405 0.7424
Correctives Growing season 2012
Control 251.5 a 11.07 a 4.27 a 27.3 a 2772 b
Limestone 245.6 a 12.03 a 4.30 a 28.1 a 2942 ab
L + PG 249.2 a 11.83 a 4.07 a 28.3 a 3015 a
Phosphogypsum 246.8 a 10.62 a 4.20 a 27.1 a 2783 b
Source of variation
F probability
Soil corrective (SC)
0.7530 0.1763 0.2313 0.0242 0.0054
Fertilization (F) <0.001 <0.001 <0.001 0.1376 <0.001
SC x F 0.3528 0.5394 0.5722 0.7534 0.0558
Correctives Growing season 2013
Control 230.1 a 11.52 a 2.78 b 27.47 a 2079 b
Limestone 225.0 a 12.39 a 3.09 a 27.93 a 2236 a
L + PG 236.1 a 11.93 a 2.78 b 27.26 a 2246 a
Phosphogypsum 236.1 a 11.25 a 2.90 ab 28.47 a 2148 ab
Source of variation
F probability
Soil corrective (SC)
0.6608 0.6220 0.0880 0.3261 0.0456
Fertilization (F) 0.3064 <0.001 0.0075 <0.001 <0.001
SC x F 0.0592 0.5454 0.8949 0.3832 0.0923
¹Means followed by the same letter in a column do not differ by the Tukey test at p < 0.05.
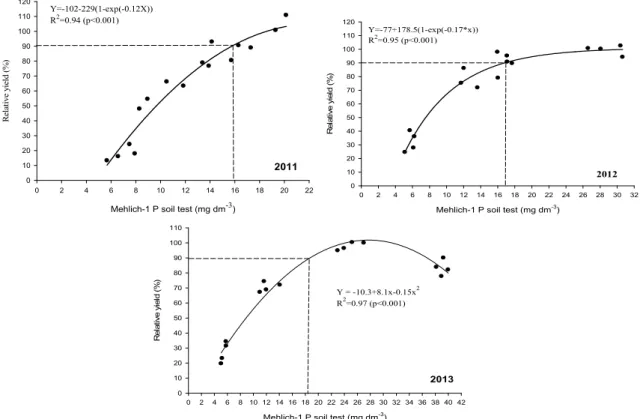
respectively (Figure 8B). Figure 9 shows a clear relationship between soil P availability and common bean grain yield, in which a variation of the soil P levels from 5 to 30 mg dm-3 was associated with a variation from 13 to 100% in the relative yield of common bean.
Figure 4. Chemical attributes of the soil (pH in water and P) in soil depths of 0.20 - 0.40 m as a function of fertilization rates. Soil measured 36 months after the first application of lime and phosphogypsum under the no-tillage system.
Figure 5. Plant population, grain yield, pods per plant and grains per pods of the common bean crop as a function of the level of fertilization. Growing season 2011.
Figure 6. Plant population, grain yield and yield components of the common bean crop as a function of the rates of fertilization. Growing season 2012.
Efficiency of fertilizer use
The treatments with lime, regardless of the addition of PG, increased the efficiency of fertilizer use (Table 4). For every kilogram of fertilizer applied, 11.53 kg of common bean grains were
obtained after lime application and 11.56 kg after application of lime with PG. These values differed from the control (10.56 kg of common bean grains) and from the application of PG alone (10.87 kg of common bean grains).
Figure 7. Plant population, grain yield and yield components of the common bean crop as a function of the rates of fertilization. Growing season 2013.
Y=-102-229(1-exp(-0.12X)) R2=0.94 (p<0.001)
Mehlich-1 P soil test (mg dm-3)
0 2 4 6 8 10 12 14 16 18 20 22
R el at ive y iel d ( % ) 0 10 20 30 40 50 60 70 80 90 100 110 120 2011 Y=-77+178.5(1-exp(-0.17*x)) R2=0.95 (p<0.001)
Mehlich-1 P soil test (mg dm-3)
0 2 4 6 8 10 12 14 16 18 20 22 24 26 28 30 32
R e la ti ve y iel d (% ) 0 10 20 30 40 50 60 70 80 90 100 110 120 2012
Y = -10.3+8.1x-0.15x2 R2=0.97 (p<0.001)
Mehlich-1 P soil test (mg dm-3)
0 2 4 6 8 10 12 14 16 18 20 22 24 26 28 30 32 34 36 38 40 42
R e la ti ve yi el d (% ) 0 10 20 30 40 50 60 70 80 90 100 110 2013
Figure 9. Relationship between the relative yield (RY) and soil Mehlich-extractable P at 0 - 0.20 m soil depth in 2011, 2012, and 2013 growing season. The data points represent the means of each rate of fertilization in each corrective treatment. Dashed lines represent the equivalent soil P level for 90% of the RY.
Table 4. Efficiency of NPK fertilizer use in the common bean crop cultivated under the no-tillage system as a function of lime (L) and phosphogypsum (PG) application.
No corrective Limestone L + PG PG
SSASY – A1 6653 7354 7367 6756
N - K2O-P2O5 applied by fertilizer - B
2 630 630 630 630
Fertilizer efficiency use - A/B 10.56 B³ 11.67 A 11.69 A 10.72 B
¹SSASY - Sum of average of the common bean grain yield from application of rates 0, 50, 100, and 150% of the recommended fertilization in three growing seasons (2011, 2012, and 2013). ²Average of the amount of N, P2O5, and K2O applied via fertilizer at doses 0, 50, 100 and 150% of the recommended fertilization in three growing seasons (2011, 2012 and 2013).
Thus, it was applied 0, 60, 120 and 180 kg ha-1 for N, totaling 360 kg ha-1 of N; 0, 40, 80, and 120 kg ha-1, for P
2O5 and K2O totaling 240 kg ha-1 of each nutrient, i.e., applied 840 kg N +
K2O + P2O5. The average was 210 kg ha-1 (840/ 4 fertilizer rates) for each year time 3 (growing season) = 630. ³Means followed by the same letter in the row do not differ by LSD test
at p < 0.05..
Discussion
Alterations in soil chemical attributes
The limestone treatment, with or without PG, produced the greatest changes in soil acidity indexes 36 months after the first application (Table 2). When the research was planned, we intended to reach the base saturation of 70% in the 0 - 0.20 m layer, but the highest value we achieved was 53% in the 0 - 0.10 m layer. Considering the average between 0 - 0.10 m and 0.10 - 0.20 m, the highest base saturation achieved was only 41 - 42%. Thus, splitting the rate of liming to apply 1/3 of the total annually was not a fully effective practice for correcting the soil acidity, considering the conditions of this experiment. However, our data do not allow us to determine whether the application of the same 5 Mg ha-1 of
limestone all in the first year would be enough to reach the aimed base saturation. This could be a question investigated in future research.
movement of the lime to deep layers (0.10 – 0.20 m and 0.20 – 0.40 m) occurred that produced changes in the chemical attributes, although not at the magnitude that we expected. In the evaluation done 24 months after lime application, there were only effects in the 0 - 0.10 m layer (Carvalho & Nascente, 2014).
The application of PG, which is not a soil acidity corrective, did not result in significant alterations of the pH of the soil or on other chemical attributes (Table 2). If applied in large quantities, this soil conditioner can cause leaching of bases (Ca, Mg, and K), especially Mg, to deeper layers (Ramos, Korndorfer, Pereira, & Camargo, 2006; Caires et al., 2008). In our experiment, we found higher amounts of Ca in the 0.10 - 0.40 m layer only when PG was applied with limestone, probably because Ca from PG moved to layers below 0.40 m. This could be an important strategy in tropical soil to enrich deeper layers with Ca and to stimulate root development. The greater root development could contribute to the plants reaching water in deep layers and could reduce problems caused by a period with no rain (Crusciol et al., 2016).
The pH level in all layers decreased with increases in the amount of fertilizer applied (Figure 2). An explanation of this pH decrease could be because of the use of nitrogen fertilizers that contain or produce N-NH4+, such as ammonium sulfate and urea. In the soil, this ion rapidly oxidizes to nitrate, releasing H+ and producing significant decreases in pH (Fageria et al., 2011; Nascente et al., 2012).
The Mg content decreased with increasing levels of fertilization. This finding can be explained by competition with K for soil adsorption sites. Soil K content increased with increasing levels of fertilization (Figures 2 and 3), probably because the quantities of K-fertilizer applied were higher than the quantities exported in the grains, which is approximately 14 kg ha-1 of K2O in each 1,000 kg of grains. According to Fageria et al. (2011), the application of K to soils directly affects Mg, as it competes for the same adsorption sites in the soil. Thus, it is probable that greater amounts of K caused the release of Mg from soil colloids and, possibly, the leaching of this nutrient to deeper layers. In addition, the reduction of the soil Mg level can be explained by exportation into grains, once the grain yield was increased as the rate of fertilization increased, since the fertilizers applied do not contain Mg.
In the soil layers evaluated, phosphorus also increased significantly with increasing fertilization rates (Figures 2, 3, and 4). This result was expected
because at higher rates of fertilization, the amounts of phosphorus applied were higher than the quantities exported in grains. The quantity of P exported is approximately 9 kg ha-1 of P2O5 in each 1,000 kg of grains produced. This can be used as a strategy for corrective fertilization in areas with low soil P tests, considering the low mobility of P into the soil, especially in tropical soils such as Oxisols, which results in accumulation of this nutrient in the soil.
Yield components, grain yield, and efficiency of fertilizer use
Liming increased the common bean grain yield in all growing seasons (Table 4). This result is a consequence of the changes in soil properties caused by the application of limestone to the soil, such as increased pH, availability of Ca and Mg, base saturation and CEC (Table 2).
grain yield was achieved when the rates of fertilization were 206, 129, and 109% in 2011, 2012, and 2013, respectively. This reduction in the rate of fertilizers required by the common bean is a result of the accumulation of nutrients in the soil (Figures 2, 3, 4, and 9) due to the residual effect of previous fertilization. Thus, these results reinforce the importance of monitoring the soil fertility status as a tool to support the planning of fertilization in cropping systems in order to adjust possible nutritional imbalances.
The equations displayed in Figure 9 show that the equivalent soil P (Mehlich-1) level for 90% of the relative P production was 16, 17 and 18 mg dm−3 in growing seasons 2011, 2012, and 2013, respectively. These values are higher than the 12 mg dm-3 reported by Sousa and Lobato (2004) as the critical level for irrigated cropping systems in clay Oxisols in the Cerrado region at a 0 to 0.20 m depth, indicating that the common bean is a lower P-acquisition efficiency crop compared to soybean or maize. Föhse, Claassen, and Jungk (1988) demonstrated that the common bean is a low P-uptake efficiency species, as determined by both a low root-shoot ratio and a low influx rate. In 2013, the mathematical model that best expressed this relationship was the quadratic model (Figure 9), suggesting a negative interaction effect could be occurring with other nutrients, such as zinc, when the soil P content was higher than 30 mg dm-3.
The effects of fertilization rates were of greater magnitude than the effects of liming. This could be because the changes in soil attributes up to a depth of 0.20 m that were caused by the application of limestone to the soil surface were of low magnitude for a highly demanding crop such as the common bean (Table 2). For example, the optimal pH in the 0 - 0.20 m layer for developing common bean crops ranges from 5.8 to 6.3 (Fageria et al., 2011). Fageria (2008) verified that the maximum common bean yield was achieved with a base saturation of 67% and a pH of 6.5. In our work, these values were not reached. Even so, it was observed that the response to fertilization was increased by surface-applied lime, improving the efficiency of fertilizer use. This indicates that the better strategy for farmers to increase fertilizer use efficiency and, consequently, to increase common bean grain yield in NTS is to avoid the decrease of base saturation to rates lower than 50%, since the effect of surface application of limestone without incorporation is slow.
Conclusion
The annual application of 1/3 of the total rate of limestone or limestone + PG improved the soil acidity indexes up to a depth of 0.20 m 36 months after the
first application. The application of PG alone did not result in significant alterations in soil chemical attributes and common bean grain yield.
Increasing levels of NPK and with fertilizers also containing Ca and S provided significant increases in grain yield and alterations in soil fertility. The common bean productivity increases in response to fertilization were even greater when combined with the application of limestone alone or limestone + PG.
Acknowledgements
To the National Council for Scientific and Technological Development (CNPq) for an award for excellence in research of the second author.
References
BarbosaFilho, M. P., Fageria, N. K., & Silva, O. F. (2004). Fontes e métodos de aplicação de nitrogênio em feijoeiro irrigado submetido a três níveis de acidez do
solo. Ciência e Agrotecnologia, 28(4), 785-792. doi:
10.1590/S1413-70542004000400009
Caires, E. F., Alleoni, L. R. F., Cambri, M. A., & Barth, G. (2005). Surface application of lime for crop grain production under a no-till system. Agronomy Journal,
97(3), 791-798. doi: 10.2134/agronj2004.0207
Caires, E. F., Barth, G., & Garbuio, F. J. (2006). Lime application in the establishment of a no-till system for grain crop production in Southern Brazil. Soil &
Tillage Research, 89(1), 3-12. doi:
10.1016/j.still.2005.06.006
Caires, E. F., Blum, J., Barth, G., Garbuio, F. J., & Kusman, M.T. (2003). Alterações químicas do solo e resposta da soja ao calcário e gesso aplicados na implantação do sistema de plantio direto. Revista
Brasileira de Ciência do Solo, 27(2), 275-286. doi:
10.1590/S0100-06832003000200008
Caires, E. F., Chueiri, W. A., Madruga, E. F., & Figueiredo, A. (1998). Alterações de características químicas do solo e resposta da soja ao calcário e gesso aplicados na superfície em sistema de cultivo sem preparo de solo. Revista Brasileira de Ciência do Solo,
22(1), 27-34.doi: 10.1590/S0100-06831998000100004 Caires, E. F., Garbuio, F. J., Churka, S., Barth, G., &
Corrêa, J. C. L. (2008). Effects of soil acidity amelioration by surface liming on no-till corn, soybean, and wheat root growth and yield. European
Journal of Agronomy, 28(1), 57-64. doi:
10.1016/j.eja.2007.05.002
Carvalho, M. C. S., & Nascente, A. S. (2014). Limestone and phosphogypsum effects on soil fertility, soybean leaf nutrition and yield. African Journal of Agricultural
Research, 9(17), 1366-1383. doi: 10.5897/AJAR2014.
8626
Churka Blum, S., Caires, E. F., & Alleoni, L. R. F. (2013). Lime and phosphogypsum application and sulfate retention in subtropical soils under no-till system.
Journal of Soil Science and Plant Nutrition, 13(2),
Conyers, M. K., Heenan, D. P., McGhie, W. J., & Poile, G. P. (2003). Amelioration of acidity with time by limestone under contrasting tillage. Soil & Tillage
Research, 72(1), 85-94. doi:
10.1016/S0167-1987(03)00064-3
Crusciol, C. A. C., Artigiani, A. C. C. A., Arf, O., Carmeis Filho, A. C. A., Soratto, R. P., Nascente, A. S., & Alvarez, R. C. F. (2016). Soil fertility, plant nutrition, and grain yield of upland rice affected by surface application of lime, silicate, and phosphogypsum in a tropical no-till system. Catena, 137(2), 87-99, 2016. doi: 10.1016/j.catena.2015.09.009
Donagema, G. K., Campos, D. V. B., Calderano, S. B., & Teixeira, W. G. (2011). Manual de métodos de análise de solo (2a ed.). Rio de Janeiro, RJ: Embrapa Solos. Fageria, N. K. (2008). Optimum soil acidity indices for
dry bean production on an Oxisol in no tillage system.
Communications in Soil Science and Plant Analysis, 39
(5-6), 845-857. doi: 10.1080/00103620701880909
Fageria, N. K., & Nascente, A. S. (2014). Management of soil acidity of South American soils for sustainable crop production. Advances in Agronomy, 128(1), 221-275. doi: 10.1016/B978-0-12-802139-2.00006-8 Fageria, N. K., Baligar, V. C., & Jones, C. A. (2011).
Growth and mineral nutrition of field crops. Boca Raton,
FL: CRC Press.
Föhse, D., Claassen, N., & Jungk, A. (1988). Phosphorus efficiency of plants. In: External and internal P requirement and P uptake efficiency of different plant species. Plant and Soil, 110(1), 101-109.
Food and Agriculture Organization of the United Nations
[FAO]. (2014). FAOSTAT – production: crops.
Retrieved on Oct. 29, 2016 from http://faostat.fao.org Michalovicz, L., Müller M. M. L., Foloni, J. S. S.,
Kawakami, J., Nascimento, R., & Kramer, L.F.M (2014). Soil fertility, nutrition and yield of maize and barley with gypsum application on soil surface in no-till. Revista Brasileira de Ciência do Solo, 38(5), 1496-1505. doi: 10.1590/S0100-06832014000500015
Nascente, A. S., Kluthcouski, J., Crusciol, C. A. C., Cobucci, T., & Oliveira, P. (2012). Fertilization of
common bean cultivars in tropical lowlands. Pesquisa
Agropecuária Tropical, 42(4), 407-415. doi:
10.1590/S1983-40632012000400003
Oliveira, E. L., & Pavan, M. A. (1996). Control of soil acidity in no-tillage system for soybean production.
Soil &Tillage Research, 38(1-2), 47-57. doi:
10.1016/0167-1987(96)01021-5
Oliveira, V. A., & Rodrigues, C. (2012). Levantamento detalhado dos solos da Fazenda Capivara, município de Santo
Antônio de Goiás-GO. Goiânia: Viasat Geotecnologia e
Meio Ambiente.
Pádua, T. R. P., Silva, C. A., & Melo, L. C. A. (2006). Calagem em latossolo sob influência de coberturas vegetais: neutralização da acidez. Revista Brasileira de
Ciência do Solo, 30(5), 869-878. doi:
10.1590/S0100-06832006000500013
Ramos, L. A., Korndorfer, G. H., Pereira, H. S., & Camargo, M. S. (2006). Reatividade de corretivos da acidez e condicionadores de solo em colunas de lixiviação. Revista Brasileira de Ciência do Solo, 30(5), 849-857. doi: 10.1590/S0100-06832006000500011 Soratto, R. P., & Crusciol, C. A. C. (2008a). Atributos
químicos do solo decorrentes da aplicação em superfície de calcário e gesso em sistema plantio direto recém-implantado. Revista Brasileira de Ciência do Solo, 32(2), 675-688. doi: 10.1590/S0100-06832008000200022
Soratto, R. P., & Crusciol, C. A. C. (2008b). Nutrição e produtividade de grãos da aveia-preta em função da aplicação de calcário e gesso em superfície na implantação do sistema plantio direto. Revista Brasileira
de Ciência do Solo, 32(2), 715-725. doi:
10.1590/S0100-06832008000200026
Sousa, D. M. G., & Lobato, E. (2004). Cerrado: correção do solo e
adubação (2a ed.). Brasília, DF: Embrapa Cerrados.
Received on September 6, 2017. Accepted on October 18, 2017.