RESUMO.- [Avaliação metabólica de cavalos Crioulos submetidos a uma competição de resistência de 750 km.] O cavalo Crioulo realiza uma das provas de maior exi-gência física nas modalidades equestres. A Marcha de Re-sistência é uma competição na qual os animais percorrem
750km durante 15 dias. O objetivo desse estudo foi carac -terizar as respostas metabólicas ocorridas nesse período. Foram avaliados 11 equinos da raça Crioula inscritos na competição, sendo dois machos e nove fêmeas. Foram efe -tuadas coletas de sangue 24h antes da prova e no 4º, 9º,
11º, 14º e 15º dia de competição. Foram avaliados a con -centração sanguínea de creatininoquinase, aspartato ami -notransferase, lactato desidrogenase, glicose, lactato, uréia, creatinina, sódio, potássio, cloreto, magnésio, cálcio total, cálcio iônico, proteínas totais, hematócrito e o leucograma. Ao final da competição os valores médios de AST sérica fo -ram de 1151±358 UI/L, os valores de médios de LDH fo -ram de 7418±1695 UI/L e de CK foi de 13867±3998UI/L. Houve aumento significativo nos valores de uréia, creati -nina e lactato (p<0,0001). Foi observada diminuição nos valores médios de cloreto, sódio, potássio, cálcio total e iônico (p≤0,0002). Na avaliação hematológica foi constata -da elevação nos valores de leucócitos totais e segmentados (p≤0,0002) e diminuição nos valores de hematócrito, pro -teína plasmática total e linfócitos (p≤0,0003). Os valores de glicose, em média mantiveram-se constantes. Com base nesses dados conclui-se que a competição Marcha de Resis
-Metabolic evaluation of Crioulo horses participating in
competitions of 750 km
1Lorena Alvariza Amaral2*, Millie Marchiori2, Charles Ferreira Martins3, Marcio
Nunes Correa3 and Carlos Eduardo Wayne Nogueira3
ABSTRACT.- Amaral L.A., Marchiori M., Martins C.F., Correa M.N. &Nogueira C.E.W. 2013. Metabolic evaluation of Crioulo horses participating in competitions of 750 km. Pes-quisa Veterinária Brasileira 33(12):1471-1477. Departamento de Clinicas, Faculdade de
Veterinária, Universidade Federal de Pelotas, Campus Universitário s/n, Pelotas, RS 96010-900, Brazil. E-mail: lo1amaral@gmail.com
The Crioulo breed of horses performs in one of the most physically demanding eques -trian competitions, the Marcha de Resistência, which is a contest in which the horses run
750 km in 15 days. The study’s aim was to characterize the metabolic responses during this period. We evaluated eleven Crioulo horses in the competition, specifically, two males and nine females. Blood samples were collected 24 hours before the contest and on the 4th, 9th, 11th, 14th and 15th days of competition. We evaluated CK, AST, LDH, glucose, lactate, urea, creatinine, sodium, potassium, chloride, magnesium, total calcium, ionized calcium, total protein, hematocrit and the white blood cell count. At the end of the competition, the mean values of serum AST were 1151±358 IU/ L the mean LDH values were 7418±1695 IU/L and CK was 13,867±3998UI /L. There was a significant increase in urea, creatinine and lactate (p<0.0001). A decrease in the mean values of chloride, sodium, potassium, and total and ionized calcium was observed (p≤0.0002). An evaluation of the total leukocytes and segmented neutrophils (p≤0.0002) revealed their increased values, and decreased values were observed for hematocrit, plasma protein and total lymphocytes (p≤0.0003). The values of glucose, on average, remained constant. Based on these data, we conclude that the Marcha de Resistência competition necessitated a high muscular demand and the
depletion of energy and electrolytes, suggesting an inflammatory process in the animals evaluated.
INDEX TERMS:Endurance, horse, exercise, metabolism.
1 Received on September 6, 2013.
Accepted for publication on November 21, 2013.
2 Post-Graduates in Veterinary Medicine, Faculdade de Veterinária, Uni -versidade Federal de Pelotas (UFPel), Campus Universitário s/n, Pelotas, RS 96010-900, Brazil. *Corresponding author: lo1amaral@gmail.com
tência determinou elevada exigência muscular, com deple -ção energética e eletrolítica, além de sugerir um processo inflamatório nos animais avaliados.
TERMOS DE INDEXAÇÃO: Enduro, equino, exercício, metabolismo.
INTRODUCTION
The progression in the knowledge of exercise physiology in horses was begun by Procter in 1934. At that time, the stu -dy gathered the general knowledge of physiology, bioche -mical energy and its interaction with other systems with the primary objective of understanding and improving equine sports medicine. After years of research, if has been observed that within the different racial groups, there are numerous features associated with the metabolic response of the horse to exercise; therefore, the racing of a horse or its genetic group influences physiological events that occur during physical activity (Boffi 2006).
The Crioulo breed has the second-highest record of ani -mals in Brazil, and it is known for its versatility and rug -gedness, as exhibited in the equestrian’s greatest physical test known in the world, the Marcha de Resistência (ABCCC
2011). The Marcha de Resistência is a competition with the
aim of demonstrating and disseminating the resistance of the Crioulo horse. The test consists of a 750-km course with points of rest and veterinary control. The competition is held on farms inside the Rio Grande do Sul, where the animals are exposed to adverse weather conditions, rou -gh terrain and natural obstacles. The competition is held during a period of 15 days, and all horses are submitted to homogeneous environmental conditions, being kept on native pastures with access to water at will with no medi -cation or replacement minerals. During the competition, the animal’s metabolism undergoes a maximum require -ment to keep organ systems functioning, but no one kno -ws exactly how the horse’s body responds to this challen -ge. Data on the energy profile, muscles, kidney, liver and electrolytes are essential for understanding the metabolic behavior of these animals. In horses that participate in endurance competitions, these assessments are part of a routine monitoring response to resistance exercise (Evans 2000). Therefore, the aim of this study was to characterize the metabolic responses in Crioulo horses participating in a 750-km contest of strength.
MATERIALS AND METHODOS
This experiment was developed in the Jaguarão municipality of Rio Grande do Sul state (Latitude - 32°33’58’’ Longitude - 53°22’
33’’, Height - 26 meters) during the annual Marcha de Resistência
organized by the Brazilian Association of Crioulo Horse Breeders. The stages took place on farms located within the municipality.
The competition consisted of twenty-nine Crioulo partici
-pants, and the studied population consisted of 11 horses (two males and nine females) with an average body weight of 458±42 kg and 8±4 years of age respectively. The chemical assessment of the pasture in the paddock where the animals were released daily during the competition was determined to consist of 68.7% of dry matter, 5.7% crude protein, 1.1%ether extract, 17.8% crude fiber
and 7.3% ash. All animals, 30 days prior to the start of the com
-petition, were treated against endo and ectoparasites and subse
-quently kept in a communal environment with pasture and water
ad libitum. During the competition, after each daily step, the ani
-mals were kept loose on native grass with water access and pro
-hibited from any therapeutic intervention and supplementation during the competition. This study was approved by the Ethics and Animal Experimentation nº 4602/2010.
All of the animals underwent the collection of blood samples with EDTA, oxalate and without anticoagulant before the start of the competition (day 0) for a hematological and biochemical analysis. The hematological and biochemical evaluations were
performed immediately after the end of each stage of the compe
-tition on days 4, 9, 11, 14 and 15, as shown in table 1.
The physiological pattern taken as a reference to determine the healthiness of the animals has been described in literature (Kaneco et al. 1997).
Immediately after blood collection, blood glucose was measu
-red by a glucometer (Accutrend ® Performance, Roche Diagnos
-tics, Mannheim, Germany). The samples in tubes without anticoa
-gulant were centrifuged for 5 min at 400 G, and the separated was serum frozen at -20°C for subsequent analysis of urea (UR), creati
-nine (CR), creatine kinase (CK), aspartate aminotransferase (AST),
lactate dehydrogenase (LDH ), sodium (Na), potassium (K), mag
-nesium (Mg), chlorine (Cl), total calcium (Ca) and calcium ion (Cai).
The samples collected in tubes with oxalate were also centrifuged at 400G for 5 min, and the separated plasma was frozen at -20 C for the subsequent measurement of lactate. The determination of
plasma lactate was performed by enzymatic method using a com
-mercial kit (Labtest Diagnóstica S.A., Lagoa Santa, Brazil) on semi
--automatic biochemical analyzer (Bioplus - BIO 200).The samples
were gathered with EDTA and were sent to the clinical pathology
laboratory at the Federal University of Pelotas, where they mea
-sured the total serum protein (TPP), hematocrit (HT), hemoglobin (Hb) and complete leukocytes. We analyzed Cl, Mg and Ca with the aid of reagents (Labtest Diagnóstica S.A., Lagoa Santa, Brazil) for performing a subsequent spectrophotometry (Labquest - CELM, E-225-D, Salzburg, Austria). The Na, K and Cai were determined with the aid of reagents and a further reading on a diagnostic ion selector (Iselab – Drake, São José do Rio Preto, SP, Brazil). Using the blood samples collected in the vials containing anticoagulant (EDTA), we collected the hematocrit in the microhematocrit tube centrifuged at 14.000 G five minutes later with a particular scale reading. The plasma total protein concentration was determined by refractometry (Atago T2 –NE , Bellevue, WA 98005,USA). The values of the CK activity and the AST LDH methodology kinetics were determined by UV-IFC kits (Labtest Diagnóstica S.A., Lagoa Santa, Brazil) and spectrophotometry (Labquest - CELM, modelo E-225-D, Salzburg, Austria). Urea levels were measured by UV kine
-tic enzyma-tic method and creatinine levels were measured by alka
-line picrate method, the reading was performed by spectrophoto
-metry (LabQuest - CELM, model E-225-D, Salzburg, Austria) and by using commercial kits (Diagnostic Labtest SA, Lagoa Santa, Brazil).
The statistical analysis were performed using the Statistical Analysis System (SAS Institute Inc. Cary, NC, USA) by analysis of variance with a simple comparison of media through the Tukey test and was considered to be significant if p<0.05.
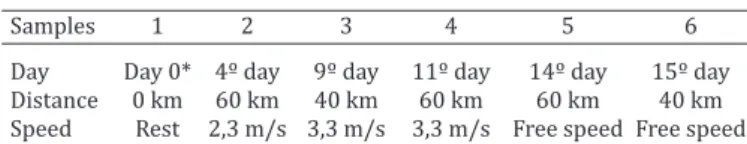
Table 1. Schedule of speed and distance traveled by the animals on each day of sampling during the Marcha de
Resistência
Samples 1 2 3 4 5 6
RESULTS
Twenty-nine animals participated in the competition, and twenty-three completed the total distance of 750 km. Six animals left the competition, four because of exhaustion and two for claudication.
In the profile determined by the measurement of mus -cle CK, AST and LDH, it was observed that the levels of CK and LDH before the start of the competition were, on ave -rage, 513 IU/L and 922 IU/L, respectively (Fig.1). At the end of the competition (day 15), the mean value of CK was 13,837±3998 IU/L and 2614% higher than the value ob -tained before the competition. The mean value of AST was 1,150±358 IU/L and 193% higher than the average obser -ved before the competition. LDH averaged 7,418±1,695 IU/L, which was 717% greater than the mean value ob -served at rest. The biggest turning point in the curve of CK during the competition was observed from the 9th day, and
that of the AST was observed only from the 14th day, while
that of the LDH was observed from the 11th day. observed after the 11th and 15th day of the competition,
which was obtained averaging 130±0.9 and 131±1.1mEq/ dL, respectively, being below the physiological values and significantly different regarding the collection at rest (p<0.0001). The average potassium observed at rest was 4.2±0.09mEq/dL, and this value showed significant decre -ases on days 4 and 14 of the competition, averaging 3±0.1 and 32±0.1mEq/dL respectively (p=0.0002).
At the end of the competition, the total calcium showed a general mean of 8.73±0.3mg/dL. Hypocalcemia was ob -served in all of the animals before starting the competition, being observed as, on an average, 9.8±0.1mg/dL. After the 4th day of competition, there was a significant drop in the serum to an average of 7.8±0.3mg/dL, but during collec -tion, these rates increased to 8.9±0.1mg/dL and remained constant in subsequent collections. Investigation of the cal -cium ion revealed that the average was 1.7±0.04mEq/dL with a significant drop from the 4th day and was retained
in the average until end of the competition. However, it is noteworthy that the observed values were high in relation to the physiological patterns.
The mean serum magnesium at rest was 1.56±0.04mg/ dL, and on day 4 was 1.48±0.06mg/dL, at day 9 was 1.39±0.05mg/dL, at 11 days was 1.33±0.06mg/dL, at day 14 was 1.43±0.07mg/dL, and at 15 days was 1.42±0.1 mg/dL, with no difference being observed between the collections.
The average of the blood lactate was not changed in the collections of the 4th day (1.37±0.3mmol/dL), the 9th
day (1.36±0.1mmol/dL) and the 11th day (2.45±0.3mmol/
dL), which corresponded to the slower developed steps (2.3m/s, 3.3m/s, and 3.3m/s, respectively). On the 14th and
15th day, the values rose (p<0.05) and were above the phy -siological values of 5.2±0.5, 42±0.9mmol/dL.
The mean blood glucose levels in the animals at rest was 67±1.3mg/dL on day 4, 76±10.2mg/dL at 9 days, 56±2.1mg/ dL at day 11, 82±7.3mg/dL on day 14, 60±6.4mg/dL on day 15 with a mean value of 72±10.1mg/dL and no difference between trials (p=0.1).
In hematology, the mean hematocrit was observed at rest to be 41.9±1.3% with a gradual decrease of the mean values occurring by the 11th day of competition when the observed Fig.1. Serum levels of LDH on different days of the competition.
Fig.2. Serum levels of urea on different days of the competition.
Serum creatinine showed average 1.37±0.06mg/dL at rest and exhibited moderate oscillations during the compe -tition (p<0.0001). On the 14th day was measured the highest
elevation in serum levels, and this level remained at the end of 15 days, reaching a mean value of 1.75±0.07mg/dL.
The serum urea rose at each collection (Fig.2), remaining above the physiological levels from the 4th day of competition,
and reaching their highest average levels on the 15th day with
a value of 67.3±3.9mg/dL, 589% higher than the baseline. Regarding the electrolytic variables, the chloride avera -ge before the competition was 98 ± 1.1mEq/dl, and its va -lue on day 15 was 86±3.6mEq/dl, which was 12.5% lower than at the first collection (p<0.0001). It was observed that 54% (n=6) of the animals had chloride values below the physiological limit prior to the start of the contest. During the competition, the analysis of chloride remained below physiological levels in 51.3% (n=47), and on days 14 and 15, all (n=11) animals showed hypochloremia.
average was 27.4±1.1% (p<0.05). Days 14 and 15 showed an increased hematocrit compared with day 11 (p<0.05). In the collections of the 9th and 11th days, the animals were anemic, with a mean value of 28±0.9% being observed. He -moglobin values showed the same behavior (Table 2).
As with the hematocrit and hemoglobin, the total plasma protein had lower values during the competition (p<0.0001), as shown in Figure 3.
In the evaluation of the average WBC, the total leu -kocytes at rest were 11.900± 503, with a significant incre -ase occurring until the 15th day, which had an average of
16,400±645. The behavior of the values of the segmented neutrophils was similar, whereas treated neutrophils exhi -bited leukocytosis (Fig. 4). The average resting segmented neutrophil was 5900 ± 432, while on the 15th day, the avera
-ge rate was 13,500±821 (p<0.0001). The avera-ge number of the animal’s lymphocytes before the competition was 5200±366. With the passage of the stages of the competi
-chloride, potassium, magnesium, sodium, total and ionized calcium. The values of CK, AST and LDH were found to be high throughout the competition whereas at the end of the race CK levels have increased 2614%, AST was 193% and LDH increased 717%. Salles (2013) evaluating horses in a 90 km endurance competition, observed CK rise of 83%, 31% in AST levels and 41% in LDH levels. As noted during the Marcha de Resistência, the average of increase in these
enzymes were much higher, which may characterize an ex -tensive involvement of cell membrane permeability or even rupture of the muscle cells characterizing cases of myositis. For Spinha de Toledo et al. (2001) only high plasma con -centrations would have a direct relationship with severe myositis. However, no animal was removed from the com -petition for suspected muscle injury.
In addition to enzymes related to serious muscle da -mage, myoglobin is released into circulation; this meta -bolite is toxic to renal tubules and is responsible for acute renal failure associated with severe myositis(Hamilton et al. 1989). The high levels of CK and LDH shown in Table 2 were not accompanied by significant increases in serum creatinine. These data corroborate with those observed by Noleto (2012) and Santiago et al. (2013), which found no elevation in serum creatinine levels after prolonged exerci -se. The BUN levels rose from day 4 but remained constant
Table 2. Mean ± s.e. values for each hematological variable evaluated in the collections made during the Marcha de
Resistência
Day of sample Basal 4º 9º 11º 14º 15º
Leukocyte 11945a 12573a 14118abc 13067ab 15780bc 16463c (/µl) (±503,1) (±654,6) (±934,6) (±727,5) (±681,9) (±645,8) Neut. segmented 5955a 9109b 11301bc 9102b 11893bc 13435c (/µl) (±432,2) (±780,8) (±822,1) (±555,3) (±798,4) (±821,8) Lymphocytes 5252a 2918bc 1993b 3136bc 3453c 2644bc (/µl) (±366,9) (±243,3) (±183,9) (±199,2) (±438,0) (±277,8) Hematocrit 41,9a 35,4b 28,5c 27,4c 31,6ab 38,1ab (%) (±1,30) (±1,10) (±0,85) (±0,90) (±1,02) (±1,11) Hemoglobin 14,2a 12,4b 9,8c 9,4c 13,5ab 13,0ab (g/dl) (±0,44) (±0,42) (±0,33) (±0,32) (±0,34) (±0,37) PPT (g/dl) 7,1a 6,4b 6,2b 6,3b 6,6ab 6,6ab (±0,13) (±0,13) (±0,10) (±0,14) (±0,15) (±0,16)
Fig.3. Plasma levels of PPT on different days of the competition.
Fig.4. Mean segmented neutrophils on different days of the com
-petition.
Fig.5. Means of lymphocytes on different days of the competition.
tion, there was a decrease in the serum levels of these cells, and on the15th day, the average was 2600±277 (p<0.0001), as shown in Figure 5.
DISCUSSION
until the end of the competition. The results of creatinine and urea showed no injury to the kidney in these animals, despite the high levels of muscle enzymes.
The increase in urea levels and the observed decrease in total plasma protein can configure the use of protein catabolism as a source of energy for maintenance of exer -cise during the Marcha de Resistência. In general, exercise
of low intensity and long duration has 94% of its energy generated by the consumption of lipids (Boffi 2006). Howe -ver second Lawrence (1994), is not determined how much the protein is important as fuel for exercise in horses, ne -vertheless in other animal species is estimated that protein catabolism contributes 5-15% of the oxidative energy pro -duction. Increasing concentrations of urea and decreased protein in the blood of endurance horses can quickly re -flect protein catabolism in situations of glycogen depletion (FRAPE 1998).
In the evaluated animals, the average blood glucose at rest was observed to be below the reference values, and this trend continued during the year. In other races, such as Arabic and PSI, an inverse trend is described with incre -ased blood glucose levels all during exercise (Balarin et al. 2006, Orozco et al. 2007). The increase of blood glucose is explained by the release of catecholamines and the stimu -lation to gluconeogenesis and lipolysis.
In this study, we found that animals that had high glu -cose levels (>100mg/dl) showed signs of fatigue, and a he -art rate, body temperature and dehydration elevated> 8%; however, those that left the competition had hypoglycemic (<20mg/dl) energy depletion. Fernandes & Larsson (2000) observed a reduction in blood glycemia levels after an en -durance race, however not at such low levels.
The concentration of lactate and the serum concentra -tion of chloride showed the greatest change on the 14th and
15th day, on which the animals showed hypochloremia. The -se days were the last two days of competition, and becau-se the competition is free of speed steps, the animals reached an average speed of 7m/s. The concentration of chloride in sweat is twice its concentration in plasma; therefore, the sweat results in an extended loss and a significant re -duction in its plasma concentration, as observed by Correa 2010 in horses during resistance exercise.
According to Santos & Gonzáles (2006) the increase in lactate levels above 4 mmol/l is common on high physical intensity competition, however, despite the Marcha de Re-sistência be considered a low intensity competition, at the
last days are developed high speeds that characterized a ratio above 4mmol/l in plasma lactate levels, similar result observed by Ferraz et al. (2009) e Caiado et al. (2011)
In general, during endurance competitions, there are symptoms of hypokalemia associated with the fatigue of animals (Rose et al, 1980) . In this study, we observed a significant decrease in serum potassium levels (p=0.0002), but the average remained within the physiological limits. In a 40-km endurance competition a decrease in the va -lues of the concentration of potassium ions was observed (Martins et al. 2005), Di Fillippo et al (2009) made a similar observation in 60km enduranceIn the evaluated animals, a low level of total calcium associated with normal or eleva
-ted levels of calcium ion was observed. The total calcium remained below the physiological values in all of the col -lections that were made; however, the calcium ion, despite remaining undiminished during the competition, remained within the physiological limits. Serum calcium is the sum of three components: the ionized calcium, the one bound to plasma proteins and the complex, with such anions as citrate, phosphate and sulfate. Serum calcium’s ionized fraction is the biologically active form and makes up appro -ximately 50% of the total calcium in the blood, whereas the remainder is bound to albumin and other plasma proteins (Silva 2008).
The serum calcium concentration is reduced during exercise, due to its loss in sweat and the intracellular ex -changes between muscle cells or because of an increase in calcium binding with other substances in the plasma. Aci -dosis removes calcium from albumin, increasing the con -centration of ionized calcium in the plasma; the opposite phenomenon occurs in alkalosis. Thus, acidosis is accom -panied by hypercalcemia and alkalosis by hypocalcemia (Bayly & Kline 2006). However, in these evaluated animals, the findings do not clarify the etiology of the low total cal -cium levels observed before the beginning of the compe -tition, suggesting that these results are due to the physio -logical profile of horses trained for endurance. The same way Correa et al. (2011) observed before exercise, decrease in serum calcium levels in animals trained for horseback riding.
Unlike the values of total calcium, magnesium levels remained constant during the competition, but they re -mained below physiological limitsThis ion plays an impor -tant role in muscle contraction. According to Bayly & Kline (2006), the plasma concentration of magnesium may de -crease after prolonged exercise because its concentration on sweat is greater than its plasma concentration. However Sales et al. (2013) demonstrated an increase in the concen -tration of Mg after 90km endurance, associating the case to an increase in muscle cells permeability, where their con -centration is higher. In the present study, despite the high permeability of muscle cells, configured by the increase in CK, AST and LDH, no change was observed in magnesium levels.
-ggests the occurrence of intravascular hemolysis induced by exercise, as observed in human athletes and described in athletic horses (Masini et al. 2003). The occurrence of hemolytic episodes is indicated by the presence of high plasmatic hemoglobin associated with low levels of hapto -globin after exercise. The literature regarding “sports ane -mia” in horses, particularly exercise-induced hemolysis, is quite limited.
The neutrophil leukocytosis observed in all animals in this study is described in the equine endurance practice and some other modalities (Orozco et al. 2006, Ferraz et al. 2009, Miranda et al. 2011, Santiago et al. 2013). The WBC has been widely used as an indicator of stress in horses. A stressed WBC is characterized by elevated values of total leukocytes, which is accompanied by neutrophilia, lympho -penia and eosino-penia (Bayly & Kline 2006). The enduran -ce is associated with neutrophilic leukocytosis (Snow et al. 1982), which is probably due to the increase of circulating steroids (Bayly & Kline 2006). This finding is confirmed in this study because at the end of the competition, all of the animals presented total leukocyte values above the physio -logical levels. This result may be related to the fifteen days in which the animals were subjected to exercise stress in the Marcha de Resistência competition.
However lymphocytes showed an inverse behavior. As the competition developed, the lymphocyte values decrea -sed in comparison with the initial collection. These data, as well as neutrophilia, may be linked to immunosuppression caused by the long-term presence of endogenous corticos -teroids similar result observed by Miranda et al. (2011). Se -cond Rose & Hodgson (1994), the occurrence of persistent leukocytosis observed in competition suggests physical exhaustion of the animals.
CONCLUSION
Based on these data, it is concluded that competition in the
Marcha de Resistência led to a high muscular demand with
depletion of energy and electrolytes, suggesting an inflam -matory process in the evaluated animals.
REFERENCES
ABCCC 2011. Regulation of the Marcha de Resistência. Brazilian Associa
-tion of Horse Breeders Crioulo. Available at <http://marcha.racacrioula. com.br/regulamentos/> Accessed on March 15, 2011.
Balarin M.R.S., Lopes R.S., Kohayagawa A., Laposy C.B. & Fonteque J.H. 2006. Values range Size Distribution of Erythrocytes (RDW) in Thor
-oughbred horses under exercise of different intensities. Braz. J. Vet. Res. Anim. Sci. 43:637-641.
Bayly W.M. & Kline K.A. 2006. Hematología y bioquímica, p.145-151. In: Boffi F.M. (Ed.), Fisiología del Ejercicio en Equinos. Inter-Médica, Bue
-nos Aires.
Boffi F.M. 2006. Metabolismos energéticos y ejercicio, p.3-12. In: Boffi F.M. (Ed.), Fisiología del Ejercicio en Equinos. Inter-Médica, Buenos Aires. Caiado J.C.C., Pissinate G.L., Souza V.R.C., Fonseca L.A. & Coelho C.S. 2011.
Lactacidemia econcentrações séricas de aspartato aminotransferase e creatinoquinase em equinos daraça Quarto de Milha usados em provas de laço em dupla. Pesq. Vet. Bras.31(5):452-458.
Corrêa K.S., Mattoso C.R.S., Silva C.F.G.K.T., Lagos M.S., Takahira R.K. & Lo-pés R.S. 2010. Enzimas musculares e eletrólitos em equinos submetidos a esforço físico prolongado, suplementados com acetato de tocoferol e selênio. Vet. Zootec. 17:85-93.
Di Filippo P.A., Gomide L.M.W., Orozco C.A.G., Giannocaro M.A., Martins C.B. Lacerda-Neto J.C. & Santana A.E. 2009. Alterações hemogasométricas e hidroeletrolíticas de cavalos da raça árabe durante prova de enduro de 60 km. Ciênc. Anim. Bras. 10:840-846.
Dumont C.B.S., Leite C.R., Moraes J.M., Moreira M., Moscardini A.R.C., Go-doy R.F. & Lima E.M.M. 2012. Osmolaridade, ânion gap, potencial hi-drogênionico e íons plasmáticos mensuráveis de equinos Puro Sangue Árabe finalistas em provas de enduro de 90 Km. Pesq. Vet. Bras. 32(6): 542-546
Evans D.L. 2000. Training and Fitness in Athletic Horses. Rural Industries Research and Development Corporation, Barton, Canberra. 64p. Fernandes W.R. & Larsson M.H.M.A. 2000. Alterações nas concentrações
séricas de glicose, sódio, potássio, uréia e creatinina, em equinos sub
-metidos a provas de enduro de30 km com velocidade controlada. Ciên
-cia Rural 30:393-398.
Ferraz G.D.C., Teixeira Neto A.R., D’Angelis F.D.F., Lacerda Neto J.D. & Quei
-roz Neto A.D. 2009. Hematological and cardiac alterations in Arabian horses submitted to incremental effort test in treadmill. Braz. J. Vet. Res. Ani. Sci. 46(6):431-437.
Frape D. 1998. Equine nutrition & feeding. 2nd ed. Blackwell Science, Oxford. 564p.
Hamilton R.W., Hopkins M.B. & Shihabi Z.K. 1989. Myoglobinuria, hemo
-globinuria, and acute renal failure. Clin Chem. 35:1713-1720.
Kaneko J.J., Harvey J.W. & Bruss M.L. 1997. Clinical Biochemistry of Do
-mestic Animals. Academic Press, San Diego. 932p.
Lawrence L. 1994. Nutrition and Athletic Horse, p.205-230. In: Rose R.J. & Hodgson D.R. (Eds), The Athletic Horse:principles and practice of equine sports medicine. W. B.Sauders, Philadelphia.
Martins C.B., Orozco C.A.G., D’angelis F.H.F., Freitas E.V.V., Christovão F.G., Queiroz-Neto A. & Lacerda Neto J.C. 2005. Determination of biochemi
-cal variables in horses before and after participation in endurance race. Revta Bras. Ciênc. Vet. 12:62-65.
Masini P.A., Tedeschi D., Baragli P., Sighieri C. & Lubas G. 2003.
Exercise-induced intravascular haemolysis in standardbred horses. Comp. Clin. Pathol. 12:45-48.
Miranda R.L., Mundim A.V., Saquy A.C.S., Costa A.S., Guimarães E.C., Gon
-çalves F.C. & Silva F.O.C. 2011. Perfil hematológico de equinos submeti
-dos à prova de Team Penning. Pesq. Vet. Bras. 31(1):81-86.
Noleto P.G. 2012. Perfil bioquímico sérico de equinos submetidos a pro
-va de esforço físico. Dissertação de Mestrado, Universidade Federal de Uberlândia, Uberlândia. 49f.
Orozco C.A.G., Martins C.B., Gomide L.M., Queiroz-Neto A. & Lacerda-Neto J.C. 2007. Alteraciones metabólicas durante entrenamiento en equinos de la Raza Pura Sangre Árabe. Revta Med. Vet. 13:77-82.
Orozco C.A.G., Martins C.B., D’Angelis F.H.F., Freitas E.V.V., Christovão F.G., Queiroz Neto A. & Lacerda Neto J.C. 2006. Efeito do exercício sobre variá-veis hematológicas de equinos antes e após participação em prova de enduro de 40 km. Ars Vet. 22(3):179-183.
Procter R.C. 1934. Efficiency of work horses of different ages and body
-weights. Univ. Agr. Exp. Sta. Res. Bull. 209p.
Rose R.J. Arnold K.S. & Church S. 1980. Plasma and sweat electrolyte con
-centrations in the horse during long distance exercise. Eq. Vet. J., New
-market, 12(1):19-22.
Rose R.J. & Hodgson D.R. 1994. Clinical exercise testing, p.246-257. In: Hodgson D.R. & Rose R.J. (Eds), The Athletic Horse. W.B. Saunders, Phila
-delphia.
Sales J.V.F., Dumont C.B.S., Leite C.R., Moraes J.M., Godoy R.F. & Lima E.M.M. 2013. Expressão do Mg+2, CK, AST e LDH em equinos finalistas de pro
-vas de enduro. Pesq. Vet. Bras. 33(1):105-110.
Santiago J.M., Almeida F.Q., Silva L.L.F., Miranda A.C.T., Azevedo J.F., Oliveira C.A.A. & Carrilho S.S. 2013. Hematologia e bioquímica sérica de equinos de concurso completo de equitação em treinamento. Arq. Bras. Med. Vet. Zootec. 65(2):383-392.
variáveis hematológicas e bioquímicas em equinos de salto. Acta Sci Vet. 34:234-44.
Silva M.A.G., Martins C.B., Gomide L.M.W., Albernaz R.M., Queiroz-Neto A. & Lacerda-Neto J.C. 2009. Determinação de eletrólitos, gases sanguí-neos, osmolalidade, hematócrito, hemoglobina, base titulável e anion gap no sangue venoso de equinos destreinados submetidos a exercício máximo e submáximo em esteira rolante. Arq. Bras. Med. Vet. Zootec. 61(5):1021-1027.
Snow D.H., Kerr M.G., Nimmo M.A. & Abbott E.M. 1982. Alterations in blood, sweat, urine and muscle composition during prolonged exercise in the horse. Vet. Rec. 110:377-384.