EVALUATION OF AMMONIA VOLATILIZATION LOSSES BY
ADJUSTED PARAMETERS OF A LOGISTIC FUNCTION
(1)Marcos Lima Campos do Vale(2), Rogério Oliveira de Sousa(3) & Walkyria Bueno
Scivittaro(4)
SUMMARY
The dynamics of N losses in fertilizer by ammonia volatilization is affected by several factors, making investigation of these dynamics more complex. Moreover, some features of the behavior of the variable can lead to deviation from normal distribution, making the main commonly adopted statistical strategies inadequate for data analysis. Thus, the purpose of this study was to evaluate the patterns of cumulative N losses from urea through ammonia volatilization in order to find a more adequate and detailed way of assessing the behavior of the variable. For that reason, changes in patterns of ammonia volatilization losses as a result of applying different combinations of two soil classes [Planossolo and Chernossolo (Typic Albaqualf and Vertic Argiaquolls)] and different rates of urea (50, 100 and 150 kg ha-1 N), in the presence or absence of a urease inhibitor, were evaluated,
adopting a 2 × 3 × 2 factorial design with four replications. Univariate and multivariate analysis of variance were performed using the adjusted parameter values of a logistic function as a response variable. The results obtained from multivariate analysis indicated a prominent effect of the soil class factor on the set of parameters, indicating greater relevance of soil adsorption potential on ammonia volatilization losses. Univariate analysis showed that the parameters related to total N losses and rate of volatilization were more affected by soil class and the rate of urea applied. The urease inhibitor affected only the rate and inflection point parameters, decreasing the rate of losses and delaying the beginning of the process, but had no effect on total ammonia losses. Patterns of ammonia volatilization losses provide details on behavior of the variable, details which can be used to develop and adopt more accurate techniques for more efficient use of urea.
Index terms: urea, soil, multivariate analysis.
(1) Received for publication on April 19, 2013 and approved on October 03, 2013.
(2) Doctorate Student of Agronomy Post-Graduation Program, Soil Department, Faculdade de Agronomia "Eliseu Maciel",
Uni-versidade Federal de Pelotas - PPGA/FAEM/UFPel. Rua Campus Universitário Capão do Leão, s/n. CEP 96900-010 Capão do Leão (RS). E-mail: [email protected]
(3) Professor, FAEM/UFPel. E-mail: [email protected]
(4) Researcher of Brazilian Agricultural Research Enterprise (Embrapa), Temperate Agricultural Research Center (CPACT). BR
RESUMO:AVALIAÇÃO DAS PERDAS POR VOLATILIZAÇÃO DA AMÔNIA POR PARÂMETROS AJUSTADOS DE UMA FUNÇÃO LOGÍSTICA
A dinâmica da perda de N por volatilização da amônia é influenciada por diversos fatores, o que torna complexa sua investigação. Além disso, algumas características do comportamento da variável podem conduzir a uma distribuição não normal, tornando as principais estratégias estatísticas frequentemente adotadas inadequadas para a análise dos dados. Nesse sentido, a proposta deste estudo foi avaliar os padrões das perdas acumuladas de N da ureia por volatilização da amônia, no intuito de se obter uma forma mais adequada e detalhada de avaliar o comportamento da variável. Para tanto, variações nos padrões das perdas por volatilização da amônia, resultantes da aplicação de diferentes combinações de duas classes de solo (Planossolo e Chernossolo) e doses de ureia (50, 100 e 150 kg ha-1 N),
associadas ou não ao uso do inibidor de urease, foram avaliadas, adotando-se um esquema fatorial 2 × 3 × 2 com quatro repetições. Análises univariada e multivariada da variância foram realizadas, utilizando-se os valores ajustados dos parâmetros de um modelo logístico como variável resposta. Os resultados da análise multivariada evidenciaram efeito pronunciado do fator classe de solo sobre o conjunto dos parâmetros, indicando maior relevância do potencial de adsorção do N sobre as perdas por volatilização da amônia. A análise univariada mostrou que os parâmetros relacionados às perdas totais de N e à taxa de volatilização foram mais influenciados pela classe de solo e pela dose de ureia. O inibidor de urease interferiu apenas nos parâmetros de taxa e no ponto de inflexão, reduzindo as taxas de perdas e retardando o início do processo; porém, não teve efeito sobre as perdas totais. Os padrões das perdas por volatilização da amônia fornecem detalhes sobre o comportamento da variável, os quais podem ser utilizados para a adoção e o desenvolvimento de técnicas mais acuradas para melhorar o uso eficiente da ureia.
Termos de indexação: ureia, solo, análise multivariada.
INTRODUCTION
Ammonia volatilization is directly related to potential reduction in the efficiency of nitrogen (N) fertilizers. The N source most affected by ammonia volatilization losses is urea. Its susceptibility arises from molecule hydrolysis by ureases, which consume hydrogen and lead to an increase in pH on neighbor granules, converting ammonium to ammonia, a N form with a higher vapor pressure (Follet & Hatfield, 2008). The dynamics of ammonia volatilization loss can be affected by several factors, making its investigation of them more complex. Although the main strategies employed for data analysis have been useful in studies on ammonia volatilization loss, they do not provide details on the dynamics of the process. The use of mathematical models to investigate the functional association of a variable with a single factor or a given set of factors can provide a more detailed evaluation of a given process (Regazzi, 2003). Even though linear models can provide accurate results, sometimes data fitting through linear regression methods is not possible and nonlinear methods are required. However, fitting of nonlinear regressions requires previous knowledge of mathematical models trained on the dataset. Selection of the best model depends on the features of the variables, and one needs broad knowledge of the phenomena to achieve the best fit (Wild & Seber, 2003).
One of the most recommended variables for characterizing the development of ammonia
volatilization is cumulative loss, due to its easy interpretability. However, in most cases, some aspects of cumulative losses of ammonia can lead to non-normal distribution of the variable. In this respect, fitting data to a mathematical model can be a useful alternative to provide for normal distribution of variables, maintaining the loss of informations to a minimum.
Cumulative ammonia volatilization losses show a large initial growth rate up to a certain point as of which this growth rate decreases gradually, reaching a maximum point. This behavior may be explained by the integral solution of the Verhulst differential equation, which was proposed to evaluate population growth rate under self-limiting conditions. For ammonia volatilization, the self-limiting condition may be considered as the decrease in intensity of process due to the reduction in the diluted ammonia concentration in equilibrium with the ammonium concentration in the soil solution.
applied to cumulative ammonia volatilization data. However, this requires a good understanding of the physical meanings of parameters in order to properly address factor effects.
Thus, this study aimed to evaluate the suitability of performing univariate and multivariate analysis of variance using the adjusted parameters of a logistic function as an indirect response variable in the assessment of ammonia losses. The effects of the amount of urea applied, the addition of a urease inhibitor and the different soil classes on cumulative ammonia volatilization losses, as well as the ability of this analysis strategy to provide details regarding the dynamics of the process were evaluated.
MATERIALS AND METHODS
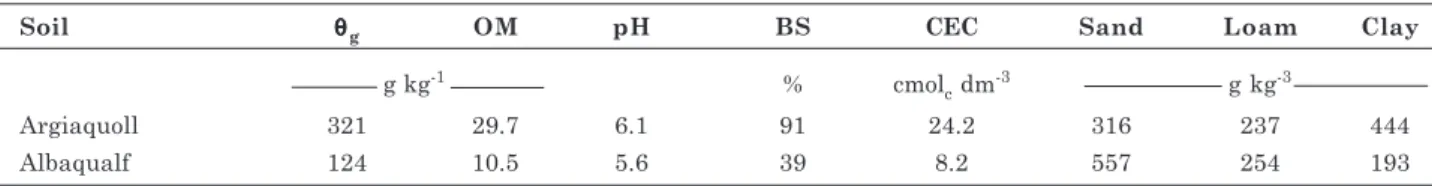
The experiment was conducted under laboratory conditions at the Embrapa Clima Temperado (Embrapa Temperate Climate Center) located in Pelotas, RS, Brazil. Soil samples of a Planossolo Haplico eutrófico solódico and a Chernossolo Ebânico carbonático vertissólico (Embrapa, 2006), corresponding to a Typic Albaqualf and a Vertic Argiaquolls (USDA, 1999), respectively, were taken from the first 10-cm soil layer. The soil samples were taken to the laboratory, dried at 40 oC in a forced air circulation laboratory oven for 48 h and sieved through a 2 mm mesh. Subsamples were taken for physicochemical characterizations (Table 1). One day before the application of treatments, samples were moistened and left to rest. Immediately before the application, the soil samples were blended and subsamples were taken for moisture determination.
Treatments were combinations of the amounts of applied urea, the presence or absence of the urease inhibitor N-(n-butyl) thiophosphoric triamide (NBTPT) or Agrotain® (registered trademark) and soil class levels on a 2 × 3 × 2 factorial design with four replications. For treatments with the addition of urease inhibitor, NBTPT was applied to urea at a ratio of 1:1000 (NBTPT:urea), as indicated by the manufacturer, one day before beginning the study. Urea was surface applied at amounts of 0.07, 0.14 and 0.21 mg/bottle, equivalent to 50, 100 and 150 kg ha-1
of N, respectively.
Cumulative ammonia volatilization losses were evaluated by the close and static method, described
by Dal Canton (2005). Experimental units were set up by placing 300 g of soil into glass bottles with an average diameter of 8.9 cm, average area of 0.00633 m2 and
average height of 15 cm. A plastic cup containing a mixture of 10 mL of 0.36 mol L-1 boric acid and four
drops of bromocresol green/methyl red pH mixed indicators was added to each experimental unit. The cups were positioned on a small tripod to be kept at approximately 4-cm above the soil surface. At each observation interval, the cups were replaced and immediately titrated with 0.0714 mol L-1 hydrochloric
acid. The amount of acid required for titration was converted to amount of ammoniacal-N in mg/bottle by equation 1:
Ammoniacal-N = (Read - Blank) × 0.9996 (1) where Read is the amount of hydrochloric acid required for each sample, Blank is the blank proof and the constant 0.9996 is the product of the molarity of acid and the molar mass of N.
The observation intervals of volatilized ammonia were 1, 4, 7, 10, 12, 15, 17, 20, 24 and 31 days after urea application for the Argiaquoll samples; and 1, 2, 4, 6, 8, 10, 14, 17, 21 and 31 days for the Albaqualf samples. These were the intervals required for a change in the color of the boric acid in most of the experimental units. The dataset observed in each experimental unit was adjusted to a sigmoid function through the Gauss-Newton iterative method using the “nlrwr” package of R software (Ritz & Streibig, 2008). The sigmoid function used was the solution of the Verhulst equation, written as equation 2 in order to specify the asymptote, rate and inflection point parameters, which were considered sufficient to manifest the effects of the experimental factors evaluated on the patterns of cumulative ammonia volatilization losses:
(
)
(
)
(
0)
(
0)
0
0 Pt t
B t t P 1 A t t d t t dP -ú û ù ê ë
é -
-=
-(2)
where P is the cumulative amount of volatilized ammonia at a given time; t is the time unit; to is a
reference time for which
(
(
)
)
0t t d t t dP 0 0 =
, A is the
rate of ammonia volatilization and B is the maximum cumulative ammonia volatilization loss.
The sigmoid function (Equation 3) was obtained by application of separation of variables, partial fractions and substitution techniques to equation 2:
Soil θθθθθ
g OM pH BS CEC Sand Loam Clay
g kg-1 % cmolc dm-3 g kg-3
Argiaquoll 321 29.7 6.1 91 24.2 316 237 444
Albaqualf 124 10.5 5.6 39 8.2 557 254 193
Table 1. Gravimetric soil moisture (θθθθθg), soil organic matter (OM), pH, base saturation (BS), cation exchange
(
0)
A(t t )0 e 1
B t
t
P -
-+ =
- (3)
Normal approximation of cumulative ammonia losses and the adjusted parameter dataset were verified by a Kolmogorov-Smirnov test (α=0.01) using
the Winstat software (Machado & Conceição, 2007). The amount of information lost due to data fitting was evaluated by its root mean square error (RMSE). Statistical model effects were evaluated by univariate and multivariate analysis of variance, using the parameter values of the adjusted function as indirect response variables. When significant effects were observed, means were compared by univariate and multivariate orthogonal contrasts for the hypotheses of interest. Analyses of variance and orthogonal contrasts were also performed with the R software (R. Core Team, 2012).
RESULTS AND DISCUSSION
The Kolmogorov-Smirnov test indicated a non-normal approximation of the residuals of cumulative ammonia volatilization loss (Table 2). Ammonia stability can be greatly affected by small changes in factors that control the variable's behavior, resulting in considerable differences in observed results taken from the same population. This feature is reflected in the high values of the coefficient of variation observed in several studies (Lara Cabezas & Souza, 2008; Pereira et al., 2009; Fontoura & Bayer, 2010), which can be regarded as evidence of the non-normality of the variable. Thus, analysis of variance and multiple comparisons or orthogonal contrasts, which assume normal distribution of the dataset, should not be used with data on cumulative ammonia volatilization loss. However, the Kolmogorov-Smirnov test (Table 2) indicated a normal approximation of the residues of the adjusted parameters of the logistic function, which was expected, since the symmetry function maintains
the variables less dispersed within the same population.
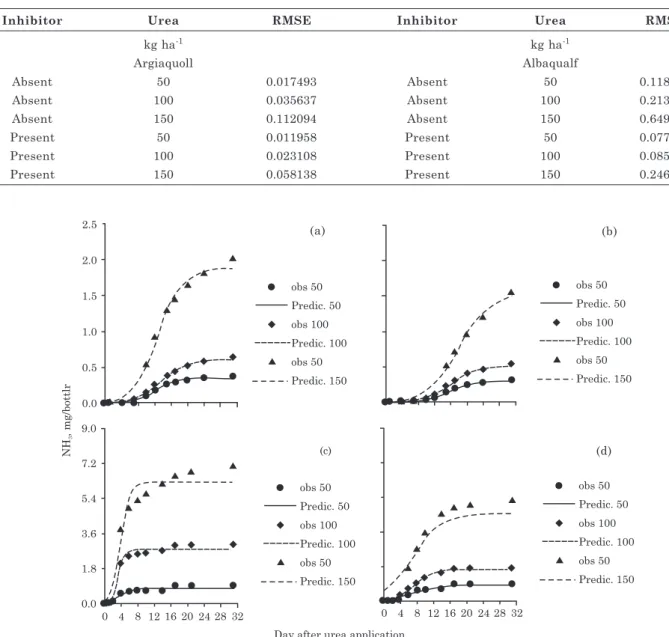
The average root mean square errors (RMSE) of each treatment, arising from model fitting, are shown in table 3. The results show little information loss due to adoption of the predicted values rather than observed values, as can be seen in figure 1. These figures show observed and predicted average values. In this regard, model adjusted parameters can be regarded as efficient indicators of changes in ammonia volatilization loss patterns, allowing them to be used as indirect responses to evaluate differences among populations through the aforementioned analytical techniques.
Even though both data adjustments may be considered as adequate, a higher value of RMSE for Albaqualfs may be observed. For this soil, the ammonia volatilization loss patterns showed a slight asymmetry, with a higher curvature in the concave phase of the model. This behavior seemed to be related to soil texture since the ammonium may be quickly converted to ammonia due to its poor interaction with the colloidal phase of Albaqualfs. Under this condition, the more urea applied, the greater the curvature in the concave phase of the models (Figure 1c,d).
The results of multivariate analysis of variance (MANOVA) are shown in table 4. Triple factor interaction significance was not observed. Double factor interaction significance was observed for the soil class × amount of urea and soil class × urease inhibitor interactions. The lower value of Wilk’s Lambda statistic indicated a greater magnitude of the soil class × amount of urea interaction.
The data presented in table 5 show the results of multivariate orthogonal contrasts. Comparisons between levels of amount of urea applied for Argiaquoll showed significant differences only at the highest level (150 kg ha-1 N). For Albaqualfs, significant differences
were observed for all amounts of urea. Comparisons between soil classes showed significant differences at all levels for amount of urea applied. For soil class
Soil class Variable Kolmogorov-Smirnov
Statistic n(2) p(2)
Argiaquoll Cumulative NH3 losses 0.23705 308 1.590 E -15
Albaqualf Cumulative NH3 losses 0.17643 308 8.642 E - 9
Argiaquoll Adjusted parameter B(1) 0.07300 24 0.99918
Argiaquoll Adjusted parameter A(1) 0.10267 24 0.94987
Argiaquoll Adjusted parameter t0(1) 0.10022 24 0.95901
Albaqualf Adjusted parameter B 0.15199 24 0.59450
Albaqualf Adjusted parameter A 0.20958 24 0.21022
Albaqualf Adjusted parameter t0 0.27407 24 0.04254
Table 2. Normal approximation of cumulative ammonia volatilization losses and logistic function parameters (A, B and t0) adjusted by the Kolmogorov-Smirnov test for the two soil classes evaluated in the study
(1) B: maximum culmulative ammonia volatilization loss, A: maximum rate of ammonia volatilization, t
0: inflection point of
comparisons within the inhibitor levels and inhibitor presence or absence within the soil class levels, the orthogonal contrasts showed significant differences regardless of the associated factor level. The Wilk’s Lambda statistics values of multivariate orthogonal contrasts showed a prominent effect of the soil class factor, highlighting the relevance of the soil colloidal phase and dissolved ammonium interactions on ammonia volatilization losses (Watson et al., 1994; Antisari et al., 1996; Sangoi et al., 2003; Costa et al., 2004; Shi-Chao et al., 2011).
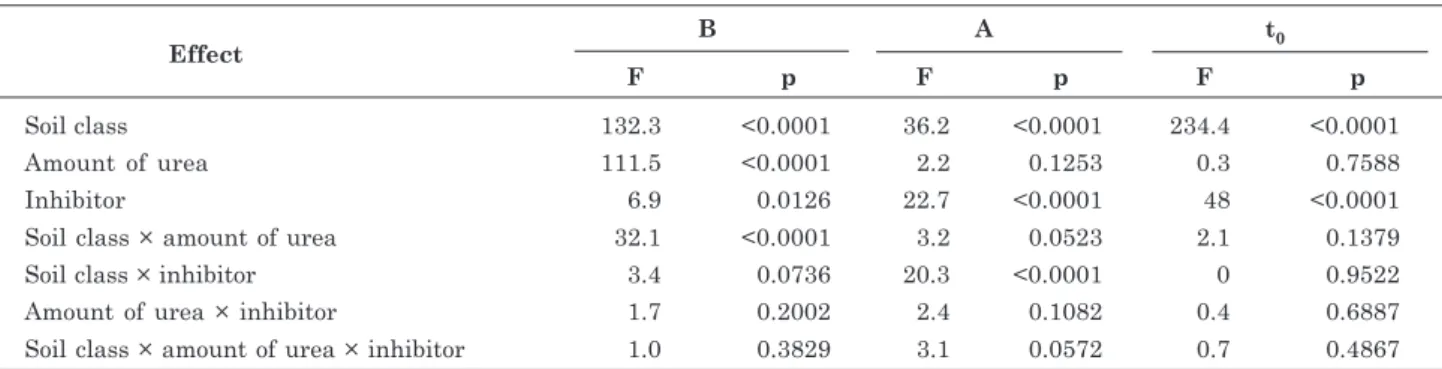
The results of univariate analysis of variance (ANOVA) for each model parameter are shown in table 6. A significant effect of the soil class × amount
Inhibitor Urea RMSE Inhibitor Urea RMSE
kg ha-1 kg ha-1
Argiaquoll Albaqualf
Absent 50 0.017493 Absent 50 0.118512
Absent 100 0.035637 Absent 100 0.213717
Absent 150 0.112094 Absent 150 0.649577
Present 50 0.011958 Present 50 0.077285
Present 100 0.023108 Present 100 0.085994
Present 150 0.058138 Present 150 0.246982
Table 3. Average root mean squared error (RMSE) from model adjustment by the Gauss-Newton iterative method for each treatment
Effect Wilk’s Lambda p
Soil class 0.097645 <0.0001
Amount of urea 0.119280 <0.0001
Inhibitor 0.396671 <0.0001
Soil class × amount of urea 0.294373 <0.0001 Soil class × inhibitor 0.581493 0.0003 Amount of urea × inhibitor 0.783227 0.2007 Soil class × amount of
urea × inhibitor 0.804068 0.2666
Table 4. Wilk’s Lambda statistic and the probability “p” of the approximate F statistic for the hypothesis tests by MANOVA
Day after urea application obs 50
Predic. 50
obs 100
Predic. 100
obs 50
Predic. 150 obs 50
Predic. 50
obs 100
Predic. 100
obs 50
Predic. 150
obs 50
Predic. 50
obs 100
Predic. 100
obs 50
Predic. 150 obs 50
Predic. 50
obs 100
Predic. 100
obs 50
Predic. 150
9.0
7.2
5.4
3.6
1.8
0.0 2.5
2.0
1.5
1.0
0.5
0.0
NH
, mg/bottlr3
0 4 8 12 16 20 24 28 32 0 4 8 12 16 20 24 28 32 (c)
Figure 1. Observed (obs) and predicted (Predic.) cumulative ammonia volatilization losses in mg/bottle for 50, 100 and 150 kg ha-1 N applied as urea, in the absence (a,c) and presence (b,d) of urease inhibitor
(NBTPT) for Argiaquoll (a,b) and Albaqualf (c,d).
(a) (b)
of urea interaction may be seen for the asymptotic parameter “B”. For the rate parameter “A”, significant differences were observed in the soil class × urease inhibitor interaction. For its part, the inflection point parameter “t0” shows significant differences for the
main effects of soil class and urease inhibitor, making comparisons by orthogonal contrast unnecessary. For this parameter, the lowest means were observed for Albaqualfs and absence of urease inhibitor factor levels data not presented.
The results of univariate orthogonal contrasts for each model parameter are presented in table 7. Comparisons between levels of urea within each soil class by univariate orthogonal contrasts were similar to those observed for the multivariate case for the asymptotic parameter “B”. When comparing soil classes within each amount of urea, significant differences were observed for all but the 50 kg ha-1 N
level. For rate parameter “A”, significant effects for comparisons of urease inhibitor were observed only for Albaqualfs. Comparisons between soil classes were
significantly different only in the absence of urease inhibitor.
The pattern of ammonia volatilization loss seems to follow the communicating vessels principle, being more sensitive to adsorption phenomena until there is a threshold of dissolved ammonium concentration where the amount of N applied becomes more relevant. According to Adamson & Gast (1997), in the vicinity of the colloid surface, physical interactions take place earlier than chemical reactions because of reduction in internal energy of the ion due the electrically charged atmosphere of the colloid.
This soil colloid effect was observed in many studies. Watson et al. (1994) found a strong negative correlation between cation exchange capacity (CEC) and ammonia volatilization losses. In a similar manner, soils with a higher CEC showed lower amounts of volatilized ammonia after urea application in studies developed by Antisari et al. (1996), Sangoi et al. (2003) and Costa et al. (2004).
Contrast
Mean(1)
Wilk’s Lambda p
B A t0 B ’ A’ t0'
Argiaq 50 vs Argiaq 100 0.33 0.421 14.1 0.56 0.352 14.9 0.95767 0.6842
Argiaq 50 vs Argiaq 150 0.33 0.421 14.1 1.73 0.350 15.8 0.57243 0.0002
Argiaq 100 vs Argiaq 150 0.56 0.352 14.9 1.73 0.350 15.8 0.68398 0.0044
Albaq 50 vs Albaq 100 0.84 0.730 6.9 2.21 1.185 5.9 0.57933 0.0003
Albaq 50 vs Albaq 150 0.84 0.730 6.9 5.61 0.792 5.9 0.12500 <0.0001
Albaq 100 vs Albaq 150 2.21 1.185 5.9 5.61 0.792 5.9 0.19915 <0.0001
Argiaq 50 vs Albaq 50 0.33 0.421 14.1 0.84 0.730 6.9 0.39759 <0.0001
Argiaq 100 vs Albaq 100 0.56 0.352 14.9 2.21 1.185 5.9 0.25342 <0.0001
Argiaq 150 vs Albaq 150 1.73 0.350 15.8 5.61 0.792 5.9 0.12754 <0.0001
Argiaq Pres vs Albaq Pres 0.80 0.363 16.9 2.49 0.496 8.2 0.17674 <0.0001
Argiaq Pres vs Argiaq Abs 0.80 0.363 16.9 0.94 0.386 13.0 0.56490 0.0002
Albaq Pres vs Albaq Abs 2.49 0.496 8.2 3.28 1.308 4.3 0.40478 <0.0001
Table 5. Means of parameters, Wilk’s Lambda statistics and probability “p” of the approximate F statistic of multivariate orthogonal contrasts for the hypotheses of interest
(1) B: maximum cumulative ammonia volatilization loss, A: maximum rate of ammonia volatilization, t
0: inflection point of
function. Means of the parameters with an apostrophe are related to the second term of the contrast.
Effect
B A t0
F p F p F p
Soil class 132.3 <0.0001 36.2 <0.0001 234.4 <0.0001
Amount of urea 111.5 <0.0001 2.2 0.1253 0.3 0.7588
Inhibitor 6.9 0.0126 22.7 <0.0001 48 <0.0001
Soil class × amount of urea 32.1 <0.0001 3.2 0.0523 2.1 0.1379
Soil class × inhibitor 3.4 0.0736 20.3 <0.0001 0 0.9522
Amount of urea × inhibitor 1.7 0.2002 2.4 0.1082 0.4 0.6887
Soil class × amount of urea × inhibitor 1.0 0.3829 3.1 0.0572 0.7 0.4867
Table 6. F statistics and “p” probability of hypothesis tests by ANOVA for each model parameter
(1) B: maximum population size, A: maximum rate of population growth, t
In addition, a high CEC leads to a slow release of ammonium to the soil solution due to the adsorption phenomenon, decreasing the intensity of ammonia volatilization, as may be seen by the significant effects of soil class on the rate “A” and inflection point “t0” parameters.
Although collision theory describes that the reactant concentration affects the speed of product formation, the urea concentrations used in this study may not have been enough to affect the speed of ammonium to ammonia conversion since the amount of urea did not affect the rate “A” and inflection point “t0” parameters (Table 6). For the NBTPT, the lack
of observed effect on total losses was expected, due to inhibitor mechanisms and microbial needs. Even if one considers that the NBTPT inactivates a portion of the urease molecules already released in the soil solution, the microorganisms still release the enzyme to convert complex N compounds into ammonium, in order to fulfill their nitrogen metabolic requirements (McGill, 2007). Initial reduction in active urease concentrations decreases the release of ammonium, which delays the exponential phase beginning in the process and reduces the rate of ammonium to ammonia conversion, as may be seen by the significant effects of the inhibitor factor on the inflection point parameter “t0” and the rate parameter
“A”, respectively (Table 6).
The results observed in the present study suggest that more attention should be paid to ammonium and soil colloidal phase interactions when assessing patterns of cumulative ammonia volatilization loss. Comparing the parameter values of the two soil class curves (Table 1), one can see a delayed and less intense overall reaction for Argiaquolls. Such a condition may make the strategies for minimizing ammonia
Contrast B B ’ F p
Argiaq 50 vs Argiaq 100 0.33 0.56 0.60 0.4423
Argiaq 50 vs Argiaq 150 0.33 1.73 21.31 <0.0001
Argiaq 100 vs Argiaq 150 0.56 1.73 14.74 0.0005
Albaq 50 vs Albaq 100 0.84 2.21 20.57 <0.0001
Albaq 50 vs Albaq 150 0.84 5.61 247.89 <0.0001
Albaq 100 vs Albaq 150 2.21 5.61 125.64 <0.0001
Argiaq 50 vs Albaq 50 0.33 0.84 2.82 0.1019
Argiaq 100 vs Albaq 100 0.56 2.21 29.56 <0.0001
Argiaq 150 vs Albaq 150 1.73 5.61 164.02 <0.0001
A A’
Argiaq Pres vs Argiaq Abs 0.363 0.386 0.03 0.8554
Albaq Pres vs Albaq Abs 0.496 1.308 42.87 <0.0001
Argiaq Pres vs Albaq Pres 0.363 0.496 1.15 0.2904
Argiaq Abs vs Albaq Abs 0.386 1.308 55.31 <0.0001
Table 7. Means, F statistics and “p” probability of univariate orthogonal contrasts for the hypotheses of interest
Means of the parameters with an apostrophe are related to the second term of the contrast.
volatilization losses less efficiency for this soil class. Nevertheless, adopting such strategies may be essential for improving urea efficiency as a N source for Albaqualfs since the process started with high intensity soon after fertilizer application, with a high amount of losses in a short time (Figure 1c,d). Such distinct behavior was also observed in some studies carried out to assess the effect of NBTPT on ammonia volatilization losses (Bremner & Chai, 1986; Carmona et al., 1990; Antisari et al., 1996; Watson, 2000; Sangoi et al., 2003; Chakrabarti et al., 2004; Scivittaro et al., 2010).
The agreement between the effects of the statistical models observed in the present study and those observed by several other studies supports the use of the adjusted parameters as an indirect variable for assessing losses by ammonia volatilization. Although we have adopted the integral solution of the Verhulst differential equation, other logistic models could also be used to adjust the datasets of cumulative ammonia volatilization loss, as was performed by Demeyer et al. (1995). However, even though more flexible models can often be better fitted to a dataset, they also require a greater number of parameters, hindering physical interpretations. Thus, in addition to minimizing errors, one should take the ability to provide useful information into account when choosing a model to assess ammonia volatilization losses.
performance of the variable was expressed by the combination of the parameter values of the model, the adoption of a latent variable considering both the dispersion and correlation of the parameters in MANOVA allowed evaluation of the general effects of a factor.
The understanding of such combined information can reveal the specific effect of a given factor and its contribution to the process as a whole. In this study, for the effect of soil class, the general effect on ammonia volatilization performance was confirmed by the factor effect in all individual parameters. In contrast, the similarity between the NBTPT effects in multivariate analysis and univariate analysis for the rate parameter “A” suggests that its differential behavior for distinct soil classes was mainly related to the potential decrease in the overall reaction intensity. Moreover, the global effect of the amount of urea was similar to that observed for the asymptotic parameter “B”, suggesting that even with such a factor being relevant to the process as a whole, it was not related to the intensity of the process but only to the total losses.
Therefore, the data analysis strategy used can provide a better understanding of the impact of some changes in the system on patterns of ammonia volatilization loss. Such an understanding is essential for adopting and formulating more suitable techniques to prevent large nitrogen losses by ammonia volatilization, improving the efficiency of the urea used as a nitrogen source for crops.
CONCLUSIONS
1. Data analysis using the adjusted parameters of a logistic function as an indirect response variable is an adequate strategy for evaluating the effects of amount of urea applied, urease inhibitor and soil class on cumulative ammonia volatilization losses.
2. The evaluation of cumulative ammonia volatilization losses by adjusted parameters of a logistic function allows the understanding of factor-specific effects and their importance to the overall performance of the variable, constituting a valuable tool for assessing the dynamics of the process.
ACKNOWLEDGMENTS
The authors are grateful to the CNPq for fellowships to ROS (research productivity) and MLCV Doctorate. The authors are also grateful to Embrapa for its support and its grants to WBS. The authors thank Prof. Antonio Costa de Oliveira for suggestions regarding the English language.
LITERATURE CITED
ADAMSON, A.W. & GAST, A.P. Physical chemistry of surfaces. 6.ed. Toronto, John Wiley & Sons, 1997. 784p. ANTISARI, L.V.; MARZADOORI, C.; GIOACCHINI, P.;
RICCI, S. & GESSA, C. Effects of the urease inhibitor N-(n-butyl) phosphorothioic triamide in low concentration on ammonia volatilization and evolution of mineral nitrogen. Biol. Fert. Soils, 22:196-201, 1996. BREMNER, J.M. & CHAI, H.S. Evaluation of N-butyl phosphorothioic triamide for retardation of urea hydrolysis in soil. Commun. Soil Sci. Plan. Anal., 17:337-351, 1986.
CARMONA, G.; CHRISTIANSON, C.B. & BYRNES, B.H. Temperature and low concentration effects of the urease inhibitor N(n-butyl) thiophosphoric triamide (nBTPT) on ammonia volatilization from urea. Soil Biol. Biochem., 22:933-937, 1990.
CHAKRABARTI, K.; SINHA, N.; CHAKRABORTY, A. & BHATTACHARYYA, P. Influence of soil properties on urease activity under different agro-ecosystems. Arch. Agron. Soil Sci., 50:477-483, 2004.
COSTA, A.C.S.; FERREIRA, J.C.; SEIDEL, E.P.; TORMENA, C.A. & PINTRO, J.C. Perdas de nitrogênio por volatilização da amônia em três solos argilosos tratados com ureia. Acta Sci. Agron., 26:467-473, 2004. DAL CANTON, D. Volatilização da amônia proveniente da
ureia e do sulfato de amônio em solo alagado. Pelotas, Universidade Federal de Pelotas, 2005. 55p. (Dissertação de Mestrado)
DEMEYER, P.; HOFMAN, G. & CLEEMPUT VAN, O. Fitting ammonia volatilization dynamics with a logistic equation. Soil Sci. Soc. Am. J., 59:261-265, 1995. EMPRESA BRASILEIRA DE PESQUISA AGROPECUÁRIA
- EMBRAPA. Sistema brasileiro de classificação de solos. 2.ed. Rio de Janeiro, 2006. 306p.
FOLLET, R.F. & HATFIELD, J.L. Nitrogen in the environment: Sources, problems and management. 2.ed. Amsterdam, Elsevier, 2008. 702p.
FONTOURA, S.M.V. & BAYER, C. Ammonia volatilization in no-till in the south-central region of the state of Paraná, Brazil. R. Bras. Ci. Solo, 34:1677-1684, 2010. LARA CABEZAS, A.R. & SOUZA, M.A. Volatilização de
amônia, lixiviação de nitrogênio e produtividade de milho em respostas à aplicação de misturas de uréia com sulfato de amônia ou gesso agrícola. R. Bras. Ci. Solo, 32:2331-2342, 2008.
MACHADO, A.D.A. & CONCEIÇÃO, A.R. WinStat - Sistema de análise estatística para Windows. 2007.
PEREIRA, H.S.; LEÃO, A.F.; VERGINASSI, A.; CARNEIRO, M.A.C. Ammonia volatilization of urea in the out-of-season corn. R. Bras. Ci. Solo, 33:1685-1694, 2009. R CORE TEAM. R: A language and environment for statistical
computing. Available at: <http://www.R-project.org/>. Accessed on: Jul 7, 2012.
REGAZZI, J.A. Teste para verificar a igualdade de parâmetros e a identidade de modelos de regressão não linear. R. Ceres, 50:9-26, 2003.
RITZ, C. & STREIBIG, J.C. Nonlinear regression with R. New York, Springer, 2008. 148p.
SANGOI, L.; ERNANI, P.R.; LECH, V.A. & RAMPAZZO, C. Volatilização de N-NH3 em decorrência da forma de
aplicação de ureia, manejo de resíduos e tipo de solo, em laboratório. Ci. Rural, 33:687-692, 2003.
SCIVITTARO, W.B.; GONÇALVES, D.R.N.; VALE, M.L.C. & RICORDI, V.G. Perdas de nitrogênio por volatilização de amônia e resposta do arroz irrigado à aplicação de ureia tratada com o inibidor de urease NBPT. Ci. Rural, 40:1283-1289, 2010.
SHI-CHAO, Y.; ZHONG-CHENG, L.; QI-GEN, D.; YU-SHU, J.; HAI-YAN, G.; JING-DOU, C.; LU-SHENG, X.; FU-GUAN, W.; HONG-SHENG, Z.; ZHONG-YANG, H.; KE, X. & HAI-YAN, W. Effects of nitrogen application rate on ammonia volatilization and nitrogen utilization in rice growing season. Chinese J. Rice Sci., 25:71-79, 2011. UNITED STATES DEPARTAMENT OF AGRICULTURE
-USDA. Soil taxonomy: A basic system of soil classification for making and interpreting soil surveys. 2.ed. Washington, D.C., 1999. 871p.
WATSON, C.J. Urease activity and inhibition: Principles and practice. Paris, International Fertilizer Industry Association, 2000. 40p.
WATSON, C.J.; MILLER, H.; POLAND, P.; KILPATRIC, D.J.; ALLEN, M.D.B.; GARRET, M.K. & CHRISTIANSON, C.B. Soil properties and the ability of the urease inhibitor N(n-butyl) thiophosphoric (nBPT) to reduce ammonia volatilization from surface-applied urea. Soil Biol. Biochem., 26:1165-1171, 1994.