____________________________________
1 Doutoranda em Recursos Hídricos e Saneamento Ambiental. UNIOESTE/CASCAVEL/CCET/ PGEAGRI/RHESA, Cascavel - PR,
Fone: (0XX45) 3220.3262, [email protected].
2 Pesquisador em Recursos Hídricos e Saneamento Ambiental. UNIOESTE/CASCAVEL/CCET/ PGEAGRI/RHESA, Cascavel - PR,
Fone: (0XX45) 3220.3262, [email protected].
3 Pesquisador em Recursos Hídricos e Saneamento Ambiental. UFCG, Campina Grande - PB, [email protected].
4 Pesquisador em Recursos Hídricos e Saneamento Ambiental. UNIOESTE/CASCAVEL/CCET/ PGEAGRI/RHESA, Cascavel - PR,
Fone: (0XX45) 3220.3262, [email protected].
5 Doutorando em Recursos Hídricos e Saneamento Ambiental. UNIOESTE/CASCAVEL/CCET/PGEAGRI/RHESA, Cascavel - PR,
Fone: (0XX45) 3220.3262, [email protected]. Recebido pelo Conselho Editorial em: 5-4-2010 Aprovado pelo Conselho Editorial em: 4-3-2011
CURVE OF SUSPENDED SEDIMENTS
KAYLA POLETTO1, SILVIO C. SAMPAIO2, MANOEL M. F. DE QUEIROZ3, BENEDITO M. GOMES4, ROSIMALDO SONCELA5
ABSTRACT: Understanding hydrosedimental behavior of a watershed is essential for properly managing and using its hydric resources. The objective of this study was to verify the feasibility of the alternative procedure for the indirect determination of the sediment key curve using a turbidimeter. The research was carried out on the São Francisco Falso River, which is situated in the west of the state of Paraná on the left bank of ITAIPU reservoir. The direct method was applied using a DH-48 sediment suspended sampler. The indirect method consisted of the use of a linigraph and a turbidimeter. Based on the results obtained, it was concluded that the indirect method using a turbidimeter showed to be fully feasible, since it gave a power function-type mathematical model equal of the direct method. Furthermore, the average suspended sediment discharge into the São Francisco Falso River during the 2006/2007 harvest was calculated at 7.26 metric t day-1.
KEYWORDS: watershed, hydrosedimentalogy, agriculture.
TURBIDÍMETRO COMO MÉTODO ALTERNATIVO NA DETERMINAÇÃO DA CURVA-CHAVE DE SEDIMENTOS EM SUSPENSÃO
RESUMO: O conhecimento do comportamento hidrossedimentológico de uma bacia hidrográfica é fundamental para a adequada gestão e uso de seus recursos hídricos. Este trabalho teve o objetivo de verificar a viabilidade de se determinar indiretamente a curva-chave de sedimentos usando como alternativa um turbidímetro. O trabalho foi desenvolvido no Rio São Francisco Falso, situado no oeste do Paraná, na margem esquerda do lago de ITAIPU. O método direto foi realizado usando o molinete e amostrador de sedimentos em suspensão DH-48. O método indireto consistiu no uso de linígrafo e turbidímetro. A partir dos resultados obtidos, foi possível concluir que o método indireto usando um turbidímetro apresentou-se plenamente viável, pois encontrou-se modelo matemático do tipo potencial igual ao método direto. Determinou-se ainda que a descarga média de sedimentos em suspensão no Rio São Francisco Falso, no ano agrícola de 2006/2007, foi de 7,26 t dia-1.
PALAVRAS-CHAVE: bacia hidrográfica, hidrossedimentologia, agricultura.
INTRODUCTION
The quantification of sediments present in water bodies is the initial step for preventing and controlling problems caused by sediments deposition (CHELLA et al., 2005). A technique to quantify these sediments is the determination of the solid discharge, which is characterized mostly by the estimation of the quantity of suspended sediments that pass through a transversal section per unit of time (LIMA & SILVA, 2007; LIMA, SILVA & CARVALHO, 2006). In most watercourses, this portion in suspension represents more than 90% of the total sediment discharge (CARVALHO, et al., 2000).
If suspended sediments were uniformly distributed in the section, a sample at any point would be sufficient to estimate its concentration. However, since this is not the case, it is necessary to consider the variations of concentration along the measurement profile. For this reason, it is necessary to take point samples along the section at an adequate number of sites in order to estimate the average concentration of the sediments transported in a water body. Vertical integration sampling method allows the determination of the concentration and the average vertical granulometric distribution. As for integration sampling, samples are collected over a certain period of time, normally greater than 10 s, making it possible to determine the average concentration, which is more representative than point sampling (CARVALHO, et al., 2000).
Sediment transportation curves relate sediment concentration, sediment discharge, or values derived from sedimentologic studies in general, with other variables, such as time, water discharge, water level, depth, speed, and others derived from related studies. The best-known of these correlations is the sediment key curve, which relates the suspended sediment discharge to the water flow, which is also called water discharge. However, it is important to remember that as in nature there is a distinct amount of suspended sediment discharge for each flow at a given time, it is possible to conclude that the key curve cannot replace the actual reliable values, since this phenomenon is rather random. Therefore, the sediment rating curve allows the indirect determination of mean levels; the larger the number of sampling sites, the more significant it is and the greater the flow variation of reached between the minimum and maximum levels. Another limitation is the difficulty in obtaining suspended sediment data by means of point sampling. A way to overcome this difficulty is correlating turbidity with the suspended sediment concentration, which makes plotting the rating curve more practical. However, it requires specific studies of the water body (TOMAZONI et. al.; 2005; TEIXEIRA & SENHORELO, 2000; CARVALHO, PARANHOS & PAIVA, 2004).
Despite the limitations, the use of sediment rating curves is very common when daily flow and suspended sediment data are available for the estimation of the average annual sediment discharge, especially in watersheds with intense anthropic activity, such as agriculture, which may result in the transport of sediment particles to the water bodies. The west region of Paraná is a good location for studies of this type because of its intense agricultural and agroindustrial activities.
To this end, the objectives of this study were as follows: to assess the suspended sediment discharge using the sediment rating curve for the São Francisco Falso River by means of the direct method and an indirect method based on the correlation between turbidity and sediment concentration.
MATERIAL AND METHODS
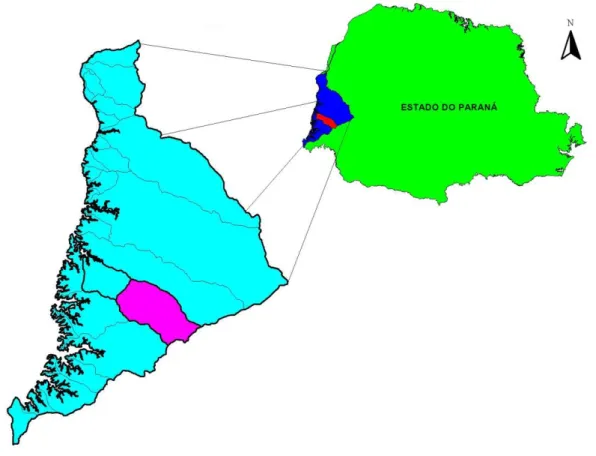
The São Francisco Falso River is 59.78 km long, is located in the state of Paraná, has a watershed of 520.96 km², a perimeter of 103.44 km, and is part of the Paraná III watershed (Figure
1). It is located within the rectangle formed by coordinates: latitude φ = -24º 56’ 21”; -25º 11’ 55”,
and longitude λ = -53º 48’ 42”; -54º 09’ 07”. The cartographic data of the watershed were plotted
FIGURE 1. São São Francisco Falso watershed and its localization in the state of Paraná.
The values of the physiographic characteristics of the São Francisco Falso watershed (Table 1) demonstrate reveal a good drainage system in relation to the main river in the order 4. The form parameters (shape factor, compactness index, and conformity index) are characteristic of an elongated watershed with low declivity from the main river, and a high watershed area greater than 500 km², indicating a watershed with low susceptibility to floods despite the developed drainage system (PORTO et al., 1999).
TABLE 1. Physiographic characterization of the São Francisco Falso River Watershed.
Parameters Indexes
Perimeter 103.44 km
Area 520.96 km²
Form Factor (FF) 0.42
Compactness Index (Kc) 1.27
Conformity Index (Fc) 0.32
Maximum elevation 680 m
Minimum elevation 260 m
Hypsometry (∆H) 420 m
Axial length 40.05 km
Length of the main river 59.78 km
Declivity of the main river course (S1) 7.03 m km־¹
Water course density (Ds) 0.28
Drainage density (Dd) 0.85 km km־²
Order of the main river 4th
The sediment rating curve is the association between the water discharge and the sediment discharge. The water discharge was determined using the hydrometric windlass method. The sediment discharge was determined using the mass balance equation that correlates the water discharge with the sediment concentration measured directly on the site. It should be noted that the sediment concentration at the sampling site was determined by the method of the Brazilian Water Agency and a DH-48 sampler. The methodology details are presented below.
The water flow data were obtained at the monitoring station in the control section. Data were collected mostly in the months of November/2006, December/2006, and January/2007. These months were chosen because this is the summer planting period in the region for soybean and corn under no-tillage management. In the evaluated period, the soil was tilled and left bare, being greatly exposed to rainfall.
The river flow was determined using the continuity equation concept for permanent drainage, which directly correlates flow with the product of the wet section area and the mean flow velocity. The wet section was estimated using by bathymetry and the average velocity by the hydrometric windlass technique.
The average drainage velocity was estimated at each vertical mark on a steel cable with a hydrometric windlass MLN-7 and a pulse counter. Based on the pulse count of each sampling point at a fixed time of 40 s, it was obtained the number of rotations per second, which, applied to one of the hydrometric windlass equations (Table 2), resulted in the sub-section flow velocity.
TABLE 2. General hydrometric windlass equations.
N Equation R²
≤ 0.65 v =0.027351188 + 0.224036774 N 0.9994
>0.65 v = 0.015424907 + 0.290342202 N 0.9960
Mean flow velocity (v; m s-1); hydrometric windlass (N; Revolutions per second).
The suspended sediment was measured by collecting water-sediment mixture samples at the vertical marks of the steel cable using the vertical integration method with the same width increase in length and later analysis of concentration in the laboratory and the calculation of the suspended sediment discharge.
The methodology applied was the same adopted by the Brazilian Water Agency. It consisted in the survey of the river flow and hydrosediment data by the vertical integration method in the river section with the same width increase.
The water-sediment mixture was collected with a sampler moving vertically at a constant transit speed between the water surface and a point a few centimeters above the river bed in order to avoid collecting dragged sediment. In this way, it was possible to collect the mixture at a velocity similar to the current instant velocity at each vertical point. A DH-48 sampler was used for collecting the water-sediment mixture.
The samples were transported and stored at the Hydrology and Water Sediment Laboratory of the State University of Western Paraná in bottles protected from the sun light to avoid any biological alteration. The samples were decanted for 96 h.
The first sample reduction was done by siphoning off the largest possible amount of water from each bottle. The small remaining volume of water-sediment was transferred to a 1,000 mL beaker. The second sample reduction, to 100 mL, was done after 24 h rest using a test tube. At this point, the determination of the sediment concentration of the control section points has begun.
Qss=
n
i1
Qi . Ci (1)
where,
Qss - sediment discharge, metric t day-1;
Qi - water discharge, m3 day-1, e
Ci - sediment concentration, metric t m-3.
The sediment rating curve for the control section location was then calculated using the flow data (water discharge) and the respective measured suspended sediment discharge data (Equation 2).
Qss = a Qi b (2)
where,
a and b - adjustment constants.
A turbidimeter was installed together with linigraph at the same location where the direct method was applied. The water discharge was estimated by the linigraph and associated with the sediment concentration, according to Equation 1, for determining the sediment discharge. The sediment discharge, however, was indirectly estimated using a turbidimeter and Equation 3 by correlating the sediment concentration to the respective turbidity.
Qss = 51.52 Ln(T) - 101.62 (3)
where,
T - turbidimetry electric signal, volts.
Having determined the sediment rating curves by the direct and indirect methods, statistical analysis was carried out to test if the respective model adjustment parameters were statistically equal.
Since the mathematical model adjusted to the sediment rating curves was a power function, the values were linearized by logarithm transformations before regression tests (t-student) analyses of the respective angular and linear coefficients to verify any possible differences between the direct and indirect methods.
RESULTS AND DISCUSSION
The average experimental flow velocity, wet section area, water discharge, and sediment discharge are presented on Table 3.
The sediment rating curve (Figure 2) was plotted with the water discharge and sediment discharge presented in Table 3 obtained by the direct method. It is worth noting that the model found is significant at 5% with a determination coefficient of 98.82%.
TABLE 3. Average velocity, wet section area, water discharge (hydrometric windlass), and sediment discharge through the direct method.
Measurement (Dates)
Average Velocity (m s־¹)
Area (m²)
Flow Rate (m³ s־¹ )
Sediment Discharge (metric t day ־¹)
01- 11/09/06) 0.37 7.94 3.37 0.84
02- 11/16/06) 0.43 8.43 3.81 1.21
03- 11/20/06) 0.78 12.12 9.15 12.04
04- 12/15/06) 0.70 13.00 8.96 14.72
05- 12/22/06) 0.73 11.65 8.27 12.08
06- 12/27/06) 0.90 14.34 15.08 43.41
07- 01/04/07) 0.60 11.93 7.35 7.95
08- 01/15/07) 0.73 11.65 8.27 9.48
09- 01/24/07) 0.60 9.51 5.94 3.56
10- 02/01/07) 1.06 12.91 13.95 36.97
11- 02/09/07) 0.93 11.59 11.00 27.40
FIGURE 2. Sediment rating curve by the direct method.
TABLE 4. Water discharge (linigraph) and sediment discharge levels by the indirect method. Measurement
(Dates) Water Discharge (m³ s־¹) Sediment Discharge (metric t day ־¹)
1-(01/2/2007) 10.82 20.71
2-(01/2/2007) 12.42 28.14
3-(05/2/2007) 13.61 48.59
4-(08/1/2007) 6.45 7.11
5-(08/2/2007) 14.83 58.68
6-(08/11/2006) 1.66 0.13
7-(09/2/2007) 11.31 20.38
8-(12/11/2006) 3.55 1.02
9-(16/12/2006) 8.48 12.78
(10-17/1/2007) 5.47 2.27
11-(18/11/2006) 4.43 1.85
12-(21/11/2006) 9.74 15.59
13-(23/12/2006) 7.45 7.54
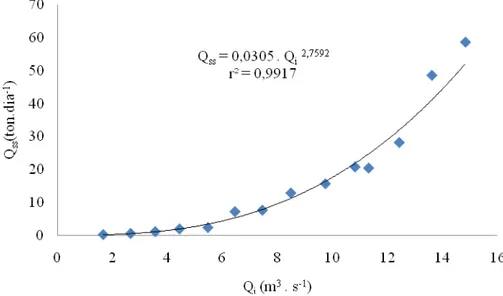
The sediment rating curve (Figure 3) was determined via the indirect method based on the water discharge and sediment discharge data presented in Table 4. Note that the model found is significant at 5% level with a determination coefficient of 99,17%. This adjustment can be explained by the fact that the material in suspension is basically clay and silt (CARVALHO, PARANHOS & PAIVA, 2004).
FIGURE 3. Sediment rating curve by the turbidimeter indirect method.
Table 5 presents the test done to determine if the rating curve equations given by both methods are statistically equal at the level of 5%.
TABLE 5. Comparison of the power function models obtained by the direct and indirect methods.
Method (a) (b) QME F test QME T test (a) T test (b) D
I 2.71 2.76 -1.49 -1.52 0.0041 0.0057 │0σ.722 Fc│< 2.65Ft D = σ2I ns
│0.23Tc│< 2.08 Tt
aD = aI ns
│1.04 Tc│< 2.07 Tt
bD = bI ns D: direct method, I: indirect method, QME: residual average squared, a: angular coefficient, b: linear coefficient, Fc: calculated value
of F, Ft: critical point of table F-Snedecor, Tc: calculated value of T, Tt: critical value of the two-tail t-Student table, ns:
non-significant difference at 5% probability, *: non-significant difference at 5% probability.
The F test showed that both methods presented equal variances (σ2D = σ2I), which
demonstrates that the T test comparison methodology can be used. Table 5 shows that the direct and indirect methods present equal angular and linear coefficients according to the T test at 5% probability. This indicates, therefore, that both methods can be used to determine the sediment rating curve for São Francisco Falso River, which corroborates with PICCOLO, PINTO & TEIXEIRA (1999), and TEIXEIRA & SENHORELO (2000).
The type of adjusted model, in the case of a power factor, may indicate that the watershed is instable in relation to its formation or the current soil use, since the sediment discharge increased exponentially with the water discharge. As the watershed under study is predominantly in a farming area, it is possible to implement soil conservation practices although farming is entirely by terracing system.
The power-type function found is similar to the equation found by PAIVA et al. (2001) in a study of sediment flow rating curves in small watersheds.
Given the watershed area, the specific suspended sediment discharge was estimated at 5.0 metric t year־¹ km-2 (Table 1). This level is considered low according to the criteria proposed by CARVALHO et al., (2000): low <70, moderate 70 to 175, high 175 to 300 and very high >300 metric t year־¹ km-2.
CONCLUSIONS
Based on the data available, it can be conclude that:
- The direct and turbidimeter methods used to determine the sediment rating curve for the São Francisco Falso River are statistically equal at 5% probability level.
- The average suspended sediment discharge on the São Francisco Falso River during the 2006/2007 crop year was calculated at 7.26 metric t day-1.
ACKNOWLEDGMENTS
The authors thank the technical team of the Hydrology Department of ITAIPU-BINACIONAL for the access granted to field equipment.
REFERENCES
ANDRADE, E.M. de; ARAÚJO, L. de F.P.; ROSA, M.F.; DISNEY, W.; ALVES, A.B. Seleção dos indicadores da qualidade das águas superficiais pelo emprego da análise multivariada. Engenharia
Agrícola, Jaboticabal, v.27, n.3, p.683-690, set./dez. 2007.
BUENO, L.F.; GALBIATTI, J.A.; BORGES, M.J. Monitoramento de variáveis de qualidade da água do Horto Ouro Verde - Conchal - SP. Engenharia Agrícola, Jaboticabal, v.25, n.3, p.742-748,
set./dez., 2005.
CARVALHO, K.S.; PARANHOS, R.M.; PAIVA, J.B.D. Limitações ao uso da relação entre turbidez e concentração de sedimento em suspensão em duas pequenas bacias em Santa Maria - RS. In: CONGRESSO LATINO-AMERICANO DE HIDRÁULICA, 21., 2004, São Pedro. Anais... São
Pedro: International Association of Hydro-Environment Engineering and Research, 2004. CARVALHO, N.O.; FILIZOLA JÚNIOR, N.P.; SANTOS, P.M.C.; LIMA, J.E.F.W. Guia de
práticas sedimentométricas. Brasília: ANEEL, 2000. 154 p.
CHELLA, M.R.; FERNANDES C.V.S.; FERMIANO, G.A.; FILL, H.D. Avaliação do transporte de sedimentos no Rio Barigui. Revista Brasileira de Recursos Hídricos, Porto Alegre, v.10, n.3,
p.105-111, jul./set., 2005.
LIMA, J.E.F.W.; SILVA, E.M.; CARVALHO, N.O. Comparação de modelos matemáticos para o traçado de curvas granulométricas de sedimentos do leito de rios. Revista Brasileira de Recursos
Hídricos, Porto Alegre, v.11, n.1, p.91-98, jan./mar. 2006.
LIMA, J.E.F.W.; SILVA, E.M. da. Seleção de modelos para o traçado de curvas granulométricas de sedimentos em suspensão em rios. Revista Brasileira Engenharia Agrícola e Ambiental, Campina
Grande, v.11, n.1, p. 101-107, jan./fev., 2007.
MENEZES, J.M.; PRADO, R.B.; SILVA JÚNIOR, G.C.; MANSUR, K.L.; OLIVEIRA, E.S. Qualidade da água e sua relação espacial com as fontes de contaminação antrópicas e naturais: bacia hidrográfica do Rio São Domingos-RJ. Engenharia Agrícola, Jaboticabal, v.29, n.4, 2009.
Disponível em: <http://www.scielo.br/scielo.php?pid=S0100-69162009000400019&script=sci_arttext> Acesso em: 1º fev. 2009.
OLIVEIRA, L.C.; GOMES, B.M.; BAUMGARTNER, G.; SEBASTIEN, N.Y. Variação espacial e temporal dos fatores limnológicos em riachos da microbacia do Rio São Francisco Verdadeiro.
OLIVEIRA, L.F.C.; MAURO, A.; MARTINEZ, M.A.; PRUSKI, F.F.; GRIEBELER, N.P.; OLIVEIRA, G. C. Rotina computacional para a determinação da velocidade de sedimentação das partículas do solo em suspensão no escoamento superficial. Engenharia Agrícola, Jaboticabal, v.25,
n.1, p. 126-136, jan./abr. 2005.
PAIVA, E.M.C.D.; PAIVA, J.B.D.; MOREIRA, A.P.; MAFFINI, G.F.; MELLER, A.; DILL, P.R.J. Evolução de processo erosivo acelerado em trecho do arroio Vacacaí-Mirim. Revista Brasileira de
Recursos Hídricos, Porto Alegre, v.6, n.2, p.129-135, abr./jun. 2001.
PICCOLO, M.A.M.; PINTO, C.A.; TEIXEIRA, E.C. Correlação entre sólidos em suspensão, cor e turbidez para a água captada no Rio Jucu-ES. In: CONGRESSO BRASILEIRO DE
ENGENHARIA SANITÁRIA E AMBIENTAL, 20., 1999, Rio de Janeiro. Anais... Rio de Janeiro:
Associação Brasileira de Engenharia Sanitária e Ambiental, 1999.
PORTO R.L.L; LANNA, A.E.L.; BRAGA JR., B.P.F; CIRILO, J.A.; ZAHED FILHO, K;
AZEVEDO, L.G.T.; CALVO, L.G.; BARROS, M.T.L; BARBOSA, P.S.F. Técnicas quantitativas para o gerenciamento de Recursos Hídricos. Porto Alegre: Universidade Federal do Rio Grande do Sul, 1999. 420 p.
TEIXEIRA, E.C.; SENHORELO, A.P. Avaliação de correlação entre turbidez e concentração de sólidos suspensos em bacias com uso e ocupação diferenciada. In: CONGRESSO BRASILEIRO DE ENGENHARIA SANITÁRIA E AMBIENTAL, 22., 2000, Rio de Janeiro, Anais... Rio de
Janeiro: Associação Brasileira de Engenharia Sanitária e Ambiental, 2000.
TOMAZONI, J.C.; MANTOVANI, L.E.; BITTENCOURT, A.V. L.; ROSA FILHO, E. F. Utilização de medidas de turbidez na quantificação da movimentação de sólidos por veiculação hídrica nas bacias dos rios Anta Gorda, Brinco, Coxilha Rica e Jirau – Sudoeste do Estado do Paraná. Boletim