Introduction
Cardiovascular diseases (CVD) are the leading cause of death worldwide and future estimation indicates that these diseases will continue to be the main cause of mortality in the coming decades (World Health Organization, 2008). The emergence of CVD seem to occur between the years of childhood and adolescence (Raitakari et al. 2003), and physical inactivity is considered a po-tential contributor to their genesis and development (Fogelholm 2010; Hallal et al. 2012). Furthermore, complying with physical activity guidelines at these periods of life contribute to health promotion not only immediately, but also throughout the lifetime (Trudeau, Laurencelle & Shephard 2004).
Considering the health beneits resulting from physical activity during childhood and adolescence, a series of studies have been conducted in different laboratories (Bastos, Araújo & Hallal 2008; Nelson, Neumark-Stzainer, Hannan, Sirard & Story 2006; Oliver, Duncan, Kuch, McPhee & Schoield 2012). In population studies, involving children and adolescents, questionnaires have been the most widely used instrument to measure physical activity. In this type of measurement, the most used classiication and currently accepted measure is the sum of minutes in moderate to vigorous physical activity. Where individuals who accumulate 300 or more minutes per week of moderate to vigorous physical activity are classiied as physically active (Haskell et al. 2007). However, some studies have used other instruments to estimate the level of physical
activity in children and adolescents. Among them, pedome-ters have been an option adopted by some authors (Dollman, Olds, Esterman & Kupke 2010; Le Masurier et al. 2005). This instrument has acceptable validity and reproducibility for the estimation of physical activity (Mckee, Boreham, Murphy & Nevill 2005; Oliver, Schoield, Kolt & Schluter 2007), bringing an alternative objective of measuring this variable in children and adolescents. Besides, compared with accelerometers, pedometers are less expensive and have a standardized unit of measurement (step/day). Considering these characteristics, pedometers offers a practical, low cost and easy universal interpretation way for an objective measurement of physical activity in free-living environments.
Although pedometer provides available objective information about the level of physical activity, there are still gaps in the classiication of such information. Some proposals for the clas -siication of physical activity using the number of steps/day for children and adolescents have as subjects of study children from 5 to 12 years old (Duncan, Al-Nakeeb, Woodield & Lyons 2007; Tudor-Locke et al. 2004), which compromises the use of these classiications in adolescents aged 13 and over. The proposal that covers the age group above 12 years of age (Dollman et al. 2010) is characterized, as well as the above proposals, by the use of only anthropometric indicators of overweight as a reference variable to the proposition of cutoffs points. These characteristics limit the use of these proposals of classiication by the number of steps/day only for screening of overweight adolescents. Original article (short paper)
Number of steps per day and the screening of
cardiovascular disease risk factors in adolescents
Júlio Brugnara Mello
Universidade Federal do Rio Grande do Sul, Porto Alegre, RS, Brasil Universidade Federal do Pampa, Uruguaiana, RS, Brasil
Vinícius Martins Farias Mauren Lúcia de Araújo Bergmann
Gabriel Gustavo Bergmann
Universidade Federal do Pampa, Uruguaiana, RS, Brasil
Abstract––Pedometers have been used in some studies to measure physical activity in adolescents. However, cutoff points of steps per day that classify physical activity levels are not yet fully established. The aims of this study were to identify the possibility the number of steps/day to predict cardiovascular disease risk factors in adolescents and to propose cutoff points to the number of steps/day for adolescents. Method: 1,045 adolescents (51.7 % girls) aged 11-17 were randomly selected. The number of steps/day was measured using pedometers. The risk factors considered were total cholesterol, systolic and diastolic blood pressure, skinfold thickness and body mass index. The receiver operating characteristics (ROC) curve was used to analyze data. Results: ROC curve results indicated that the number of steps/day was able to predict increased systolic blood pressure in boys (<16,134 steps/day; p=0.006), increased diastolic blood pressure in girls (<12,399 steps/day; p=0.023) and increased total cholesterol in both sexes (<11,788 steps/day for boys; p=0.016 and < 9,400 steps/day for girls; p=0.001). Conclusion: It is possible to identify adolescents that are more likely to have increased total cholesterol and blood pressure by the number of steps/day.
Besides being overweight, the presence of other CVD risk factors have been reported and associated with the level of physical activity in adolescents (Martínez-Gómez et al. 2011). Thus, proposals of classiications for the number of steps/day considering different CVD risk factors should be performed providing information on its ability for screening each of these factors. In order to overcome these gaps, the aims of this study were a) to identify the number of steps/day capacity to predict CVD risk factors in adolescents and b) to propose cutoff points for the number of steps/day for adolescents.
Methods
Sample selection
The study sample was composed of students 11 to 17 years of age enrolled in private and public schools of Uruguaiana, Rio Grande do Sul, Brazil. The following criteria were adopted to calculate the sample size: a) estimated 15,913 school children in this age group according to 2011 census information on school population (public and private schools in the city); b) prevalence of 50% because of the study´s characteristic of multiple out-comes; c) conidence interval of 95% (95%CI); d) sampling error of three percentage points; and e) increase of 15% to compensate possible losses and refusals. By the adoption of these criteria, it was estimated the need to assess 1,151 schoolchildren.
In order to respect the proportion of students from public and private schools and from the urban and rural areas in relation to the total number of schoolchildren of the city, the strategy for the selection of schools was carried out following two pro-cedures. As the number of urban public school represented a majority (86.8%) of the estimated total number of schoolchil-dren between 11-17 years old (from the sixth year of elementary school to the last year of high school) enrolled in the district. The selection process of the schools occurred in three stages while the selection of private schools and rural public schools occurred in two stages.
For the selection of urban public schools, the area of the city was proportionally divided into three geographic regions: northern, central and southern. The total number of public schools and students in each of the three regions was identiied. The selection of students occurred by the draw of schools and classrooms that would participate in the study. All urban public schools in each of the three regions that had classes of the inal years of elementary school and/or high school participated in the draw having the same chances to take part in the study ac-cording to the number of students aged 11-17 years. One school from each region was drawn. As the three selected schools had a high number of students in the age group of interest, even with the draw of classes. The number of students selected from each school was enough to represent the proportion of each region relatively to the total number of students enrolled at all urban public schools, without the need of drawing other urban public schools.
The selection process of private schools and rural public schools in the municipality was performed through a simple
drawing. In order to have the number of schoolchildren select-ed proportional to the total number of students enrollselect-ed in the school system and in the area, it was necessary to draw just one rural school and one private school.
All students in the selected classes of the ive schools drawn were invited to participate in the study. The adopted inclusion criterion for participation in the study was to be enrolled in the school system (public or private) of the municipality. The following criteria were used for exclusion: a) being outside the age group of interest; b) having any physical and/or cognitive limitations that could compromise the results; c) having stated that, during the days of using of the pedometer they did not perform routinely physical activities due to an injury or illness; and d) to be using any medication that could interfere the lipid proile or blood pressure. Such research had its project reviewed and approved by the ethics committee on human research.
Data collection procedure
The completion of the ieldwork occurred in four stages. First, after the draw of the ive schools, contact was made with the representatives of the school boards for the presentation of the rationale, objectives and procedures of the study. All of the representatives of the school boards agreed with the study and the dates for data collections scheduled.
The second stage occurred with the visit to the selected classes for the study procedures presentation and to give the term of free and informed consent to each student. In the third stage occurred collections of data. The last phase of ieldwork consisted of another visit to the schools, in order to give an opportunity for the students, who forgot to deliver the consent form to their parents and for those who forgot to bring it back.
All measurements were performed on school premises in class time by an assessment team (teachers and scholarship/ physical education students) who had undergone training. The data collection occurred between April and October 2012.
Variables
The variables used for this study were gender, age, physical activity (PA) level and ive CVD risk factors. The CVD risk factors considered were total cholesterol (TC), systolic blood pressure (SBP), diastolic blood pressure (DBP), skinfolds (SF) and body mass index (BMI). Gender and age were recorded on the same form in which the results of the other variables were noted.
went to control the measurements of each unit, recording the number of steps within 24 hours of use, even when saved in the equipment´s memory. The PA level was evaluated from the average number of steps of the second and third day, excluding values under 1,000 steps/day and over 30,000 steps/day mean values (Duncan, Schoield & Duncan 2006).
The TC was obtained by using a portable monitor (Accutrend Plus, Roche Diagnostics). It was not required that the students were fasting since the TC shows no signiicant variation with the individual, in fasting state or not (BSC 2013). The use of this form of measurement of TC (portable monitor) and this procedure (not fasting) was used by the Brazilian Society of Cardiology involving more than 81 thousand individu-als (Martinez et al. 2003). Values less than 150 mg/dl were considered “desirable”, TC values between 150 and 170 mg/ dl were considered “borderline” and values equal or greater than 170 mg/dl were considered “increased”, according to the IV Brazilian Guideline for Dyslipidemia and Atherosclerosis Prevention (Sposito et al. 2007). The inferential data analysis of both categories “borderline” and “increased” were grouped together and considered “increased”.
The measures of SBP and DBP were conducted with individ-uals at sitting position for at least ten minutes. The measurement was performed by using a certiied digital device (Christofaro
et al. 2009) for checking blood pressure (Omron HEM 742). Three measurements were performed and the intermediate value was used. The classiication of blood pressure was performed based on The Fourth Report on the Diagnosis, Evaluation, and Treatment of High Blood Pressure in Children and Adolescents (Falkner & Daniels 2004), indicating “normal”, “pre-hyper-tension” and “hyper“pre-hyper-tension”. For inferential data analyzes the “pre-hypertension” and “hypertension” categories were grouped and considered as “increased”.
SF were collected using a scientiic caliper (Cescorf, Brazil) and following the recommendations of Gordon et al. (1988). Measures of SF from subscapular and triceps regions were col-lected. The values of these SF were summed creating a variable sum of SF (ΣSF). The classiication of ΣSF values in “normal” and “increased” was held from the cutoff points proposed by the Physical Best (Going 1988).
BMI was estimated by dividing the body weight (kg) by height (m) squared (kg / m²). The measurement of body mass was performed with a digital scale with a capacity of 150 kg and a precision of 100 grams. To measure the height a portable stadiometer with a precision of 0.1 cm was used. The measure-ments were performed in a closed room following standardized procedures (Gordon et al. 1988). For the BMI classiications of “normal weight”, “overweight” and “obesity” cutoff points proposed by Cole, Bellizzi, Flegal and Dietz (2000) were used. For inferential data analyzes the categories “overweight” and “obesity” were grouped and considered as “overweight”.
Data analysis
Regarding the data processing, descriptive statistics were used at first. In these analyzes the mean values, standard
deviation, minimum and maximum values of the number of steps/day were identiied, as well as the values of absolute and relative frequency of other variables studied and their respective conidence interval of 95% (95%CI) was calculated. In order to compare the mean of number of steps/day between both genders the independentsample t-test was used and for the comparison of the mean number of steps/day between ages the one-way variance analysis (ANOVA) was used followed by Tukey´s post-hoc test.
For the purpose of identifying the cutoff points from the number of steps/day the Receiver Operating Characteristic (ROC) curve was used. This procedure requires a dichoto-mous “reference” variable and a continuous “test” variable. In the present study, the reference variables were TC, SBP, DBP, ΣSF, and BMI dichotomized. The test variable was the number of steps/day. For the identification of cutoff points initially the ROC curves’ area values for each analysis and their respective 95%CI were analyzed. Only analyses with lower limit of 95%CI of the area under the ROC curve greater than 0.50 (50%) were considered to identify the cutoffs points (Schisterman, Faraggi, Reiser & Trevisan 2001). The next step was to identify the best balance between sensitivity and specificity, with these values being considered as cutoff for the number of steps/ day. All analyses were performed using the Software SPSS version 20.0 for Windows.
Results
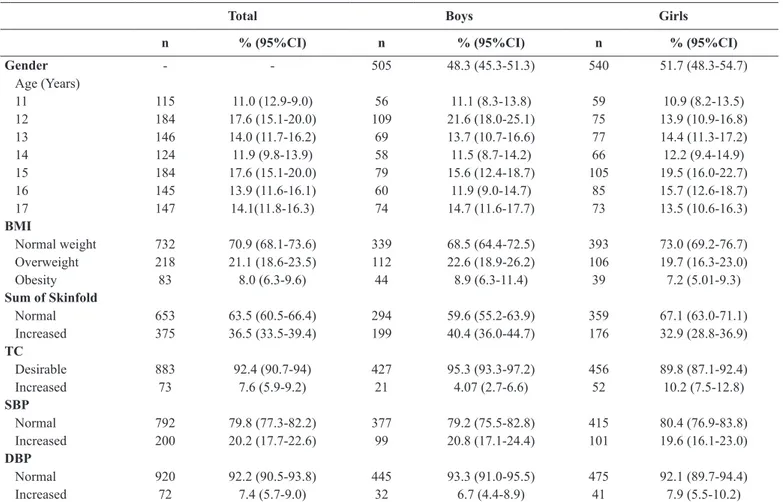
A total of 1,300 adolescents were selected from the ive participating schools. By refusing to participate, not having their parents´ authorization, not attending on the day of data collection or failing to bring the consent form signed on the date set, 236 students did not participate in data collection, totaling 1,064 schoolchildren. Of these, 19 were not eligible according to inclusion criteria of the study. Of the total of 1,045 adoles-cents in the sample, 996 had steps/day recorded appropriately. Table 01 presents the description results of the studied vari-ables of the entire sample stratiied by sex. The results indicated a high prevalence of overweight and obesity, increased adiposity and increased SBP.
Regarding the number of steps/day, in all ages there was a statistically signiicant difference between genders in favor of boys (p<0.05). However, no differences were found between ages within the same gender, with the exception of 15 year old boys with a mean lower than 11 year old boys (p <0.05) (Table 02).
Table 1.Description of the studied variables in adolescents of 11 to 17 years old in Uruguaiana, Rio Grande do Sul State, Brazil, 2012.
Total Boys Girls
n % (95%CI) n % (95%CI) n % (95%CI)
Gender - - 505 48.3 (45.3-51.3) 540 51.7 (48.3-54.7)
Age (Years)
11 115 11.0 (12.9-9.0) 56 11.1 (8.3-13.8) 59 10.9 (8.2-13.5)
12 184 17.6 (15.1-20.0) 109 21.6 (18.0-25.1) 75 13.9 (10.9-16.8)
13 146 14.0 (11.7-16.2) 69 13.7 (10.7-16.6) 77 14.4 (11.3-17.2)
14 124 11.9 (9.8-13.9) 58 11.5 (8.7-14.2) 66 12.2 (9.4-14.9)
15 184 17.6 (15.1-20.0) 79 15.6 (12.4-18.7) 105 19.5 (16.0-22.7)
16 145 13.9 (11.6-16.1) 60 11.9 (9.0-14.7) 85 15.7 (12.6-18.7)
17 147 14.1(11.8-16.3) 74 14.7 (11.6-17.7) 73 13.5 (10.6-16.3)
BMI
Normal weight 732 70.9 (68.1-73.6) 339 68.5 (64.4-72.5) 393 73.0 (69.2-76.7) Overweight 218 21.1 (18.6-23.5) 112 22.6 (18.9-26.2) 106 19.7 (16.3-23.0)
Obesity 83 8.0 (6.3-9.6) 44 8.9 (6.3-11.4) 39 7.2 (5.01-9.3)
Sum of Skinfold
Normal 653 63.5 (60.5-66.4) 294 59.6 (55.2-63.9) 359 67.1 (63.0-71.1) Increased 375 36.5 (33.5-39.4) 199 40.4 (36.0-44.7) 176 32.9 (28.8-36.9) TC
Desirable 883 92.4 (90.7-94) 427 95.3 (93.3-97.2) 456 89.8 (87.1-92.4)
Increased 73 7.6 (5.9-9.2) 21 4.07 (2.7-6.6) 52 10.2 (7.5-12.8)
SBP
Normal 792 79.8 (77.3-82.2) 377 79.2 (75.5-82.8) 415 80.4 (76.9-83.8) Increased 200 20.2 (17.7-22.6) 99 20.8 (17.1-24.4) 101 19.6 (16.1-23.0) DBP
Normal 920 92.2 (90.5-93.8) 445 93.3 (91.0-95.5) 475 92.1 (89.7-94.4)
Increased 72 7.4 (5.7-9.0) 32 6.7 (4.4-8.9) 41 7.9 (5.5-10.2)
n: sample number (absolute frequency); %: relative frequency (proportion of the sample); 95%CI: conidence interval of 95%; BMI: body mass index; TC: total
cholesterol; SBP: systolic blood pressure; DBP: diastolic blood pressure.
Table 2.Description of the number of steps/day by gender and age in adolescents of 11 to 17 years old in Uruguaiana, Rio Grande do Sul, Brazil, 2012.
Boys Girls
Age
(Years) Mean SD Min Max Mean SD Min Max p-value
11 14,381 5,944 1,147 27,586 11,678 5,505 2,206 24,582 0,000
12 14,077 5,437 2,661 28,257 10,828 4,420 3,688 22,829 0,000
13 13,307 5,327 3,812 29,591 11,442 4,655 1,415 24,292 0,000
14 13,701 5,738 3,196 27,730 10,897 5,283 2,041 25,802 0,000
15 12,341 5,642 3,139 27,313 11,231 5,438 2,579 28,407 0,000
16 12,411 5,522 1,781 25,410 10,314 4,758 2,459 25,567 0,000
17 12,585 5,719 1,689 25,935 10,592 4,303 2,517 23,584 0,000
SD: Standard deviation; Min: Minimum value; Max: Maximum value.
Table 3. Area under the ROC curve between number of steps/day and cardiovascular disease risk factors in adolescents of 11 to 17 years old in Uruguaiana, Rio Grande do Sul, Brazil, 2012.
Boys Girls
n AURC 95%CI p-value n AURC 95%CI p-value
IMC 495 0.55 0.49-0.60 0.078 538 0.49 0.43-0.54 0.817
∑DC 493 0.50 0.45-0.55 0.872 535 0.50 0.45-0.55 0.872
CT 395 0.66 0.54-0.79 0.016 424 0.63 0.55-0.72 0.001
PAS 476 0.59 0.53-0.65 0.006 516 0.50 0.43-0.56 0.921
PAD 476 0.52 0.42-0.62 0.662 516 0.60 0.51-0.69 0.023
Figure 1 presents the results of sensitivity and speciicity found that showed the best cutoff point for the number of steps/day to screening adolescents with increased SBP (boys) and increased DBP (girls). The analysis indicated the cutoff point of 16,134 steps/ day for boys (Figure 1a) and 12,399 steps/day for girls (Figure 1b).
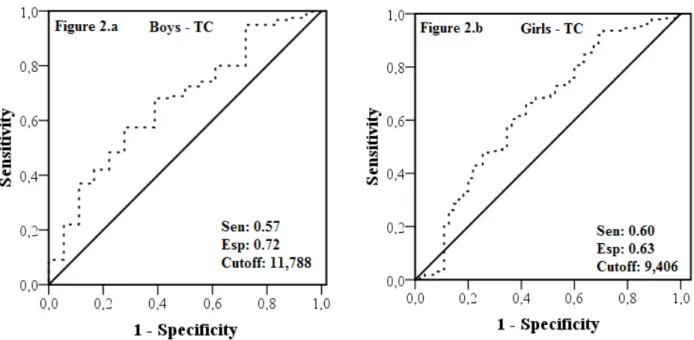
Figure 2 shows the results of sensitivity and speciicity found that showed the best cutoff point for the number of steps/day to screening adolescents with increased TC. The analyses indicated cutoffs points of 11,788 steps/day for boys (igure 2a) and 9,400 steps/day for girls (igure 2b).
Figure 1. Area under ROC curve between the number of steps/day and the increased systolic blood pressure in boys (igure 1.a) and increased diastolic blood pressure in girls (igure 1.b).
Discussion
The results of this study indicated that the number of steps/ day can be used to screening adolescents that are more likely to exhibit increased BP and increased TC. Nevertheless, the required number of steps/day to reduce this probability varies depending on the risk factor used as reference and the proposed values that are different for girls and boys.
Regarding the mean number of steps/day, the values found in this study are similar to other developed with individuals from the same age group (Le Masurier et al. 2005). Studies with superior (Raustorp & Ekroth 2010) and inferior (Beighle, Alderman, Morgan & Masurier 2008; Hohepa, Schoield, Kolt, Scragg & Garrett 2008) average number of steps/day to those found in the present study were also reported. The differences between the results of the studies, although not expressive, may be linked to different methodological approaches such as the number of days wearing the pedometer and the using of open or sealed pedometers. Moreover, socio-cultural characteristics of the regions where the studies were conducted may inluence on how adolescents from different places walk.
Although small differences related to the average values of the number of steps/day have been found among the studies, the differences between genders were the same in all of them, where boys accumulated signiicantly more steps/day than girls. This gender difference can be attributed to higher number of steps during physical educations classes for boys than girls (Flohr, Todd & Tudor-Locke 2006), and active transport more frequently found in boys than girls (Bastos, Araújo & Hallal 2008). Furthermore, as suggested by Le Masurier et al. (2005), boys participate more in extracurricular physical activities. This hypothesis can help to explain this difference in number of steps/ day between genders. Another similarity between the analyzed studies refers to the average number of steps/day throughout different age groups, indicating no signiicant changes or only small decreases in the number of steps/day. The trend of decline in the number of steps/day can be associated to a reduction in participation in physical education classes (Le Masurier et al. 2005) and increase in sedentary behavior (Nelson et al. 2006) observed through the years of adolescence.
Regarding the cutoff points for the number of steps/day for adolescents some proposals are available in the literature (Andaki et al. 2013; Duncan et al. 2007; Tudor-Locke et al. 2004; Vincent & Pangrazi 2012). However, except for the work by Andaki et al. (2013), the other studies used only anthropo-metric indicators of overweight to identify cutoff points for the number of steps/day. The present study was the only one to pro-pose cutoff points from the association of the number of steps/ day with TC and BP in a representative sample of adolescents from 11 to 17 of both genders.
Unlike the studies of Tudor-Locke et al. (2004), Duncan et al. (2007), D ollman et al. (2010), Vincent & Pangrazi (2012) and McCormack, Rutherford, Giles-Corti, Tudor-Locke and Bull (2011), in the present study the number of steps/day was not able to identify adolescents more likely to be overweight and to have increased ΣSF. However, Hands & Parker (2008) also could not ind association between the number of steps/
day and anthropometric indicators of being overweight in boys. Although physical activity contribute to body weight manage-ment, others factors have to be considered. Sedentary activities, food habits and biology factors as maturation and heredity can be linked to body weight increase. Thus, a combination of these factors should be considered in associations’ analyzes between physical activity and anthropometric indicators of overweight in adolescents.
Although all the analyzed studies have aimed to propose cutoff points for the number of steps/day for children and adolescents, different values were found, ranging from 6,700 (Andaki et al. 2013) to 16,000 steps/day (Duncan et al. 2007; McCormack et al. 2011). These differences can be attributed to the different variables used as reference for the proposition of cutoffs, the way to dichotomize these variables, and the dif-ferences in the statistical approach. Thus, the recommendations for the number of steps/day for health promotion of adolescents should be interpreted considering the variable that was used as reference for its proposition. This form of interpretation and relection about the recommendations and their possible practical applications are already being discussed in studies conducted with subjects from other age groups (Ewald, Attia & McElduff 2014).
The present study has identiied that 11,800 and 9,400 or more steps/day for boys and girls, respectively, are associated with reduced probability to present increased TC. For screen-ing adolescents with increased BP, on the other hand, higher amounts of steps/day were identiied. Around 16,000 and 12,400 steps/day for boys and girls, respectively.
The practical application of the found results could be made from the development of strategies for adolescents to increase their commuting by foot, stating that the number of steps per day is inversely associated to the presence of health outcomes. Furthermore, it is important to inform adolescents, parents and educators that the amounts of steps/day less than 11,800 (for boys) and 9,400 (for girls) are associated with higher likelihood of exposure to CVD risk factors. Although it is recommended that adolescents reach at least these amounts of steps/day, the main message should not be to ix the amount of steps/day to be achieved, but motivate them to increase their commutes by foot.
Further studies on the required number of steps/day for screening adolescents with increased likelihood of presenting or developing risk factors for CVD are required. These studies should be conducted with representative samples and covering all ages of adolescence. In addition, different variables should be used as reference for the proposition of cutoff points, enabling a greater understanding of the associations between the number of steps/day and different variables related to health.
a good parameter, since there is evidence indicating that walk-ing, when practiced often, helps to prevent a number of chronic diseases such as type 2 diabetes, coronary heart disease, stroke and others (Andersen, Schnohr, Schroll & Hein 2000). Despite the results presented between the CVD risk factors variables and the number of steps/day were signiicant, it is not possible to establish causality between them, since it is a cross-sectional study. Finally, the number of days that adolescents used the pe-dometer during the study was lower than other studies and they were not used during the weekends (Clemes & Biddle 2013; Duncan et al. 2007; Tudor-Locke et al. 2004).
Conclusion
It is concluded that the number of steps/day can be used for screening adolescents with increased TC and increased BP. For adolescents from 11 to 17 years old, 11,800 and 9,400 steps/day were considered adequate to screening boys and girls, respectively, with likelihood of presenting or developing increased TC. For screening adolescents at age-matched group with increased likelihood of having or for developing increased BP, 16,000 and 12,400 steps/day for boys and girls, respectively, are considered adequate.
References
Andaki, A.C.R., Tinoco, A.L.A., Andaki Júnior, R., Santos, A., Brito, C.J., & Mendes, E.L. (2013). Physical activity level as a predic-tor of cardiovascular risk facpredic-tors in children. Motriz: Revista de Educação Física,19(3), 8-15.
Andersen, L.B., Schnohr, P., Schroll, M., & Hein, H.O. (2000). All-cause mortality associated with physical activity during leisure time, work, sports, and cycling to work. Archives of internal medicine, 160(11), 1621-1628.
Bastos, J.P., Araujo, C.L., Hallal, P.C. (2008). Prevalence of insuficient physical activity and associated factors in Brazilian adolescents. Journal of physical activity & health, 5(6),777-794.
Beighle, A., Alderman, B., Morgan, C.F., & Masurier, G.L. (2008). Seasonality in children’s pedometer-measured physical activ-ity levels. Research quarterly for exercise and sport, 79(2), 256-260.
Clemes, S.A. & Biddle, S.J. (2013). The use of pedometers for moni-toring physical activity in children and adolescents: measurement considerations. Journal of physical activity and health, 10(2), 249-262.
Cole, T.J., Bellizzi, M.C., Flegal, K.M., & Dietz, W.H. (2000). Establishing a standard deinition for child overweight and obesity worldwide: international survey. Bmj, 320(7244), 1240.
Christofaro, D.G.D, Fernandes, R.A., Gerage, A.M., Alves, M.J., Polito, M.D. & Oliveira, A.R.de. (2009). Validação do monitor de medida de pressão arterial Omron HEM 742 em adolescentes. Arquivos brasileiros de cardiologia, 92(1), 10-15.
Dollman, J., Olds, T.S., Esterman, A., & Kupke, T. (2010). Pedometer step guidelines in relation to weight status among 5-to 16-year-old Australians. Pediatric exercise science, 22(2), 288.
Duncan, J.S., Schoield, G., & Duncan, E.K. (2006). Pedometer-determined physical activity and body composition in New Zealand children. Medicine and Science in Sports and Exercise, 38(8), 1402-1409.
Duncan, M.J., Al-Nakeeb, Y., Woodield, L., & Lyons, M. (2007). Pedometer determined physical activity levels in primary school children from central England. Preventive Medicine, 44(5), 416-420.
Ewald, B., Attia, J., & McElduff, P. (2014). How many steps are enough? Dose-response curves for pedometer steps and multiple health markers in a community-based sample of older Australians. Journal of physical activity & health, 11(3), 509-518.
Falkner, B., & Daniels, S.R. (2004). Summary of the fourth report on the diagnosis, evaluation, and treatment of high blood pressure in children and adolescents. Hypertension, 44(4), 387-388.
Flohr, J.A., Todd, M.K., Tudor-Locke, C.E. (2006). Pedometer-assessed physical activity in young adolescents. Research quarterly for exercise and sport, 77(3), 309-315.
Fogelholm, M. (2010). Physical activity, itness and fatness: relations to mortality, morbidity and disease risk factors. A systematic review. Obesity reviews, 11(3), 202-221.
Going, S. (1988). Physical Best—Body composition in the assessment of youth itness. Journal of Physical Education, Recreation & Dance, 59(7), 32-36.
Gordon, C.C., Chumlea, W.C., Roche, A.F., Lohman, T.G., Roche, A.F., & Martorel, R. (1988). Anthropometric standardization: reference manual. Champaign. Anthropometric standardization: reference manual. Champaign.
Hallal, P.C., Andersen, L.B., Bull, F.C., Guthold, R., Haskell, W., Ekelund, U., & Lancet Physical Activity Series Working Group. (2012). Global physical activity levels: surveillance progress, pitfalls, and prospects. The lancet, 380(9838), 247-257.
Hands, B.P., & Parker, H. (2008). Pedometer-Determined physical ac-tivity, BMI and waist girth in 7-to 16-year-old children and adoles-cents. Journal of physical activity & health, 5(Supp1), S153-S165. Haskell, W.L., Lee, I.M., Pate, R.R., Powell, K.E., Blair, S.N., Franklin,
B.A., ... & Bauman, A. (2007). Physical activity and public health: updated recommendation for adults from the American College of Sports Medicine and the American Heart Association. Circulation, 116(9), 1081.
Hohepa, M., Schoield, G., Kolt, G.S., Scragg, R., & Garrett, N. (2008). Pedometer-determined physical activity levels of adolescents: differences by age, sex, time of week, and transportation mode to school. Journal of physical activity & health, 5, S140.
Le Masurier, G.C., Beighle, A., Corbin, C.B., Darst, P.W., Morgan, C., Pangrazi, R.P., ... & Vincent, S.D. (2005). Pedometer-determined physical activity levels of youth. Journal of physical activity & health, 2(2), 159-168.
Martinez, T.L.R., Santos, R.D., Armaganijan, D., Torres, K.P., Loures-Vale, A., Magalhães, M.E., ... & Ortiz, J. (2003). National alert campaign about increased cholesterol: determination of cholesterol levels in 81,262 Brazilians. Arquivos brasileiros de cardiolo-gia, 80(6), 635-638.
obesity, infections, allergies, and cardiovascular disease risk factors in adolescents) study. Public health nutrition, 14(10), 1779-1786. McCormack, G.R., Rutherford, J., Giles-Corti, B., Tudor-Locke, C.,
& Bull, F. (2011). BMI-referenced cut-points for recommended daily pedometer-determined steps in Australian children and ado-lescents. Research quarterly for exercise and sport, 82(2), 162-167. McKee, D.P., Boreham, C.A., Murphy, M.H., & Nevill, A.M. (2005). Validation of the Digiwalker™ pedometer for measuring physical activity in young children. Pediatric Exercise Science, 17(4), 345. Nelson, M.C., Neumark-Stzainer, D., Hannan, P.J., Sirard, J.R., &
Story, M. (2006). Longitudinal and secular trends in physical activ-ity and sedentary behavior during adolescence. Pediatrics, 118(6), e1627-e1634.
Oliver, M., Duncan, S., Kuch, C., McPhee, J., & Schoield, G. (2012). Prevalence of New Zealand children and adolescents achieving current physical activity and television watching recommenda-tions. Journal of physical activity and health, 9(2), 173. Oliver, M., Schoield, G.M., Kolt, G.S., & Schluter, P.J. (2007).
Pedometer accuracy in physical activity assessment of preschool children. Journal of Science and Medicine in Sport, 10(5), 303-310. Raitakari, O.T., Juonala, M., Kähönen, M., Taittonen, L., Laitinen,
T., Mäki-Torkko, N., ... & Viikari, J.S. (2003). Cardiovascular risk factors in childhood and carotid artery intima-media thick-ness in adulthood: the Cardiovascular Risk in Young Finns Study. Jama, 290(17), 2277-2283.
Raustorp, A., & Ekroth, Y. (2010). Eight-year secular trends of pe-dometer-determined physical activity in young Swedish adoles-cents. Journal of physical activity & health, 7(3), 369.
Schisterman, E.F., Faraggi, D., Reiser, B., & Trevisan, M. (2001). Statistical inference for the area under the receiver operating characteristic curve in the presence of random measurement er-ror. American Journal of Epidemiology,154(2), 174-179. Sposito, A.C., Caramelli, B., Fonseca, F.A., Bertolami, M.C., Aiune,
N.A., Souza, A. D., ... & dos Santos, F.R. (2007). IV Brazilian guide-line for dyslipidemia and atherosclerosis prevention: Department of Atherosclerosis of Brazilian Society of Cardiology. Arquivos brasileiros de cardiologia, 88, 2.
Trudeau, F., Laurencelle, L., & Shephard, R.J. (2004). Tracking of physical activity from childhood to adulthood. Medicine and Science in Sports and Exercise, 36(11), 1937-1943.
Tudor-Locke, C., Pangrazi, R.P., Corbin, C.B., Rutherford, W.J., Vincent, S.D., Raustorp, A., ... & Cuddihy, T.F. (2004). BMI-referenced standards for recommended pedometer-determined steps/day in children. Preventive medicine, 38(6), 857-864. Vincent, S.D., & Pangrazi, R.P. (2002). An examination of the
ac-tivity patterns of elementary school children. Pediatric Exercise Science, 14(4), 432-441.
World Health Organization (2008). The global burden of disease: 2004 update. WHO Library Cataloguing-in-Publication.
Autor’s note
Júlio Brugnara Mello is afiliated with the University of Rio Grande do Sul. Re
-search Group Sport Brazil Project (PROESP-Br) and University of Pampa. Re-search group in physical activity and health in childhood and adolescence.
Vinícius Martins Farias, Mauren Lúcia de Araújo Bergmann and Gabriel Gustavo
Bergmann are afiliated with the University of Pampa. Research group in physical
activity and health in childhood and adolescence.
Acknowledgments
This work was supported by a grant (public notice recently doctor – FAPERGS 001/2011) from Fundação de Amparo à Pesquisa do Estado do Rio Grande do Sul, Brazil (FAPERGS)
Corresponding author
Gabriel Gustavo Bergmann
University of Pampa. Research group in physical activity and health in childhood and adolescence. University of Pampa, Brazil.
BR 472, Km 592 - Post ofice box 118, Uruguaiana, RS, Brazil.
Email: [email protected]
Manuscript received on June 16, 2015 Manuscript accepted on February 02, 2016