RAPD and SCAR markers linked to resistance to frogeye leaf spot in soybean
Sebastião Martins Filho
1, Carlos Sigueyuki Sediyama
2,3, Maurilio Alves Moreira
2,4and Everaldo Gonçalves de Barros
2,51
Departamento de Engenharia Rural, UFES, Alegre, ES, Brazil.
2Instituto de Biotecnologia Aplicada à Agropecuária (BIOAGRO).
3Departamento de Fitotecnia, Universidade Federal de Viçosa, Viçosa, MG, Brazil.
4
Departamento de Bioquímica e Biologia Molecular, Universidade Federal de Viçosa, Viçosa, MG, Brazil.
5
Departamento de Biologia Geral, Universidade Federal de Viçosa, Viçosa, MG, Brazil.
Abstract
The soybean (Glycine max (L.) Merrill) frogeye leaf spot is caused by the fungus Cercospora sojina Hara and is a widespread disease in Brazil and other countries, causing severe losses in grain yield and also affecting seed quality. The availability of DNA markers linked to genes for resistance to this disease would accelerate breeding programs, particularly when other traits are also being evaluated. Bulked segregant analysis was applied to 3 F2populations derived from crosses between the resistant cultivars Parana, Cristalina and Uberaba, and the susceptible cultivar Bossier. In the cross ‘Parana’ x ‘Bossier’, 2 RAPD markers were identified, CSOPA1800Cand CSOPA21,250C, located at 4.4 ± 1.8 centiMorgans (cM) and 3.4 ± 1.7 cM respectively from the resistance locus. DNA fragments of similar molecular weight were observed in the population derived from the cross ‘Cristalina’ x ‘Bossier’ at 2.3 ± 1.2 and 4.7 ± 1.5 cM from the resistance locus, respectively. In the offspring of the cross ‘Uberaba’ x ‘Bossier’, a DNA fragment corresponding to marker CSOPA1800Cwas detected at 5.6 ± 2.1 cM from the resistance locus. Although marker CSOPA21,250Cwas not observed in this population, an additional marker was detected (CSOUB11,100C) at 6.7 ± 2.2 cM from the resistance locus. The 1,250 bp fragment of CSOPA21,250Cwas cloned and converted into a SCAR marker, which amplified a single fragment whose size corresponded to the cloned segment of the crosses involving cultivars Cristalina and Parana. Markers CSOPA1800C, CSOPA21,250Cand CSOUB11,100Cwere mapped to soybean linkage group J with the aid of known SSRs linked to the Rcs3 locus, indicating that the RAPD and SCAR markers identified in our research also tag this resistance gene.
Key words:molecular markers, RAPD, SCAR, soybean,Cercospora sojina, frogeye leaf spot.
Received: July 19, 2000; accepted: June 6, 2002.
Introduction
Frogeye leaf spot, caused by the fungusCercospora sojina Hara, is a worldwide important soybean disease, causing both yield losses and seed deterioration. The use of resistant cultivars is the most efficient and cost-effective means of controlling this disease, but the exis-tence of several C. sojina races (Yorinori, 1989b) de-mands the permanent search for new sources of resistance and their incorporation into resistance breeding programs. Another factor to be considered is that the evaluation of soybean crops with regard to this disease is a time-consuming process, which requires expertise for the pre-cise distinction between susceptible and resistant plants.
These problems can be better managed in breeding programs by identifying and using DNA markers linked to resistance genes. DNA markers are abundant and essen-tially independent from environmental conditions (Keimet al., 1989), and several research groups have been using this tool in breeding programs (Shoemakeret al., 1992; Young and Kelly, 1996; Younget al., 1998). In this paper, we re-port on the identification of DNA markers linked to soy-bean loci responsible for resistance toC. sojinain soybean cultivars Cristalina, Parana and Uberaba, and also on the confirmation of the resistance locus identity.
Material and Methods
Genetic material and crosses
Seeds of the soybean cultivars Bossier, Cristalina, Paraná and Uberaba were provided by the Soybean
www.sbg.org.br
Send correspondence to E.G.de Barros. E-mail: ebarros@mail. ufv.br.
Breeding Laboratory (SBL) of the Department of Plant Sci-ences of the Federal University of Viçosa, Minas Gerais, Brazil. The Bossier cultivar is susceptible to the race 4C. sojinafungus, while ‘Cristalina’, ‘Parana’ and ‘Uberaba’ are resistant to it. A number of allelism tests involving these resistant cultivars and/or their resistant progenitors indicate that they harbor the same resistance locus, Rcs3, which is also present in cultivar Davis (Ariaset al., 1996).
Origin and cultivation ofC. sojinaisolate
The monosporic isolate (provided by the SBL) used in all inoculations was collected in the Alto Paranaíba re-gion of the Brazilian State of Minas Gerais, and identified as race 4 (Machadoet al., 1997), its isolation and cultiva-tion being carried out as described by Veiga (1973) and Cordeiro (1986).
Evaluation of symptoms
The crosses performed were ‘Cristalina’ x ‘Bossier’ (CB), ‘Parana’ x ‘Bossier’ (PB), and ‘Uberaba’ x ‘Bossier’ (UB), with ‘Bossier’ as the male parent in all crosses. F1
plants were selfed, and the F2seeds were planted in a
green-house. In addition to the parents, 219 CB, 126 PB, and 124 UB F2plants were tested for resistance/susceptibility toC. sojina. The primary leaf from each plant was collected and kept at -80 °C. When the first trifoliolate leaf was fully ex-panded, the plants were inoculated with the pathogen by spraying approximately 4 x 10⁵conidia on each plant, on the abaxial and adaxial sides of the leaves (Caselaet al.,
1979). The plants were then transferred and kept for 3 days in a mist chamber maintained at 20 to 22 °C and 95% rela-tive humidity.
Symptoms were assessed 20 days after inoculation, based on the scale proposed by Yorinori (1989a). To suit our purpose better, the scale was modified as follows: grade 1 = leaf without lesions; 2 = 1 to 10% of leaf area infected (LAI); 3 = 11 to 25% LAI; 4 = 26 to 50% LAI; and 5 = more than 50% LAI. Plants with scores from 1 to 3 were ered resistant, and those which scored 4 and 5 were consid-ered susceptible.
DNA bulks and amplification
In order to identify homozygous F2 plants for the
construction of DNA bulks, 20 F3seeds were taken from
each of 30 F2resistant plants (with score 1) and planted in
a greenhouse; the resulting F3plants were inoculated with
the pathogen and evaluated for symptoms, as described above.
For each cross, two DNA bulks (Michelmoreet al., 1991) were constructed, one containing DNA from 6 ho-mozygous susceptible F2plants, and the other containing
DNA from 6 resistant plants. The DNA was extracted by the method described by Doyle and Doyle (1990), and RAPD DNA amplification was carried out by the method of Williamset al.(1990), using primers from Operon
Tech-nologies (Alameda, CA, USA) and a model 9600 thermocycler (Perkin-Elmer, Norwalk, CT, USA). 1,200 primers were tested for DNA amplification. Amplification conditions were as follows: 40 cycles, each consisting of a 15 s denaturation step at 94 °C, a 30 s annealing step at 35 °C, and a 1 min extension step at 72 °C. After the 40th cy-cle, a final extension step of 7 min at 72 °C was performed. The amplification products were separated on 1.2% agarose gel containing 0.2µg/mL ethidium bromide, im-mersed in pH 8.0 TBE (90 mM Tris-borate buffer, 1 mM EDTA), and the DNA bands were observed under UV light and photographed; only the most intense and reproducible bands were used for analysis. Primers generating DNA bands which were polymorphic between the bulks were in-dividually tested against the components of each bulk and then tested against the F2population, to determine the
ge-netic distances between the markers and the resistance loci.
Development of SCAR markers
One of the RAPD bands linked to the resistance locus identified in population CB was excised from the gel, puri-fied with the aid of the Glass MaxtmDNA Isolation Matrix System (BRL) and cloned in the vector pGEM-T Easy (Promega). White colonies were grown in 2 mL LB me-dium containing 100 µg/mL ampicillin, and the plasmid was purified with the QIA Prep Spin Miniprep kit (Qiagen). The clone was partially sequenced by automated sequenc-ing ussequenc-ing M13 universal primers. The sequence informa-tion was used to design two primers, each one containing 18 nucleotides including the sequence of the original RAPD primer.
The PCR reaction to amplify the SCAR marker con-sisted of 35 cycles, each one consisting of a 30 s step at 94 °C, a 1 min step at 62 °C, and a 1 min 30 s step at 72 °C. The amplified bands were analyzed as described for the RAPD amplification products.
Linkage analysis
Student’s chi-square (χ2) test was used to analyze the phenotypic segregation of the three populations and to de-termine possible linkages between the RAPD markers and the resistance loci.
For linkage analysis, 219 CB, 126 PB, and 124 UB F2
plants were used, and the progenitors of these crosses were also tested with primer-pairs for SSR Satt-547 and Satt-431, which were shown to be linked to the Rcs3 locus in soybean linkage group J (Mianet al., 1999). Where poly-morphic bands were detected, the contrasting bulks and the F2plants were also analyzed. The distances between the
Results and Discussion
Identification of RAPD markers
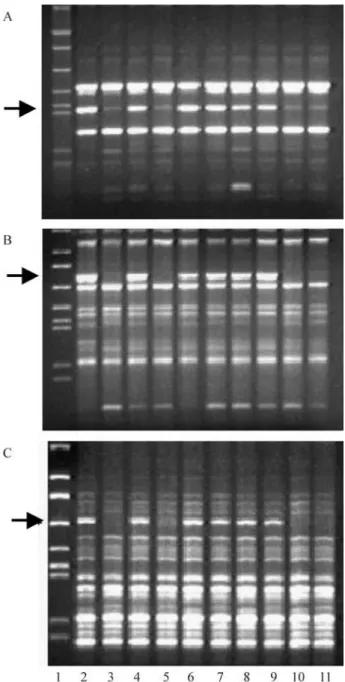
Figure 1a and 1b show the two polymorphic DNA bands which distinguished the contrasting bulks from the PB cross. These bands were present in all resistant individ-uals of the bulks and absent in all susceptible individindivid-uals. These markers were designated CSOPA1800C and
CSOPA21,250C, because they are linked to a locus which
controls resistance toC. sojina(CSO) originally detected in cultivar Parana (PA), contain approximately 800 and 1,250 bp, respectively, and are in the coupling-phase (C) with regard to the resistance gene. These two markers also co-segregated with resistance in the CB cross. Marker CSOPA1800Calso co-segregated with resistance in the UB
cross, but locus CSOPA21,250C was monomorphic in that
cross. A third marker, CSOUB11,100C, was detected only in
the UB cross (Figure 1c).
The segregation ratio 3:1 (resistant:susceptible or band presence:absence) in the F2populations was
consis-tent with the single-factor dominant inheritance of the re-sistance locus and of the RAPD markers in the CB and PB crosses (Table I). In the UB cross, resistance toC. sojina
segregated at a 13:3 ratio (Table I), indicating that at least two independent loci control resistance in the Uberaba cultivar, one being dominant and the other recessive. Cor-deiro (1986) also detected two resistance loci toC. sojina
race 4 in a cross between ‘Santa Rosa’ and ‘Bossier’, ‘Santa Rosa’ being the progenitor of ‘Uberaba’.
In view of the highχ2values, the hypothesis of inde-pendent linkage (9:3:3:1) could be discarded, indicating that the RAPD markers were linked to the resistance locus (Table II). The estimates of the genetic distance between the RAPD locus CSOPA1800Cand the resistance locus
var-ied between 2.3 cM for the CB cross and 5.6 cM for the UB cross. The estimated genetic distances between RAPD lo-cus CSOPA21,250Cand the resistance locus varied between
3.4 cM for the PB cross and 4.7 cM for the CB cross. CSOUB11,100Cwas 6.7 cM from the resistance locus.
It is conceivable that the locus tagged by CSOPA1800C
in all three crosses corresponds to locus Rcs3, a resistance locus previously identified in the cultivars Parana, Cris-talina, Santa Rosa and Davis (Ariaset al., 1996). To con-firm this hypothesis, two SSR markers, Satt 431 and Satt 547, previously shown to be linked to locus Rcs3 (Mianet al., 1999), were tested in the three populations used in this study (Table I). The results show that, in the CB population, Satt 431 and Satt 547 co-segregated with resistance and with the CSOPA1800C and CSOPA21,250C markers.
How-ever, in the PB population, both SSR markers were mono-morphic, Satt 547 alone being polymorphic in the UB population and co-segregating with resistance and with the CSOPA1800C and CSOUB11,100Cmarkers. These SSR and
RAPD marker data strongly suggest that the resistance lo-cus we mapped in the three populations corresponds to the resistance locus Rcs3.
It is noteworthy that this conclusion could only be reached by the combined analysis of the two types of mark-ers. In addition, our results confirm the usefulness of the in-tegrated SSR map for soybean (Creganet al., 1999) as a main guide for breeders and emphasize that the optimal use of molecular markers in plant breeding will depend on a specific analysis of each individual cross.
Figure 1- Gels of DNA amplification products from soybean plants with different susceptibility to frogeye leaf spot: a) marker CSOPA1800Cin the
PB cross, b) marker CSOPA21,250C in the PB cross, c) marker
CSOUB11,100Cin the UB cross. Lanes are as follows: 1, lambda phage
DNA digested withEcoRI,BamHI andHindIII (size markers); 2, resistant cultivar; 3, susceptible cultivar; 4, resistantbulk; 5, susceptiblebulk; 6-9, resistant F2plants; and 10-11, susceptible plants. Arrows indicate the
Conversion of RAPD marker into a SCAR
The DNA fragment corresponding to RAPD marker CSOPA21,250C was cloned and partially sequenced. Two
18-nucleotide-long primers were synthesized based on the sequencing data: SCARBG5F (5’ GCC GTG AGA AAG GCG AAG 3’) and SCARBG5R (5’ AGC CGT GAA TTA TCC GAT 3’). These primers were tested in the CB and PB F2populations, and Figure 2 shows that the polymorphism
of the amplifications is identical to the one revealed by the RAPD marker. This SCAR marker can be used for marker-assisted selection in programs aiming at the development of cultivars which are resistant to frogeye leaf spot, particu-larly when other traits are also being evaluated.
Table I- Segregation analysis of molecular markers and theC. sojinaresistance locus in F2populations derived from the crosses ‘Cristalina’ x ‘Bossier’
(CB), ‘Parana’ x ‘Bossier’ (PB) and ‘Uberaba’ x ‘Bossier’ (UB)1/.
Population Locus tested Observed frequency Expected frequency χ2 p
CB Rcs32/ 162:57 164.25:54.75 0.0745 0.79
CB CSOPA1800C 159:60 164.25:54.75 0.5495 0.46
CB CSOPA21,250C 155:64 164.25:54.75 1.8645 0.17
CB Satt-547 155:64 164.25:54.75 1.8645 0.17
CB Satt-431 159:60 164.25:54.75 0.5495 0.46
PB Rcs3 98:28 94.50:31.50 0.3809 0.54
PB CSOPA1800C 95:31 94.50:31.50 0.0000 0.99
PB CSOPA21,250C 94:32 94.50:31.50 0.0000 0.99
PB Satt-547 -3/ - -
-PB Satt-431 - - -
-UB Rcs3 103:21 100.75:23.25 0.1621 0.69
UB CSOPA1800C 97:27 93.00:31.00 0.5269 0.47
UB CSOUB11,100C 98:26 93.00:31.00 0.8709 0.35
UB Satt-547 99:25 93.00:31.00 1.5484 0.21
UB Satt-431 - - -
-1/Expected proportion for acceptance of the independence hypothesis was 3:1. resistance or presence of DNA band:susceptibility or absence of band. In
the case of population UB locus Rcs3, the expected proportion for independence was 13:3.
2/
Resistance toC. sojinalocus.
3/Monomorphic for this cross.
Table II- Analyses of linkage between RAPD markers and resistance toCercospora sojinaHara locus in F2populations derived from the crosses
‘Cristalina’ x ‘Bossier’ (CB), ‘Parana’ x ‘Bossier’ (PB) and ‘Uberaba’ x ‘Bossier’ (UB)1/.
Population Locus tested Observed frequency χ2 p CM ± SD2/
CB Rcs3 / CSOPA1800C 158:4:1:56 214.63 2.3 ± 1.2
CB Rcs3 / CSOPA21,250C 154:8:1:56 211.49 4.7 ± 1.5
PB Rcs3 / CSOPA1800C 94:4:1:27 92.98 4.4 ± 1.8
PB Rcs3 / CSOPA21,250C 94:4:0:28 99.99 3.4 ± 1.7
UB Rcs3 / CSOPA1800C 97:6:0:21 69.81 5.6 ± 2.1
UB Rcs3 / CSOUB11,100C 97:6:1:20 64.53 6.7 ± 2.2
1/
Expected proportion for acceptance of the independence hypothesis was 9:3:3:1 presence of resistance locus and marker: presence of resistance locus and absence of marker: absence of resistance locus and presence of marker:absence of resistance locus and marker.
2/
Genetic distance in centiMorgans ± standard deviation.
Figure 2- Transformation of RAPD marker CSOPA21,250Cinto SCAR
marker. Lanes are as follows: 1, lambda phage DNA digested withEcoRI,
BamHI andHindIII (size markers); 2, resistant Parana cultivar; 3, suscep-tible Bossier cultivar; 4, resistantbulk; 5, susceptiblebulk; 6-9, resistant F2
Acknowledgments
The authors thank BID/FINEP and FAPEMIG for fi-nancial support. SMF was supported by a fellowship from CNPq.
References
Arias CAA, Yorinori JT, Toledo JFF and Kiihl RAS (1996) Inher-itance of resistance of soybean [Glycine max(L.) Merrill] to races 4 and 15 of frogeye leaf spot fungus (Cercospora sojinaHara). Braz J Genet 19:295-304.
Casela CR, Noguez MA, Luzzardi CG and Gastal MFC (1979)
Mancha “olho-de-rã” (Cercospora sojina Hara) em soja
(Glycine max(L.) Merrill). EMBRAPA/CNPSo. I National Meeting on Soybean Research, Londrina, PR, Brazil, v. 2, pp 139-143.
Cordeiro ACC (1986) Herança da resistência da soja (Glycine max(L.) Merrill), àCercospora sojinaHara, isolado de São Gotardo, Minas Gerais. M.S. Thesis. Federal University of Viçosa, Viçosa, MG, Brazil.
Cregan PB, Jarvik T, Bush AL, Shoemaker RC, Lark KG, Kahler AL, Kaya N, VanToai TT, Lones DG, Chung J and Specht JE (1999) An integrated genetic linkage map of the soybean genome. Crop Sci 39:1464-1490.
Doyle JJ and Doyle JL (1990) Isolation of plant DNA from fresh tissue. Focus 12:13-15.
Keim P, Shoemaker RC and Palmer RG (1989) Restriction frag-ment length polymorphism diversity in soybean. Theor Appl Genet 77:786-792.
Lander ES, Green P, Abrahamson J, Barlow A, Daly MJ, Lincoln SE and Newburgh L (1987) Mapmaker: An interactive com-puter package for construting primary genetic linkage maps of experimental and natural populations. Genomics 1:174-181.
Lincoln SE, Daly MJ and Lander ES (1992) Constructing genetic maps with Mapmaker/EXP 3.0. 3 ed, s l, Whitehead Insti-tute, Technical Report.
Machado MA, Barros EG, Vasconcelos MJV, Gomes JLL and Moreira MA (1997) RAPD analysis for the characterization
of Cercospora sojina isolates. Brazilian Phytopathology 22:366-369.
Mian MAR, Wang T, Phillips DV, Alvernaz J and Boerma R (1999) Molecular mapping of the Rcs3 gene for resistance to frogeye leaf spot in soybean. Crop Sci 39:1687-1691. Michelmore RW, Paran I and Kesseli RV (1991) Identification of
markers linked to disease-resistance genes by bulked segre-gant analysis: A rapid method to detect markers in specific genome regions by using segregating populations. Proc Natl Acad Sci USA 88:9828-9832.
Shoemaker RC, Guffi RD, Lorenzen LL and Specht JE (1992) Molecular genetic mapping of soybean: map utilization. Crop Sci 32:1091-1098.
Veiga P (1973)Cercospora sojina Hara: obtenção de inoculo,
inoculação e avaliação da resistência em soja (Glycine max
(L.) Merrill). M.S. Thesis. ESALQ/USP, Piracicaba, SP, Brazil.
Williams J, Kubelik A, Livak K, Rafalski A and Tingey S (1990) DNA polymorphisms amplified by arbitrary primers are useful as genetic markers. Nucl Ac Res 18:6531-6535. Yorinori JT (1989a) Frog eye leaf spot of soybean (Cercospora
sojina Hara). World Soybean Research Conference - IV, March 5-9, v. III. Buenos Aires, Argentina, pp 1275-1283. Yorinori JT (1989b) Identificação de raças deCercospora sojina
Hara e distribuição geográfica no Brasil. EMBRAPA/ CNPSo. V National Seminar of Soybean Research, Campo Grande, MS, Brazil, pp 31-32.
Young R, Melotto M, Nodari RO and Kelly JD (1998) Marker-assisted dissection of the oligogenic anthracnose resistance in the common bean cultivar G2333. Theor Appl Genet 96:87-94.