Factor structure of Raven’s Coloured Progressive Matrices
Monalisa Muniz – Universidade Federal de São Carlos, São Carlos, Brasil
Cristiano Mauro Assis Gomes – Universidade Federal de Minas Gerais, Belo Horizonte, Brasil Sonia Regina Pasian – Universidade de São Paulo, Ribeirão Preto, Brasil
Abstract
This study’s objective was to verify the factor structure of Raven’s Coloured Progressive Matrices (CPM). The database used included the responses of 1,279 children, 50.2% of which were males with an average age of 8.48 years old and a standard deviation of 1.49 yrs. Conirmatory factor analyses were run to test seven models based on CPM theory and on a Brazilian study addressing the test’s structure. The results did not conirm the CPM theoretical proposition concerning the scales but indicated that the test can be interpreted by one general factor and one speciic factor or one general factor and three speciic factors; both are bi-dimensional models. The three-factor model is, however, more interpretable, suggesting that the factors can be used as a means of screening children’s cognitive developmental stage.
Keywords: intelligence, cognitive test, psychometrics, children, Raven’s colored progressive matrices
Estrutura Fatorial das Matrizes Progressivas Coloridas de Raven
Resumo
O objetivo do trabalho foi veriicar a estrutura fatorial das Matrizes Progressivas Coloridas de Raven – MPC. Para isso, utilizou--se um banco de dados contendo as respostas a MPC de 1.279 crianças, 50,2% do sexo masculino, com idade média de 8,48 anos e desvio-padrão de 1,49 anos. Foram efetuadas análises fatoriais conirmatórias testando sete modelos arquitetados a partir da teoria das MPC e de um estudo brasileiro que explorou a estrutura desse teste. Os resultados não conirmaram a proposta teórica da MPC referente às escalas propostas no teste, mas indicaram que o teste pode ser interpretado por um fator geral e um fator especíico, ou um fator geral e três especíicos, os dois modelos sendo bidimensionais. No entanto, o modelo com três fatores especíicos é mais interpretável, sugerindo que os fatores podem ser utilizados como screening do estágio de desenvolvi-mento cognitivo que a criança se encontra.
Palavras-chave: inteligência, teste cognitivo, psicometria, crianças, matrizes progressivas coloridas de Raven
Estructura Factorial de las Matrices Progresivas Coloridas de Raven
Resumen
El objetivo del trabajo fue veriicar la estructura factorial de las Matrices Progresivas Coloridas de Raven – MPC. Para el estudio se utilizó un banco de datos que contenía las respuestas de 1.279 niños a las MPC, siendo 50,2% del sexo masculino, con edad media de 8,48 años y desviación estándar de 1,49 años. Fueron realizados análisis factoriales conirmatorios utilizando siete modelos ideados a partir de la teoría de las MPC y de un estudio brasileño que investigó la estructura de ese test. Los resultados no conirmaron la propuesta teórica de las MPC con respecto a las escalas propuestas en el test, pero indicaron que el test puede ser interpretado por un factor general y un factor especíico, o un factor general y tres especíicos, siendo los dos modelos bidi-mensionales. Pese a eso, el modelo con tres factores especíicos es el más interpretable, sugiriendo que los factores pueden ser utilizados como screening de la etapa de desarrollo cognitivo en que el niño se encuentra.
Palabras clave: inteligencia, test cognitivo, psicometría, niños, matrices progresivas coloridas de Raven
John C. Raven was responsible for develop-ing three important instruments to assess intelligence
that are frequently used in difference contexts. These
instruments are generically called Raven’s Progressive
Matrices. The irst of these tests, the Standard Progres
-sive Matrices (SPM), published in 1938, is intended for
people aged from 12 to 65 years old. In 1947, Raven developed Coloured Progressive Matrices (CPM) and
Advanced Progressive Matrices (APM). The irst is an adaptation of the Standard Progressive Matrices and is intended for children aged from ive to 11 years old,
mentally disabled individuals and the elderly. The sec-ond instrument is administered to 11 years old or older
individuals with higher than average intelligence; it is most frequently used among college students (Pasquali, Wechsler, & Besunsan, 2002; Bandeira, Alves, Gia
-comel, & Lorenzatto, 2004).
CPM were developed for small children and
elderly individuals but standardizing studies conducted in Brazil involve only children aged from ive to 11
years old. It is possible to infer the level of a child’s eductive capability and potential to create knowledge out of logical associations among stimuli based on the child’s score. The CPM contain three sets of items A,
dificulty in each set and as complexity among the sets increases. The explanation for the sequence’s ascend
-ing level of dificulty of items in the three sets is based
on the gradual introduction of new and more complex types of reasoning, so that previous strategies prepare the individual for the construction of the coming
log-ical-associative strategies for the more dificult items (Bandeira et al., 2004).
Each item has a drawing or a matrix with a part missing and six alternatives, but only one alternative
correctly completes the igure. The respondent is asked
to select only one alternative for each problem. Most of the items are printed on a coloured background, hence the name Coloured Progressive Matrices. The colours,
however, are irrelevant to solving the problems; they
are added simply as an attracting and motivating
ele-ment to keep the child’s attention on the test. Since its
construction, the instrument was revised only once, by Raven himself in 1956. He changed the design of some alternatives of items and changed the positions of
some alternatives in other items (Bandeira et al., 2004). These changes are speciied in the Brazilian manual developed by Angelini, Alves, Custódio, Duarte and Duarte (1999).
Pasquali, Wechsler and Besunsan (2002) state
that Raven used three theories to develop the Matrices
including the CPM: (1) Spearman’s two-factor theory
(g factor); (2) Gestalt theory; and (3) the theory of cog
-nitive development. Spearman (1927) conceived of
intelligence as a general factor or simply a g factor, dein
-ing such a construct as “mental energy storage”. Based
on the g factor, he developed the two-factor theory of intelligence known as bifactor theory, which is com-posed of the general factor, a capacity that is common
to all skills, and one speciic factor that is particular
to each type of test. The theory assumes the constant presence of these two types of factors in any intellec-tual activity. In this line of thinking, every intelligence
test demands a speciic skill related to a peculiar activity that is required on the test itself and a cognitive ability
of a general nature.
Spearman sought to understand fundamental processes that characterize the general factor of intelli
-gence seeking to establish a deinition for the g factor. He defended the view that the g factor involves the presence of three basic processes: apprehension of experience, eduction of relationships, and eduction of correlates.
CPM emphasize the measurement of one’s eductional ability, more speciically eduction of relationships in which one has to ind links and associations among
sets of information to conceive an idea. It is also
pos-sible to understand how the Gestalt theory grounded
the construction of the items in this psychological test.
One of the cornerstones of Gestalt theory is linked to the perception of the whole; to be able to visualize any
problem (as in the CPM’s items), one has to perceive the context, seeking an overall understanding based on the relationships existing among the parts (Angelini et al., 1999). The CPM’s items were developed for the problem to be solved within a spatial or logical
percep-tion of a global conigurapercep-tion, or one gestalt (Pasquali
et al., 2002).
In regard to the developmental relationship, it is implicit in Raven’s Matrices because one’s eduction of relationships and eduction of correlates are developed along with organic maturation so that children tend to perform more poorly than adolescents or adults. Raven
indicated ive levels of cognitive development in chil
-dren aged ive to 12 years old to solve problems and
that are understood in a successive manner: distinguish
similarities and differences in igures; assess the orienta
-tion of the igure in the perceptual ield, both in regard to itself and to the remaining objects; perceive how two or more igures can form the whole; analyse the parts
perceiving the whole but distinguishing between what seems real and what the child himself/herself adds to
it; compare analogue changes in the perceived parts; and use it as a strategy of logical reasoning (Pasquali
et al., 2002).
It is important to clarify that CPM’s primary goal is not to measure general intelligence, that is, all intel-ligence-related capabilities. This test does not assess
one’s verbal language capacity or acquired cultural
knowledge. As previously mentioned, the main pur-pose of Raven’s Matrices, as well as that of CPM, is to measure one’s capacity for eduction, which is
simi-lar to luid intelligence proposed in the most current
model of psychometric theory of intelligence,
Cattell-Horn-Carroll Theory of Cognitive Abilities (Schneider & McGrew, 2012). Fluid intelligence has been notes
as an important factor from a psychometric
perspec-tive and, according to Flanagan and Ortiz (2001), it is
the ability most strongly associated with general intel-ligence. It may be one of the explanations that matrices are acknowledged in various parts of the world as an important and relevant measure of intelligence.
Fluid intelligence or, as it is currently called, luid
reasoning, refers to one’s ability to reason in novel
involve relating ideas, inducing abstract concepts and solving problems, mainly employing inductive and deductive reasoning. Inductive reasoning seems to be
the most frequently used in the CPM items, involving
the ability to analyse sets of information and establish relationships among them, creating new ideas and
con-cepts, and systematically organizing information (Primi,
2002). As can be observed, inductive reasoning is simi-lar to eduction of relationships, which is proposed in the CPM assessment.
Because the objective of the Progressive
Matrices is to assess eduction of relationships, or inductive reasoning, Progressive Matrices tend to be
considered uni-dimensional. As noted by Pasquali et
al. (2002), Raven himself was not concerned with the dimensionality of matrices and conceived them as uni-dimensional. The nature of the items, however, is
different and requires particularities in one’s reasoning
to achieve the correct response. In scale A, the nature of the items is subdivided into: Complement of a simple, continuous pattern with perceptions related to the difference, identity, similarity, orientation, and
gestaltic formation (from item A1 to A8); Comple -ment of a pattern showing progressive changes in one direction with the perception of the difference, iden-tity, similarity, orientation and identity (items A9 and
A10); and complement of a pattern showing progres -sive changes in two directions with the perception of difference, similarity, gestaltic formation, orientation and correlate-creation (items A11 and A12). In the Ab scale, the items can be subdivided into: Complement of distinct patterns with perception of difference, similarity, identity and orientation (from items Ab1 to
Ab3); and Complement of distinct patterns involv
-ing apprehension of three related igures as a whole,
to be completed by a fourth piece, together with the perception of difference, closed and open symmetry,
orientation, change of orientation, and oblique orien -tation of a missing part (from Ab4 to Ab12). Finally,
the items in the B scale are subdivided according to:
Complement of distinct patterns with the perception
of difference, similarity and identity (items B1 and B2); Apprehension of three igures with the whole
to be completed with the perception of similarity,
symmetry and orientation of a missing part (B3 to B5); Concrete or coherent reasoning by spatial anal
-ogy with an asymmetric change in changed igure and oblique orientation of the missing part (B6 to B9);
and discrete or abstract reasoning by logical analogy
(B10 to B12) (Angelini et al., 1999).
Regardless of the instrument having one dimen-sion, with so many variations in the nature of the CPM tasks, it is important to investigate its internal structure,
that is, how the items are grouped given their speciici -ties, and how grouping can be interpreted, and which psychological meaning one can infer regarding group-ing. Few studies are concerned with exploring the structure of CPM, though there are international
stud-ies such as Carlson and Jensen (1980), Schmidtke and Schaller (1980), Green and Kluever (1991), and Fajgelj, Bala and Katic´ (2010).
The objective of Carlson and Jensen (1980) was to re-analyse the factorial structure of CPM using a
sample with 783 children aged 6.11 years old on aver -age, with a standard deviation of 10.1 months. Analyses were performed using methods that reduced the effect
that the dificulty of items tends to cause in the genera -tion of factors. According to the authors, when the phi coeficient is used in the analysis, the dificulty of items
contributes to forming factors, so that some factors,
considered artiicial factors, emerge. Therefore, the
authors applied principal component analysis with vari-max rotation, but tested data using the phi coeficient, tetrachoric correlation and phi coeficient/phi max (the
last two tend to minimize the effect of the dificulty of items). The Scree Test (Cattell, 1966) was used to deter -mine the number of rotated factors.
Three factors were identiied for the three speci
-icities of the factor analysis (phi coeficient, tetrachoric
correlation and, phi coeficient/phi max). The factorial structure found between the analysis with tetrachoric correlation and phi/phi max were similar, loading the
same signiicant items and factors obtained the same
denomination. These data were different from the anal-ysis using the phi coeficient to the extent that the factor Concrete and Abstract Reasoning was composed of
clearly more dificult items, as exposed by the authors.
When Carlson and Jensen (1980) discuss the results, they state that the analysis helped to clarify the CPM’s
internal structure and how the dificulty of the items
tends to cause interference when using the procedure with the phi coeficient. The factors that emerged with the tetrachoric analysis and phi/phi max were: Factor 1 – closure and abstract reasoning by analogy, composed of items A9 to A11 (nature of task of standard com-plement showing progressive changes), items Ab4 to
Ab9 and B5 (standard complement by closure), B7 to B12 (concrete and abstract reasoning); Factor 2 – Stan
-dard complement by identiication and complement
of a simple pattern), A10 (standard complement with
successive changes), Ab1, Ab2 and Ab3 (standard com
-plement involving identiication), Ab4, Ab6, Ab7 and Ab8 (standard complement by closure), B1, B2 and B3 (standard complement involving identiication), B4 and B5 (standard complement by closure); and Factor 3 –
simple standard complement formed by items A2 to A6
and A8 (simple standard complement), Ab3 (standard complement by identiication).
In the same year, 1980, Schmidtke and Schaller,
considering the existence of studies with contradic-tory results concerning the CPM structure, took data obtained by Carlson and Jensen in the aforementioned study to verify the CPM structure and compare with previous studies that indicated the possibility of CPM having two, three or four factors. A total of 728 chil-dren aged from four to 11 years old were assigned to four groups (four years and nine months old to six
years and three months old; six years and four months old to seven years and nine months old; seven years
and ten months old to nine years and three months
old; and nine years and four months old to 11 years
old). The factor analysis used was principal compo-nents with varimax rotation, using the phi coeficient.
The Scree test was used for the quantity of rotated fac -tors. Three factors were obtained for all the groups and comparison of the factorial matrices after rotation of
maximum similarity resulted in an average coeficient
of congruence of 0.75. The factors were interpreted as
Perceptive closure involving complex igures (F1), Con -crete and abstract reasoning (F2), and Complement of homogeneous patterns and recognition of certain
ele-ments (F3). In the comparison with the results found in
Carlson and Jensen (1980), the authors describe there was similarity among the factorial structures found.
Unfortunately, the study conducted by Schmidtke and Schaller does not report the factorial structure with the
items, thus closer scrutiny of the proper details of this information is not possible.
In 1991, Green and Kluever, because previous
studies presented different data for the CPM’s factorial structure and were also based on samples of children with typical development, sought to verify the CPM structure among gifted children. A total of 166 intel-lectually gifted children aged from three to 11 years old participated in the study. Applying factorial analy-sis using principal components and varimax rotation, the solution generated with three factors enabled the best interpretation, highlighting that the authors did not specify the statistical criterion of factor retention.
Factor 1 involved items with a standard complement
nature and visual closure but also required visual orien
-tation and sophisticated discrimination skills (B11, B12, B10, B9, AB8, B8, A11, A12, B6, B5, Ab4, Ab9, A7, Ab6, Ab12, B7, Ab10 and A8). The nature of items in Factor 2 shows a complement of visual analogy (B3, Ab1, B2, Ab3, A9, Ab5, Ab7, A1, A10, B4, Ab11, Ab2) and, inally, Factor 3 presents items that require percep
-tual combination (A5, A4, A6, A3, A2). The authors
also performed an analysis with oblimin rotation and with the phi coeficient and the results were similar.
There is a concern on the part of the authors of the three studies previously mentioned with the
ana-lytical techniques, that they would not interfere in the results. With this concern in mind, Fajgelj, Bala and Katic´ aimed to verify the validity of the CPM construct
in 2010 and understand the test’s dimensionality, since
various studies indicated signiicant primary factors. The study’s sample was composed of 2,334 individuals
aged between four and 11 years old. To achieve their objective, various types of factor analyses were applied. Initially, six exploratory factor analysis procedures were
performed using three programs (Lisrel, SPSS and Tes -tfact), three types of matrices (covariance, correlation and rtest-smoothed), with three forms of extraction
(ML, principal components and minres) and two types
of rotation (promax and varimax). Three or four fac-tors were derived in the analyses but, according to the authors, the solution with four factors was the most appropriate because some items are joined by
similar-ity of graphic content. Applying conirmatory factor
analysis to all the models with three and four factors
with and without speciication of a general factor of
the second order and to one general factor model, all were considered acceptable, except the one with a single factor. The adjustment indexes used for the
con-irmatory factor analysis were RMSEA, SRMR, PNFI and x²/gl, the values of which were equal to or below 0.40 for RMSEA, except for the one-factor model that reached 0.71; equal to or below 0.61 for SRMR; equal to or below 0.899 for PNFI; and below 5 for x²/gl, except,
again, for the one-factor model. Parallel analysis was also used and indicated the solution with four factors for the general sample.
The authors did not present the constitution of each factor, but they discuss that the existence of a general factor cannot be disregarded. They present three arguments: there are high correlations among the
factors; there are models with an acceptable general fac
can be understood as factors of dificulty, which the authors also call artiicial factors.
Up to the present, two studies addressing the
dimensionality of CPM were performed in Brazil. One, Pasquali et al. (2002), found four factors but
uni-dimensionality was observed at the second order level,
while the other study, Sisto, Rueda and Bartholomeu
(2006), did not detect uni-dimensionality. The studies,
however, used different analytical techniques: the irst
study applied exploratory factor analysis, the purpose
of which is to identify groupings of items; the second
study used the Item Response Theory, the objective of which is not to identify factors, but only to indicate the possibility of the existence of one or more dimensions
in one set of items. Therefore, Pasquali et al. (2002)
will be further detailed here as it was performed with a
Brazilian sample including a signiicant number of par -ticipants, which contributed to the results’ robustness, and is compared with this study’s results.
Among other objectives, Pasquali et al. (2002)
sought to verify the CPM internal structure in a
sam-ple of Brazilian children. It is important to note that
the study was conducted with the previous version of CPM, from 1986. Therefore, it does not correspond to
the CPM currently used, as it was not available in Brazil
when data were collected at the end of 1987. It is worth noting, however, that the only difference between the two is the change of position of items 11 and 12 in set A. The sample totalled 9,929 children, of both sexes,
aged between ive and 11 years old, from public schools from the Federal District. The factor analysis was per -formed excluding individuals younger than seven years old, as the cognitive structure seems not to be fully
organized in children younger than seven years old.
Additionally, factor analyses were performed by age, school year, and sex, but the results were similar so that the study describes only the analysis with the general sample, which include seven to 11 year-old children.
The factor analysis performed by principal axes and oblimin rotation was performed and, initially, six factors with eigenvalues higher than 1.0 and four factors with eigenvalues higher than 1.40 emerged.
Consequently, the authors opted to conduct the same
analysis with four factors. The items with a factor load above 0.28 were considered in the extraction results. The four factors were evident with some correlations
among them (Factor 1 x Factor 2 = 0.41; Factor 1 x Factor 4 = -0.50; Factor 2 x Factor 3 = 0.31), which also led the authors to propose a conirmatory factor analy
-sis with one factor. Data indicated that CPM assesses
four factors, but one general factor of intelligence of the second order is present. Factor 1, however, explains more variance of CPM than the general factor.
The four factors extracted by Pasquali et al. (2002)
were called: analogical-abstract reasoning (Factor 1:
6Ab, 5B, 7Ab, 3B, 8Ab, 4Ab, 10A, 5Ab, 9A, 7A, 10Ab, 4B, 11Ab, 9Ab, 6B), analogical-concrete reasoning (Fac
-tor 2: 1Ab, 2Ab, 3Ab, 6A, 2B, 5A), gestalt perception (Factor 3: A2, A3, A4, A1) and deductive reasoning (Factor 4: 11B, 9B, 8B, 12B, 10B), in addition to the general factor identiied as analogical reasoning and containing 25 of the 36 items of the original test, and without the Factor 2 items. Additionally, only the irst and the general factors presented suficient items and
had good factorial loads for the construct behavioural representation.
In regard to the potential interpretation of factors,
for the igure to be completed, the items that compose Factor 1 require the ability to observe small changes in a continuous coniguration (A items), perception
of symmetry and asymmetry, in addition to verifying
changes in the parts of the whole. Nonetheless, these are characteristics that can be identiied by follow
-ing the movements of the parts of the igure, that is,
inductive reasoning is used at an abstract level. This abstraction is what differs from the items in Factor 2, in which the child needs to discover the part that correctly associates with the remaining parts of the whole, while the missing part is one of the three presented in the
whole, which requires reasoning that is both analogical
and concrete.
The tasks of Factor 3, which are easier items,
demand the ability to perceive differences and
simi-larities in a gestalt/igure. The task consists in illing
in a simple gap with elements already provided in
the igure itself, which is also simple and continuous. Factor 4, composed of more dificult items, requires apprehending logically related igures and producing changes in these igures to conigure a uniied gestalt. The respondent is required to subtract or add elements in these items to generate a fourth igure, which is a continuation of the other three igures, to constitute a uniied gestalt. These are tasks that require abstraction
and eduction.
In regard to the potential interpretation of factors, the items that compose Factor 1 demand an ability to
observe small changes in a continuous coniguration (A
items) and perception of symmetry and asymmetry, in addition to verifying changes of parts of the whole in
however, which can only be identiied by following the movements of the igure; that is, inductive reasoning
at the abstract level is used. This abstraction is what differs from Factor 2’s items, in which the child needs
to ind out the part that is correctly associated with the
remaining three parts of the whole, while the missing part is one of the three presented in the whole, which
requires reasoning that is both analogical and concrete.
An ability to perceive differences and similarities in a
igure is required to solve the tasks in Factor 3, which
is composed of the CPM’s easiest items. The task is
illing in a simple gap with elements already provided in the igure itself, which is also simple and continuous. Factor 4, composed of the CPM’s most dificult items, requires apprehending logically related igures and pro
-ducing changes in these igures to conigure a uniied gestalt. In these items, the respondent is required to subtract or add elements to generate a fourth igure, which is a continuation of the other three igures, to constitute a uniied gestalt. These are tasks that demand
abstraction and deduction.
Data found in the aforementioned studies rein -force the need for further studies to address the dimensionality of CPM. In addition to the fact that a
different quantity of factors and composition of items
was found, there is also a need to improve investigation
of the general factor, as data reported by Pasquali et
al. (2002) and Fajgelj et al. (2010) suggest. In fact, all Raven’s Matrices were developed, in theory, to assess the general factor (g factor) and a speciic factor accord -ing to the bifactor theory of intelligence proposed by
Spearman.
Given the previous discussion, this study’s aim
was to verify the dimensional estructure of Raven’s
Coloured Progressive Matrices (CPM). Because Pasquali et al. (2002) was conducted with a Brazilian sample and with a signiicant number of individuals,
which enabled greater data consistency, this study will
present conirmatory factorial analyses also based on the factors found by Pasquali et al. (2002).
Method
Participants
A total 1,279 children composed the sample: 50.2% were male and no information regarding this
information was provided by 0.4%; an average age of
8.48 years old with a standard deviation of 1.49 years. The distribution of the participants in terms of relative
frequency for each age was 0.5% (ive years old), 13.8%
(six years old), 8.4% (seven years old), 27.3% (eight years
old), 21.5% (nine years old), 22.7% (10 years old), 5.4%
(11 years old), 0.1% (12 years old), 0.2% (13 years old),
and 0.1% (19 years old). The parents or legal guardians
authorized the participation of the children, who were properly assessed in adequate conditions. The results
obtained in this assessment compose the database cur-rently used. The children were distributed according to school year: 1st grade (3.0%), 2nd grade (29.5%), 3rd grade (18.1%), 4th grade (8.8%), 5th grade (29.0%), 6th
grade (3.9%), 7th grade (0.2%), and 7.5% did not report their school year. All the participants lived in the
inte-rior of the state of São Paulo, Brazil.
Instruments
Raven’s Coloured Progressive Matrices (Ange-lini et al., 1999). Raven’s Coloured Progressive Matrices (MPC) is a non-verbal intelligence test, representative of general intellectual capacity or the “g” factor
pro-posed by Spearman (Angelini et al., 1999). CPM was developed to assess children aged from ive to 11 years
old, mentally disabled individuals and the elderly.
Valid-ity, reliability and standardization studies conducted in Brazil included individuals aged from ive to 11 and a
half years old. The test is composed of three sets/scales
(A, Ab and B) with 12 items each. The sum of these
sets composes the general score and there is no score
per scale. The items are organized in ascending difi
-culty over the course of three sets (A, Ab, and B); the B set is more dificult than Ab on average, which in turn is more dificult than the A set on average. The items
consist in a drawing with a missing part, which the indi-vidual needs to complete by choosing one among six alternative responses. There is only one correct answer for each item. The respondents score one for each
cor-rect response and zero for each wrong response. The minimum score is zero and the maximum score is 36.
The instrument can be applied individually or in groups and there are no time limitations.
Procedures
The participants’ scores were obtained by que -rying the databases of four researchers from a public
university in the state of São Paulo, Brazil. Initially, authorizations were asked of the guardians of the
protocols that contained the information from CPM responses. Then the project was submitted to the Eth-ics in Research Committee regulating research with
human beings, asking for authorization of the study
such a database can be characterized as a secondary
source. After approval the Ethics in Research Com-mittee the database was set up with the following information collected from the original protocols: the individuals’ initials, year of birth, age, sex, year of data collection, and CPM responses. The tests were applied
as part of various Master’s and Doctoral studies, one
of the objectives of which was to implement a cog-nitive assessment among these participants through an objective measure. The tests were applied by Master’s
and Doctoral students speciically trained for this activ
-ity and were supervised by professors; all were involved in postdoctoral programs in the ield of psychology.
Overall, data were collected in 19 public schools and one private school located in four cities in the interior
of São Paulo, Brazil.
Data analysis. Seven models were tested with
CPM based on conirmatory factor analysis: a general factor; three factors respective to each scale and one general factor; general factor with a speciic factor com -posed by the items of Factor 1, followed by the same analysis for each set of items in the remaining factors
found in Pasquali et al. (2002); and inally, the general factor was modelled with the four speciic factors pre
-viously mentioned. The irst model was built to verify
the possibility of CPM’s single dimension, despite the fact that studies indicate the existence of more factors. We deemed it important to test the one-dimension
con-iguration that is always attributed to this psychological
test. The second model was based on the separation of items into three scales, which a priori, tend to suggest that these are items with similar characteristics, while there are differences among the groupings. Hence,
these irst two models are grounded on CPM theory. The other ive models are based on the empirical study of Pasquali et al. (2002). In addition to testing a model with a general factor and four speciic factors taken from 1, 2, 3 and 4 factors, which emerged from the analysis reported by Pasquali et al. (2002), another
four models were tested with the general factor and
each specifying one of the factors (1, 2, 3 or 4). Table 1
presents the compositions of the seven models.
The analysis of the factor structure of items of the Coloured Progressive Matrices was performed
using Mplus 7. Since the scores are dichotomous values
(0 and 1), all the factor analyses were performed using a
robust weighted least squares estimator (WLSMV). The models’ goodness of it was veriied using root mean-square error of approximation (RMSEA), the comparative it index (CFI: Bentler, 1990) and the Tucker-Lewis index (TLI: Byrne, 2010). Goodness of it is veriied when RMSEA is equal to or less than 0.05 (Browne & Cudeck, 1993), and CFI is equal to or greater than 0.95 (Hu & Bentler, 1999).
Results
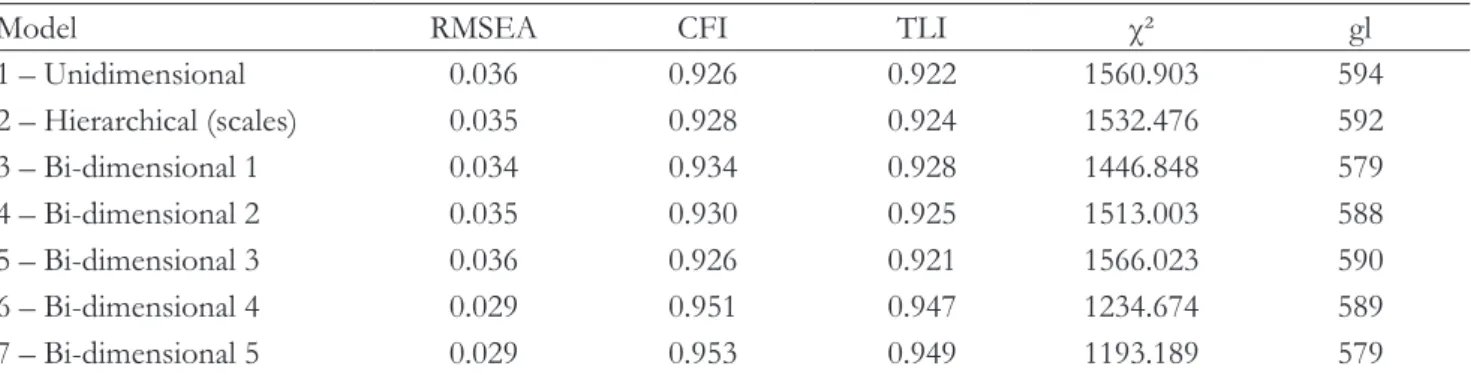
The irst model tested, the one concerning
the instrument’s uni-dimensionality, presented an
Table 1
Models for the Conirmatory Factor Analysis
Model General factor items Speciic factor items
1 – One dimension CPM’s 36 items There is none
2 – Hierarchical CPM’s 36 items Factor 1: 12 items of the A scale Factor 2: 12 items of the Ab scale
Factor 3: 12 items of the B scale
3 – Bi-dimensional CPM’s 36 items 18, 29, 19, 27, 20, 16, 10, 17, 9, 7, 22, 28, 23, 21 and 30 (Factor 1 – Pasquali, Wechsler, Bensusan).
4 – Bi-dimensional CPM’s 36 items 13, 14, 15, 6, 26 and 5 (Factor 2 – Pasquali, Wechsler, Bensusan). 5 – Bi-dimensional CPM’s 36 items 1, 2, 3 and 4 (Fator 3 – Pasquali, Wechsler, Bensusan).
appropriate RMSEA but CFI and TLI did not present satisfactory goodness of it. The second model, called
a hierarchical model because it determines the presence of a second order general factor that explains the A, Ab
and B scales, and these scales in turn explain the per -formance of the participants regarding the items of the
respective scales, presented goodness of it very similar to the irst model. These indings suggest that adding three speciic factors did not improve the explanation
of the factor structure of the Coloured Progressive Matrices. The high betas found in regard to the general
factor in relation to the A, Ab and B scales, 0.983, 0.927 and 1.000, respectively, corroborate the inadequacy of three scales as latent irst order variables and did not improve goodness of it.
The third model determined the presence of a general factor that directly explained the partici-pants’ performance on all the items, as well as Factor
1 suggested by Pasquali et al. (2002). Both factors are
orthogonal to each other. Even though small
improve-ments were found in regard to CFI, TLI and RMSEA in comparison to the irst two models, this model also did not show satisfactory goodness of it according to the CFI and TLI. The fourth model is identical to model three in terms of organization of factors, but postu
-lates the presence of Factor 2, indicated by Pasquali et al. (2002), instead of Factor 1. Goodness of it is
very similar to that found in model 2. Model 5, called
bifactor 3, sustains the presence of a general factor and Factor 3, as suggested by Pasquali et al. (2002), orthogonal to each other, showing goodness of it very
similar to that of model 1. The sixth model, bi-dimen-sional 4, determined the presence of a general factor
and orthogonal to Factor 4 indicated by Pasquali et al., 2002, presenting goodness of it for RMSEA, as well as for CFI and TLI. The seventh model, bi-dimensional 5,
determined the presence of a general factor (as the pre-vious bi-dimensional models) and also postulated the
joint presence of four speciic factors from Pasquali et al. (2002). As this model showed that Factor 1 had zero
variance, this factor was eliminated, so that the general
factor and the speciic Factors 2, 3 and 4 were kept. This model also presented satisfactory goodness of it (like model 6) and CFI, TLI and RMSEA were very
similar to the bi-factorial model 4 indicating that both are considered satisfactory.
Table 3 present betas from the model 6 (bifac -torial 4) and Table 4 present betas from model 7 (bifactorial 5).
The general factor presented an average beta of 0.590 and a standard deviation of 0.127 in the bifac-torial 4 model, while the bifacbifac-torial 5 model and the general factor showed an average beta of 0.582 and a standard deviation of 0.128, changing its average value
and variation very little over the course of the 36 items. Factor 4 of Pasquali et al. (2002), a speciic factor, was
also present in the two models. The average beta values of this factor in the bifactor model 4 was 0.585 and standard deviation of 0.075, while the average beta in the bifactor 5 model was 0.581, with standard devia-tion of 0.075, also presenting very close values. Factors
2 and 3, speciic factors present only in the bifactor 5
model, respectively presented average betas of 0.412
and 0.606 and standard deviations of 0.063 and 0.115.
In the case of models 4 and 5, we also sought to describe the composite reliability of the factors
identiied. Composite reliability is considered to be a
more correct index for multifactor measures because it assesses the reliability of estimated factors, taking into account the betas. The general factor in the bifac-tor 4 model presented a value of 0.952 and Facbifac-tor 4 presented a value of 0.724, indicating that both factors
Table 2
Goodness of it of the Models Tested
Model RMSEA CFI TLI χ² gl
1 – Unidimensional 0.036 0.926 0.922 1560.903 594
2 – Hierarchical (scales) 0.035 0.928 0.924 1532.476 592
3 – Bi-dimensional 1 0.034 0.934 0.928 1446.848 579
4 – Bi-dimensional 2 0.035 0.930 0.925 1513.003 588
5 – Bi-dimensional 3 0.036 0.926 0.921 1566.023 590
6 – Bi-dimensional 4 0.029 0.951 0.947 1234.674 589
generated reliable scores. The general factor in the bifactor 5 model presented a value of 0.950 and Fac-tor 4 presented a value of 0.720, also indicating reliable scores for both factors. Factor 2, in turn, presented a
value of 0.551 and Factor 3 a value of 0.702, indicating that Factor 3 also has reliable factor scores but Factor 2 does not. The minimum value required for composite reliability is equal to alpha, that is, usually 0.70 (Hair et
al., 2009), but since there are authors defending 0.60 for alpha (as well as being the value established as the
mini-mum requirement for documents in the Psychological Tests Assessment System – CFP, 2015), as is the case of Fornell and Larcker (1981), we can consider 0.60 for
composite reliability.
Discussion
The results obtained with the conirmatory fac -tor analyses indicate that CPM can be interpreted by
a general factor and a speciic factor (bi-dimensional model with Factor 4 suggested by Pasquali et al. (2002) or a general factor and three speciic factors (bi-dimen
-sional model with Factors 2, 3 and 4 from Pasquali et
al., 2002). The analysis of the composition of the two models indicates that the bi-dimensional model with
Factors 2, 3 and 4 is the one most interpretable. Fac
-tor 2 of this model, a speciic fac-tor, did not present
satisfactory composite reliability, but reliability would increase and reach acceptable levels if there were a
larger number of items with the same quality as those
that compose the factor.
This study’s results conirm the indings reported
by the other empirical studies presented in the introduc-tion concerning the internal structure of CPM being based on three factors. In regard to the composition of
factors, results conirm part of the indings of Pasquali
et al. (2002) and there are similarities among the factors
that emerged in Carlson and Jensen (1980) and Green and Kluever (1991). It is important to keep in mind that Schmidtke and Schaller (1980) did not report a fac -tor structure but mentions that it is similar to that of Carlson and Jensen (1980). Fajgelj et al. (2010) did not report the internal composition of factors but indicated
the possibility of a general factor, which was conirmed
in this study, reinforcing the presence of this factor. Theoretically, Raven had already envisaged the general factor, as he grounded the construction of items on the
Spearman’s Bifactor theory (1927), which postulated the presence of a general factor and a speciic factor in tests of cognitive capacity. Pasquali et al. (2002) also Table 3
Bifatorial 4 Model (Model 6), Betas and Conidence Intervals
Item Ri Standard
error f4
Standard
error
RA1 0.394 0.038
RA2 0.622 0.114
RA3 0.578 0.090
RA4 0.576 0.061
RA5 0.501 0.043
RA6 0.657 0.030
RA7 0.616 0.027
RA8 0.364 0.035
RA9 0.606 0.028
RA10 0.570 0.029
RA11 0.537 0.041
RA12 0.270 0.041
RAB1 0.723 0.051
RAB2 0.681 0.027
RAB3 0.614 0.033
RAB4 0.668 0.025
RAB5 0.591 0.028
RAB6 0.784 0.020
RAB7 0.717 0.023
RAB8 0.711 0.027
RAB9 0.762 0.025
RAB10 0.459 0.033
RAB11 0.474 0.034
RAB12 0.389 0.043
RB1 0.645 0.071
RB2 0.705 0.027
RB3 0.763 0.022
RB4 0.678 0.024
RB5 0.765 0.021
RB6 0.572 0.028
RB7 0.438 0.037
RB8 0.647 0.037 0.472 0.040
RB9 0.608 0.038 0.630 0.035
RB10 0.548 0.035 0.647 0.036
RB11 0.619 0.035 0.631 0.032
Table 4
Bifatorial 5 Model (Model 7), Betas and Conidence Interval
Item Ri Standard
error f2
Standard
error f3
Standard
error f4
Standard
error
RA1 0.347 0.054 0.500 0.187
RA2 0.581 0.121 0.710 0.180
RA3 0.549 0.091 0.700 0.171
RA4 0.542 0.064 0.512 0.106
RA5 0.457 0.043 0.459 0.094
RA6 0.627 0.030 0.365 0.069
RA7 0.618 0.027
RA8 0.365 0.035
RA9 0.608 0.028
RA10 0.572 0.029
RA11 0.541 0.040
RA12 0.272 0.042
RAB1 0.677 0.052 0.461 0.118
RAB2 0.646 0.028 0.374 0.077
RAB3 0.568 0.034 0.481 0.083
RAB4 0.671 0.025
RAB5 0.593 0.028
RAB6 0.787 0.020
RAB7 0.720 0.023
RAB8 0.713 0.027
RAB9 0.765 0.025
RAB10 0.461 0.033
RAB11 0.476 0.034
RAB12 0.393 0.043
RB1 0.646 0.072
RB2 0.681 0.028 0.329 0.067
RB3 0.766 0.022
RB4 0.681 0.024
RB5 0.767 0.021
RB6 0.574 0.029
RB7 0.442 0.037
RB8 0.650 0.037 0.468 0.040
RB9 0.611 0.038 0.627 0.035
RB10 0.552 0.035 0.644 0.036
RB11 0.625 0.036 0.625 0.032
indicated the presence of a general factor, but it became
less evident than Factor 1 in their study. Similarly, in this study this irst factor was irrelevant.
When analysing each structure of factors that
were conirmed with the current conirmatory analysis, the indings can be interpreted seeking to understand
which cognitive processes are more or less involved
in the luid and inductive reasoning a child uses when
responding to CPM. For instance, Primi (2002) reports various studies discussing the use of working memory
in items as the CPM tasks. Nonetheless, as discussed by Laros, Valentini, Gomes and Andrade (2014), an intel
-ligence test tends to be explained by a speciic ability, a
broad capacity, and by a general factor, which is com-posed of abilities and capabilities. Hence, CPM can be understood to take as a reference the CHC theory, as
tasks that measure the luid reasoning (broad capacity), and, to a greater extent, inductive reasoning (speciic
ability), in addition to general intelligence/capacity. The most complicated task in empirical studies, however, is to identify which capacities and abilities are really being measured, while observing a general factor instead
of speciic factors is most common. This situation
occurs with Raven’s Matrices including CPM, because in theory they are treated as tasks that assess inductive and deductive reasoning, and visual-spatial processing,
among others; empirically, however, we do not know
which abilities and to what extent these abilities are measured. For that, it is necessary to devise study meth-odologies that encompass the application of various
tests of luid intelligence, inductive reasoning and gen -eral intelligence in a set of individuals who complete all these tests and then perform statistical analyses to
identify the contribution of luid and inductive reason -ing in addition to the general factor when complet-ing the tasks.
Therefore, an important aspect to consider before initiating a discussion with the results presented here
is try to understand whether the speciic factors con
-irmed, together with the general factor, are indicators of qualitative levels of cognitive development. That is,
does a better or worse performance on the items of
Factors 2, 3 and 4 indicate stages of a child’s cognitive
development? Observing the items that compose each
factor, those composing Factor 3 are the easiest ones,
making a gestalt, in which the individual needs to
per-ceive the whole of a simple igure and ind the missing part. Factor 2 contains items similar to Factor 3, but the child needs to follow vertical and horizontal lines, in addition to the items that require analogical reasoning
and observe three parts of the whole and ind the miss
-ing part, which requires abstraction. Finally, Factor 4 encompasses the CPM’s ive last items, considered the most dificult ones, and involves induction-by-analogy and igures that change, which requires even more abstract reasoning than that required by the items pre -sented in Factor 2.
Observation of the three blocks of items
indi-cate that solving the items in Factor 3 was easy for all
the children assessed by CPM, while the items in Fac-tor 2 tended to be correctly answered by individuals at
intermediary ages; Factor 4 was correctly answered by
older individuals. It is important to keep in mind that
CPM are proposed for children aged ive and a half years old up to 11 years old. Note that CPM items are ordered by ascending dificulty in each set and the
complexity among sets increases, as well. The
explana-tion for the ascending dificulty is that the three sets of
items are based on a gradual introduction of new more complex types of reasoning so that previous strate-gies prepare the terrain for the construction of later
strategies to solve more dificult items (Bandeira et al.,
2004). Therefore, it is assumed that the resolution of the task is subject to the individual’s cognitive
capac-ity that tends to develop with age. Factors 2, 3 and 4, however, which were conirmed in this study, can be
sets of items that offer a mapping of a child’s stage of cognitive development.
When exploring this hypothesis regarding factors,
such as cognitive screening, we veriied the average scores of factors among the ages from ive to 11 years old. Factor 3 can reach the maximum score of four
points, Factor 2 a maximum of six points and Factor 4
a maximum of ive points. An average score very close to the ceiling effect was found in Factor 3 among chil
-dren from ive years of age, all with scores above 3.9 and with a standard deviation up to 0.30. For Factor 2, the average score for ive year-old children is 4.0,
which increases to 4.6 for six year-old children and to 5.4 for seven-year-old children. Older children pres-ent a gradual small increase up to 11 year-old children,
who reach 5.8; standard deviation is always up to 1.4.
Finally, an average score lower than 1 is observed in factor 4 among children up to eight years old,
reach-ing 1.3 among children aged nine years old, 1.6 for 10 year-old children, and 2.3 for 11 year-old children.
Average scores close to the ceiling effect were
identi-ied in Factors 3 and 2, however, the average obtained
by children in Factor 4 is below half what is needed
children younger than ive years old can also present
cognitive development that is compatible with the
res-olution of Factor 3’s items because most children at the age of ive years old tend to correctly answer the four items. Seven year-old or older children are those
with a higher probability of reaching the ceiling effect in Factor 2. Only nine year-old or older children have a higher probability of correctly answering the items in Factor 4 so that the average score was not even close to the ceiling effect. These results suggest that children who perform successfully on Factor 4 tend to present a cognitive development above that of most 11 year-old children, showing a need for more com-plex cognitive tests.
Neo-Piagetian scientiic literature led by Dr.
Michael Commons has reported a set of evidence that favours the presence of distinct levels of development
in reasoning-related abilities. Different tests with intel -ligence markers have shown a similar empirical pattern of grouping of items and gaps between groupings, indi-cating that these tests are capable of inferring stages
of development. Commons et al. (2008) and Dawson-Tunik, Goodheart, Draney, Wilson and Commons
(2010) found evidence of groups of items representing stages of proportional logical reasoning through the
Balance Beam Task. Golino, Gomes, Commons and
Miller (2014), in turn, report evidence of six different stages of inductive reasoning through the Inductive
Reasoning Developmental Test (irst version). All
these studies adopted tests constructed to infer stages of development, adopting the model of hierarchical complexity to ground the construction of items. Even though CPM were not developed to directly measure different levels of reasoning development, it is possible to ascertain some distinct levels.
When comparing current indings with what Raven postulated as the ive levels of cognitive devel -opment, successive in the development of tasks, some interpretations can be formulated in regard to the
fac-tors: a) Factor 3 involves distinguishing similarities and differences in igures (irst level); b) Factor 2 involves assessing the orientation of the igure in the percep
-tual ield, both in regard to itself and in regard to the
remaining objects, in addition to perceiving two or
more united igures forming the whole (second and third levels); c) Factor 4 demands analysis of the parts
perceiving the whole, while distinguishing between what seems real and what the child adds, involving also a comparison of analogical changes in the perceived parts, using it as a strategy of logical reasoning (fourth
and ifth levels). The interpretative possibilities cur -rently developed, however, are suppositions derived from observation and current analyses, since it was not possible to identify empirical studies addressing these levels of development as postulated by Raven. Hence,
they can encourage other researchers to relect on this issue and favour the interpretative process of indings
concerning the CPM.
This study’s aim was to investigate the CPM’s structure and, based on the results, contribute to
qualitative arguments seeking to understand potential
stages of cognitive development among school-aged children. The most prominent elements were high-lighted through observing the resolution of tasks in the
CPM based on conirmed speciic factors, in addition
to the general factor or intelligence derived from the
conirmatory analyses conducted in this study. These developmental issues, however, require further empiri -cal studies, as well as interpretation concerning which abilities CPM really measure and to what extent the abilities are measured, as previously discussed. One of the main limitations of this study (and of any study that investigates only the composition of factors to identify the structure of a construct or cognitive test) emerges from these contingencies, because it does not show what is being measured and to what extent a latent trait is being measured given the characteristics of the
ana-lytical methods that are available and used. Despite the
need to develop studies to identify which capabilities are really being measured by CPM, the results show that a general factor of intelligence is what seems to be assessed. Hence, CPM remain important to assessing
the construct of intelligence among Brazilian children.
References
Angelini, A. L., Alves, I. C. B., Custódio, E. M., Duarte, W. F., & Duarte, J. L. M. (1999). Manual. Matri-zes progressivas coloridas de Raven: Escala especial. São Paulo: Centro Editor de Testes e Pesquisas em
Psicologia.
Bandeira, D. R., Alves, I. C. B., Giacomel, A. E., & Lo
-renzatto, L. (2004). Matrizes progressivas coloridas de Raven: Escala especial – Normas para Porto Alegre, RS. Psicologia em Estudo, 9(3), 479-486. Re
-trieved from http://www.scielo.br/pdf/pe/v9n3/ v9n3a15
of a developmental test for stage identiication:
Two exploratory studies. Behavioral Development Bul-letin, 19(3), 37-54. doi: 10.1037/h0100589
Green, K. A., & Kluever, R. C. (1991). Structural pro
-perties of Raven´s Coloured Progressive Matrices
for a sample of gifted children. Perceptual and Motor Skills,72, 59-64. doi: 10.2466/pms.1991.72.1.59
Hu, L.T., & Bentler, P.M. (1999). Cutoff crite
-ria for it indexes in cova-riance structure
analysis: Conventional criteria versus new alter-natives. Structural Equation Modeling, 6(1), 1-55. doi:10.1080/10705519909540118
Laros, J. A., Valentini, F., Gomes, C. M. A., & Andrade, J. M. (2014). Modelos de inteligência. In A. G. Sea
-bra, J. A. Laros, E. C. Macedo & N. Abreu (Eds.),
Inteligência e funções executivas:Aavanços e desaios para a
avaliação neuropsicológica (pp. 17-38). São Paulo: Edi -tora Memnon
Pasquali, L.; Wechsler, S., & Bensusan, E. (2002). Matri
-zes progressivas do Raven infantil: Um estudo de validação para o Brasil. Avaliação Psicológica, 2, 95-110. Retrieved from http://pepsic.bvsalud.org/
pdf/avp/v1n2/v1n2a03.pdf
Primi, R. (2002). Inteligência luida: Deinição fatorial, cognitiva e neuropsicológica. Paidéia, 12(23), 57-75. doi: 10.1590/S0103-863X2002000200005
Schmidtke, A., & Schaller, S. (1980). Comparative study of factor structure of Raven´s Coloured Pro -gressive Matrices. Perceptual and Motor Skills, 51,
1244-1246. doi: 10.2466/pms.1980.51.3f.1244 Schneider, W. J., & McGrew, K. (2012). The
Cattell-Horn-Carroll model of intelligence. In D. Flanagan
& P. Harrison (Eds.), Contemporary Intellectual
Assess-ment: Theories, Tests, and Issues (3rd ed.) (p. 99-144).
New York: Guilford.
Sisto, F. F; Rueda, F. J. M., & Bartholomeu, D. (2006).
Estudo sobre a unidimensionalidade do teste
Ma-trizes Progressivas Coloridas de Raven. Psicologia:
Relexão & Crítica, 19(1), 66-73. Retrieved from http://www.scielo.br/pdf/prc/v19n1/31294.pdf Spearman, C. (1927). Las Habilidades del Hombre Su
Na-tureza y Medición. Buenos Aires: Editorial Paidos. Recebido em: 11/11/2014
Reformulado em: 31/05/2015
Aprovado em: 09/06/2015 Retrieved from http://www.ncbi.nlm.nih.gov/
pubmed/2320703/
Browne, M.W., & Cudeck, R. (1993). Alternative ways of assessing model it. In Bollen, K. A., Long, J. S.
(Ed.) Testing structural equation models (pp.136 -162).
Newbury Park: Sage.
Byrne, B. M. (2010). Structural equation modeling with MPLUS: Basic concepts, applications, and programming.
New York: Routledge, Taylor & Francis.
Carlson, J. S., & Jensen, C. M. (1980). The factorial struc-ture of the Raven Coloured Progressive test: A reanalysis. Educational and Psychological Measurement,
80, 1111-1116. doi: 10.1177/001316448004000440 Cattell, R. B. (1966). The scree test for the number of factors.
Multivariate Behavioral Research, 1(1), 245-276.
Commons, M., Goodheart, E., Pekker, A., Dawson, T., Draney, K., & Adams, K. (2008). Using Rasch
scaled stage scores to validate orders of
hierarchi-cal complexity of balance beam task sequences. Journal of Applied Measurement, 9(2), 182-199.
Conselho Federal de Psicologia – CFP (2015). Sistema de Avaliação de Testes Psicológicos – SATEPSI.
Retrieved from http://satepsi.cfp.org.br/
Dawson, T., Goodheart, E., Draney, K., Wilson, M., &
Commons, M. (2010). Concrete, abstract, formal, and systematic operations as observed in a ‘Piag-etian’ balance-beam task series. Journal of Applied Measurement, 11(1), 11-23. Retrieved from http:// www.ncbi.nlm.nih.gov/pubmed/20351445
Fajgelj, S., Bala, G., & Katic´, R. (2010). Latent structure of Raven´s Colored Progressive Matrices. Collegium Antropologicum, 3(34), 1015-1026. Retrieved from https://bib.irb.hr/datoteka/485527.10173_Fa -jgelj.pdf
Flanagan, D. P., & Ortiz, S. O. (2001). Essentials of cross--battery assessment. New York: John Wiley & Sons, Inc. Fornell, C., & Larcker, D. F. (1981). Evaluating struc
-tural equation models with unobservable variables
and measurement error. Journal of Marketing Research, 18(1), 39-50. Retrieved from http://
connection.ebscohost.com/c/articles/5012883/ evaluating-structural-equation-models-unobserva -ble-variables-measurement-error-comment
Nota dos autores:
Agradecimentos: agradecemos às pesquisadoras Edna Maria Marturano, Martha Zanini, Elaine Gardinal, Renata Raspantini e Suélen Fernandes por cederem as informações que compuseram o banco de dados deste trabalho.
Sobre os autores:
Monalisa Muniz é doutora em Psicologia, área de Avaliação Psicológica, pela Universidade São Francisco, pro
-fessora adjunta do Departamento de Psicologia e Pós-Graduação em Psicologia da Universidade Federal de São Carlos-UFSCar e pesquisadora do Laboratório de Desenvolvimento Humano e Cognição-LADHECO. Tem expe
-riência na área de Psicologia, com ênfase em Fundamentos e Medidas da Psicologia, atuando principalmente nos seguintes temas: avaliação psicológica, inteligência, avaliação dinâmica, inteligência emocional, desenvolvimento e aprendizagem.
E-mail: [email protected]
Cristiano Mauro de Assis Gomes é psicólogo, doutor em Educação, professor do Departamento de Psicologia,
do Programa de Pós-Graduação em Psicologia e do Programa de Pós-Graduação em Neurociências da Universidade Federal de Minas Gerais e bolsista de Produtividade do CNPq, nível 2. Possui experiência em Psicologia Escolar e do Desenvolvimento e atua principalmente nos seguintes temas: investigações sobre a arquitetura e desenvolvimento cognitivo, construção e validação de instrumentos de medida psicológicos e educacionais, intervenção e desenvolvi -mento cognitivo.
E-mail: [email protected]
Sonia Regina Pasian é doutora em Psicologia, professora associada da Universidade de São Paulo, trabalhando no
Departamento de Psicologia da Faculdade de Filosoia, Ciências e Letras de Ribeirão Preto (FFCLRP-USP), onde é coordenadora do Centro de Pesquisas em Psicodiagnóstico e coordenadora do Programa de Pós-Graduação em Psicologia desse departamento. Tem experiência na área de Psicologia Clínica e de Avaliação Psicológica, com ênfase em pesquisas de adaptação de instrumentos de avaliação psicológica ao contexto sociocultural brasileiro, investigando
especialmente métodos projetivos.
E-mail: [email protected]
Contato com os autores:
Monalisa Muniz
Departamento de Psicologia da Universidade Federal de São Carlos Rod. Washington Luís, km 235
Caixa Postal: 676