regional committee
PAN AMERICAN
HEALTH
ORGANIZATION
XVI Meeting
WORLD
HEALTH
ORGANIZATION
XVII Meeting
Washington, D. C.
September-October 1965
Provisional Agenda Item 11-A
CD16/13 (Eng.)
12 July 1965
ORIGINAL: ENGLISH- SPANISH
A. REPORT ON THE STATUS OF MALARIA ERADICATION
IN THE AMERICAS
XIII REPORT
TABLE OF CONTENTS
Page
Introduction ... ... 1
I. Status of the Malaria Eradication Program ... 1
A. General Picture ... 1
B. Current Extent of the Problem ... 4
C. Field Operations ... 13
II. Special Technical Problems ... 106
A. General ... 106
B. Evaluation of Methods for Solving Problems of Continuing Transmission ... 106
a) Change to an alternate insecticide ... 106
b) Rescheduling or increasing the cycles of DDT ... 107
C. Anti-larval measures ... 107
D. Mass Drug distribution ... 108
E. Chloroquinized-salt programs ... 110
F. Long-acting repository drugs ... 110
G. Field test of disc flow regulators for spraying ... 111
H. Poor suspensibility of DDT ... 111
I. Stimulation and coordination of operational research ... 111
III. Research on Malaria . . . .. . . . 111
A. Malaria Eradication Epidemiology Team - AMRO-0210 ... . 111
B. Insecticide Testing Team - AMRO-0209 ... 112
C. Resistance of Malaria Plasmodia Strains to Drugs - AMRO-0212 112
IV. International Cooperation .113
-i-MAPS AND TABLES
Maps: Page
1 Status of the Malaria Eradication Program in the Americas,
31 December 1963 ... 2
2 Status of the Malaria Eradication Program in the Americas,
31 December 1964 ... 3
3 Mass Drug Program in El Salvador ... 109
Tables:
1 Comparison of 1963 and 1964 Population and Area in various phases of the Malaria Eradication Programs in the Americas, and Percentages
of change by phase ... ... 4
2 Progress in Malaria Eradication Programs in the Americas ... 5
3 Status of Malaria Eradication in the Americas, by Population, 1964 . 6
4 Status of Malaria Eradication in the Americas, by Area, 1964 ... 7
5 The Extent and Nature of Problem Areas and remedial Measures taken
and Planned as of December 1964 ... 8
6 Mass Drug Programs in the Americas, 1964 ... 12
7 Personnel Employed in Malaria Eradication Programs in the Americas
31 December 1963 and 1964, by Category ... 14
8 Personnel Employed in Spraying Operations in Malaria Eradication
Programs in the Americas - 31 December 1964 ... 15
9 Personnel Employed in Epidemiological Evaluation in Malaria
Eradication Programs in the Americas - 31 December 1964 ... ; 16
10 Personnel Employed in Administrative and Other Services in Malaria
Eradication Programs in the Americas - 31 December 1964 ... 17
11 Personnel Employed in Transport Services in Malaria Eradication
Programs in the Americas - 31 December 1964 ... . 18
12 Means of Transport in Malaria Eradication Programs in the Americas -1964 ... 20
13 National Budgets for Malaria Eradication in the Americas, 1963-1965 21
14 Comparative Results of Active and Passive Case Detection in Malaria
Eradication Programs in the Americas, 1964 ... 22
15 Summary of Case Detection in the Americas, 1958 - 1964 ... 23
16 PAHO/WHO Full-time Professional and Technical Staff assigned to Country, Inter-Country and Inter-Zone Malaria Eradication Projects
in the Americas, from 1962 to May 1965 ... 114
-MAPS AND TABLES (Cont.)
Tables: Page
17 Fellowships for study Travel in Malaria Eradication, 1963 and 1964 115
18 Equipment and Supplies, excluding drugs, contributed by PAHO to Malaria Eradication Programs in the Americas, 1958 to December
1964 ... 116
19 Drugs Provided by PAHO to Malaria Eradication Programs in the Americas, 1958-1964 ... 117
20 International Contributions to malaria Eradication Programs in the Americas, 1964 and estimated 1965 ... 118
Country Tables showing the Status of the Malaria Eradication Programs at December 1964: Argentina ... 24
Bolivia ... 27
Brazil (Excl. Sao Paulo) ... 30
Brazil (Sao Paulo) ... 33
Colombia . ... 36
Costa Rica .. ... 39
Cuba ... 42
Dominican Republic ... 45
Ecuador ... 48
El Salvador ... 51
Guatemala ... 54
Haiti .. ... 57
Honduras ... 60
Jamaica ... 63
Mexico ... 65
Nicaragua ... 68
Panama ... 71
Paraguay ... 74
Peru ... 77
Trinidad and Tobago ... 81
Venezuela ... 83
British Guiana ... 86
British Honduras ... 89
Dominica ... 91
French Guiana ... 93
Grenada and Carriacou ... 95
-MAPS AND TABLES (Cont.)
Page
Guadeloupe. .... ... ... . . .. ... 97
Panama Canal Zone ... ... . ... 99
St. Lucia... . ... ... 101
Surinam ... 103
-CD16/13 (Eng.) Page 1
REPORT ON THE STATUS OF MALARIA ERADICATION IN THE AMERICAS
XIII REPORT
Introduction
The Director of the Pan American Sanitary Bureau has the honor to present to the XVI Meeting of the Directing Council the XIII Report on the status of malaria eradication in the Americas.
The report consists of four chapters. The first contains information on the status of the program in general and also country-by-country summaries of progress, depicting the history and present condition of each program in tables and graphs. The second chapter discusses special tech-nical problems which have arisen. The third chapter concerns research in malaria currently in progress; the last chapter, international cooperation in malaria eradication programs.
The data presented are taken from the answers by each country to a detailed annual ques-tionnaire and from monthly and quarterly statistical reports submitted to the Pan American Sanitary Bureau by most of the programs, supplemented by data from plans of operation. Special technical reports concerning research projects are also presented when appropriate.
I. STATUS OF THE MALARIA ERADICATION PROGRAMS
A. General Picture
The progress made in 1964 toward eradicating malaria from the Hemisphere cannot be summed up and expressed in a global figure; the situation was complex, with different trends in different regions. In most programs satisfactory progress was made, but in a number of those in Central America and in Mexico, the situation was stationary or deteriorated. Maps 1 and 2 and the summary presented in Table 1 permit comparison of the over-all status at the end of 1964 with that at the end of 1963.
During 1964 two countries completed their consolidation phase and they are in process of receiving certification of the eradication of malaria - Jamaica and Trinidad and Tobago.
The population of consolidation areas shows a decrease compared with December 1963, from 33.9 million persons to 32.3 million. This change is the combined result of the progression of many relatively small areas in various programs from attack to consolidation phase, and the re-gression of areas with about 3.4 million persons from consolidation to attack phase in Mexico, where persistent transmission has resisted attack measures in problem areas and re-infection of previous-ly clean regions has occurred. The countries showing the greatest numbers of persons in areas placed in consolidation during 1964 are Colombia, Honduras, Ecuador, and the State of Sao Paulo in Brazil; a number of other programs shifted areas with smaller populations. In addition to Mexico, programs which were forced to return areas from consolidation to attack included Guatemala, Nica-ragua and Venezuela (NicaNica-ragua also shifted some attack areas into consolidation, with a net gain in population and loss in area in the consolidation phase).
CD16/13 (Eng.)
Page 2
UNITED STATES
GUATEMALA
.VENEZUELA
FISH
HONDURAS
"o O
BAHAMA ISLANDS
)
CAICOS, TURKSD
BERMUDAD BRITISH VIRGIN ISLANDS
/ u. S. VIRGIN ISLANDS
ANGUILLA
/ / ,ST. KITTS, NEVIS
ANTIGUA
/
BARBUDA GUADELOUPE
DOMINICA
C X MARTINIOUE
ST
LUCIAST. VINCENT
3---
~
aBARBADOS--- GRENADA
JM G U A TRINIDAD,
>h-9R. GUIANA TOBAGO
GUIANA
S40 PAULO STATE
N
PARAGUAYCHI
AREAS IN WHICH MALARIA HAS DISAPPEARED OR NEVER EXISTED
W0
~
f
AREAS WHERE MALARIA HAS BEEN ERADICATED AREAS IN THE CONSOLIDATION PHASEAREAS WHERE THE CONSOLIDATION PHASE HAS | | NOT BEEN REACHED AND WHERE MALARIA EXISTS
ARGENTINA
STATUS OF THE MALARIA ERADICATION PROGRAM IN THE AMERICAS, 31 DECEMBER
1963.
MAP
I.
CD16/13
(Eng. )
Page 3
AND CAICOS ISLANDS
)AN6UILLA
)BARBUDA
SH HONDURAS
RITISH GUIANA
N SURINAM
INIDAD AND TOBAGO
ENCH GUIANA
ECUAD
''i
IAI
SIO PAULO STATE
NPARAGUAY
URUGUAY
ZJ
II AREAS IN WHICH MALARIA HAS F= -IDISAPPEARED OR NEVER EXISTED3
I
AREAS WHERE MALARIA HAS BEEN ERADICATED---3 AREAS IN THE CONSOLIDATION PHASE
FM
AREAS WHERE THE CONSOLIDATION PHASE HAS NOT BEEN REACHED AND WHERE MALARIA EXISTSARGENTINA
Jr
JLV.
STATUS OF THE MALARIA ERADICATION PROGRAM IN THE AMERICAS,
31 DECEMBER 1964.
MAP 2.
NEZUELA
CD16/13 (Eng.) Page 4
Table 1
COMPARISON OF 1963 AND 1964 POPULATION AND AREA IN VARIOUS PHASES OF THE MALARIA ERADICATION PROGRAMS IN THE AMERICAS,
AND PERCENTAGES OF CHANGE BY PHASE
Phase 1963 1964 Percentagechange
A. Population in thousands:
1. Malaria eradication claimed or registered ... 56 546 57 414 + 1.5
2. Consolidation phase ... 33 901 32 277 - 4.8
3. Attack phase ... 31 910 34 426 + 7.9
4. Preparatory phase or not yet started ... 29 664 34 525 + 16.4
B. Area in km2
1. Malaria eradication claimed or registered ... 2 874 214 2 874 313 + 0.003 2. Consolidation phase ... 2 411815 2 109 589 - 12.5
3. Attack phase ... 3 378 932 3219017 - 4.7
4. Preparatory phase or not yet started ... 7 663 009 7 852 697 + 2.5
For some programs, part of the areas listed in Tables 3 and 4 as in attack phase were actually "in recess", with no active attack measures in progress for lack of funds. Such areas existed in El Salvador, Haiti, Nicaragua and Colombia.
In Haiti, spraying was stopped in large areas including 2.0 million persons and these were placed under intensified surveillance, but were not formally classified as in the consolidation phase.
The area in preparatory phase, or with no program in operation has increased through the addition of some areas in southeastern Colombia,where attack measures have been discontinued. Paraguay still remained entirely in this phase at the end of the year and expects to begin attack operations in the last quarter of 1966. In Argentina, the provinces of El Chaco and Formosa also continued in preparatory phase.
During 1964 administrative problems continued to be the primary hindrance to better progress: technically adequate methods are known for interrupting transmission in most of the areas with persistence, but funds, personnel and efficient administration were frequently lacking. The progress made in improving administration in the Dominican Republic and Colombia continued, the program inBrazil is striving to improve its organization although much remains to be accomplished in this respect. The campaigns in Panama and Central America suffered seriously from the lack of adequate financial resources, as did that in Mexico.
In view of their proximity and the problems they have in common, closer coordination of the various campaigns in Central America and Panama is necessary; PAHO is strengthening its malaria eradication advisory services in Zone III in order to work more effectively in this sphere. Consultations were held during the year to determine the varying legal frameworks of the different countries within which coordinating activities must operate.
B. Current Extent of the Problem
CD16/13 (Eng.) Page 5
Table 2
Population in thousands
Year Malaria
I
Annual % of increaseeradication Consolidation
claimed or phase Malaria Consolidation
achieved eradication
claimed
phase
1960 50741 1 991
1961 53 357 13 879 5.2 597.1
1962 55 397 25 914 3.8 86.7
1963 56 546 33 901 2.1 30.8
1964 57 414 32 277 1.5 4.8
In addition to Jamaica and Trinidad and Tobago, which have completed eradication and will receive certification during 1965, the program in Dominica is successfully completing its con-solidation phase. British Honduras, Bolivia. Costa Rica, Cuba, the Dominican Republic, Ecuador, Honduras, Peru and Venezuela are making good progress with their campaigns, despite the exist-ence of some problems and the occurrexist-ence of setbacks in some areas during the year.
Other programs face more serious technical or administrative problems which are still to be overcome. The areas with technical problems are listed in Table 5, which shows the extent of the area and population involved in each country, causes so far discovered for the existence of the problem, the measures which had been applied up to the end of 1964 and the results obtained as of that date.
It should be noted, in reading Table 5. that the remedial measures in operation are, in many programs, less than those which are known to be required. In El Salvador, for example, a program of collective treatment for the population of 166,000 in the Departments of Usulut[n. San Miguel and La Uni6n was planned for 1964 but was not instituted because funds were lacking. In Costa Rica, budgetary difficulties prevented the initiation during 1964 of semi-annual cycles of diel-drin in areas of persistent transmission where excito-repellency of the vector toward DDT is assessed as an important cause and also interrupted the normalprogress of the campaign in both problem and non-problem areas. In Guatemala, supplementary attack with drugs was scheduled for 1964 for 195,000 permanent residents and 154,000 temporary residents in areas of high vector resistance to insecticides, but could be carried out only among 20,000 persons in normal collective-treatment programs and for 19,600 additional persons who were treated by personnel of cotton plantations where they were employed, in a cooperative program of the plantations and the malaria service. During this year of inadequate attack measures, cotton cultivation and the area with DDT-resistant vectors expanded continuously. The adverse effects on the malaria eradication program are appar-ent in the Guatemala country tables relating to epidemiological evaluation operations, to be found on page 56.
CD16/13 (Eng.) Page 6
Table 3
STATUS OF MALARIA ERADICATION IN THE AMERICAS, BY POPULATION, 1964 (Population in thousands)
Population of originally malarious areas
Country or other Total Malaria
political unit population a eradication Consolidation Attack or program
Total claimed
(maintenance phase phase not yet
(maintenance started
phase)
Argentina ... 21 480 2 738 1021 627 329 761
Bolivia ... 4 266 1353 - 1141 212
Brazil ... 80 332 40 291 2183 6 289 3 1 8 1 9b
Canada ... 19 272 -
-Chile ... 8 369 134 134 -
-Colombia ... 17 505 9 569 - 6 053 3154 c 362
Costa Rica ... 1 387 423 - 294 129
Cuba ... 7 256 2 239 - - 2 239
Dominican Republic ... 3 452 2 830 - - 2 830
Ecuador ... 4 813 2 652 - 1053 1599
E1 Salvador ... 2828 1900 - 1 900d
Guatemala ... 4 278 1 919 - 1057 862
Haiti ... 4 494 3 533 - - 3 533 e
Honduras ... 2030 1900 - 1631 269
Jamaica ... ... 1706 1365 - 1365
-Mexico ... 39 494 20 212 - 12 740 7 472
Nicaragua ... 1740 1 671 - 695 976f
Panama ... 1 210 1 165 - -1 i65
Paraguay ... 1900 1579 - - - 1579
Peru ... 10794 3 292 43 2 204 1 045
Trinidad and Tobago ... 962 822 - 822
-United States ... 191 300 46 400 46 400
-Uruguay ... 2996 - -
-Venezuela 8... 8 336 6 225 5822 116 287
Antigua ... 60 -
-Bahamas ... 133 -
-Barbados ... 235 231 231
Bermuda ... 48 -
-British Guiana ... 631 631 589 - 42
British Honduras ... 104 104 - 104
-Dominica ... 60 14 - 14
-Falkland Islands ... 2 - -
-French Guiana ... 35 35 - - 31 4
Grenada and Carriacou ... 93 39 39 -
-Guadeloupe ... 298 266 266 -
-Martinique ... 309 192 192 -
-Montserrat ... 13 -
-Netherlands Antilles ... 206 -
-Panama Canal Zone ... 51 51 - 50 1
Puerto Rico ... 2 572 2 556 2556 -
-St. Kitts-Nevis-Anguilla .. 62 -
-St. Lucia ... 99 84 84
-St. Pierre-Miquelon ... 5 - -
-St. Vincent ... 86 -
-Surinam ... 315 190 - 128 62
Virgin Islands (U. K ) .... 8 - -
-Virgin Islands (U. S. ) .... 41 37 37 -
-Total ... 447 666 158 642 57 414 32 277 34 426 34 525
- None
(a) Latest available official figures. (b) Part of this population is partially protected by irregular spraying.
CD16/13 (Eng.) Page 7
Table 4
STATUS OF MALARIA ERADICATION IN THE AMERICAS, BY AREA, 1964 (Area in km2)
Originally malarious areas
Country or other Total Malaria
political unit area eradication Consolidation Attacep. phase
Consolidation Attack or program
Total claimed
(masinenance phase phase not yet
(maintenance started
phase)
Argentina ... Bolivia ... Brazil ... Canada ... Chile ... Colombia ... Costa Rica ... Cuba ... Dominican Republic ... Ecuador ... El Salvador ... Guatemala ... Haiti ... Honduras ... Jamaica ... Mexico ... Nicaragua ... Panama ... Paraguay ... Peru ...
Trinidad and Tobago ... United States ... Uruguay ... Venezuela ...
Antigua ... Bahamas ... Barbados ... Bermuda ... British Guiana ... British Honduras ... Dominica ... Falkland Islands ... French Guiana ... Grenada and Carriacou ... Guadeloupe ... Martinique ... Montserrat ... Netherlands Antilles ... Panama Canal Zone ... Puerto Rico.
St. Kitts-Nevis-Angilla .. St. Lucia ...
St. Pierre-Miquelon ... St. Vincent ... Surinam ... Virgin Islands (U. K.) ....
Virgin Islands (U. S. ) ....
Total ...
4 024 458 1 098 581 8 513 861 9974375 741767 1 138 338 51 011 114 524 48442 291 906 21146 108 889 27 750 112088 11 428 1 969 367 139 000 75 650 406752 1 381 800 5 605 9 339 900 186 926 912 050 280 11 396 431 53 215 800 22 696 790 11 961 86000 344 1 779 1 102 84 961 1432 8 896 396 603 240 389 163 820 174 342
41 225 583
349 051 824 260 7445757
55 287 946222 31 526 37 502 39000 175 462 19300 80350 19100 106969 10 028 1 054 775 132 385 69 844 406590 943 200 5 444 2255890
600 000
430
215 800 22696 152 32000 230 1136 300 1 432 8896 510 163750 342 16055616
40 100
55 287
31 040
2255890
469552 f
430 10 600 230 1 136 300 8 896 510 342 2874 313 66963 619 540 190 675 120777 23 281
19198
19 282
97100 10 028 539 731 91799
268 210 5 444
7 681
22696 152
1 432 g
5 600
2109589
- b i S
85922 204 720 363 205
427 281 b 8 245 37 502 39000 156 264 19 3 0 0c 61 068 19 100d 9869 515 044 40586e 69 844 643 950 122767 205 200 32000 (g)
158 150
3219017
156066
6891877a
398 164
406 590
7852697
- None.
M 00'~.
0t
I Z
Table 5
THE EXTENT AND NATURE OF PROBLEM AREAS AND REMEDIAL MEASURES TAKEN AND PLANNED, AS OF DECEMBER 1964
Insecticide Remedial' Measures
Country and Population Are2)a Vector Causes of Problem
name of area (k) Kid Kind Years of In operation Planned Results
coverage in 1964 for 1965
British Guiana
Rupununi 8750 6000 (a) 4 A. darlingi Chloroquine-resistant DDT spraying, 2 1/2 Yr. Continue Good
P. falciparum Rad. treatment,
Pyrime-thamine or quinine for relapses.
Costa Rica
Jicaral-Puntarenas 2 251 223 DDT 7 Known: Excito-repellency to Mass treatment with Substitute DLN Good results in
Matapalo-Aguirre 2 684 266 .". . A. albimanus DDT; peri-domiciliary chloroquine-primaquine spraying semi- Mass Treatment
Puerto Cortes-Osa 1 709 169 " " A. punctimacula biting; open construction bi-weekly; DDT spraying annually for DDT; areas but not all
Sierpe-Osa 1 321 130 " " of houses; internal mi- intra and peri-domicili- Continue Mass areas requiring
Tinoco-Osa 1781 176 Suspected: gration of population. arly. Radical Treat. of and Radical Treat. Treat. included
Golfito 1482 146 pseudo- cases and contacts for lack of funds.
Colorado-Golfito 846 82 punctipennis
Samara-Nicoya 906 89
12 980 1241
El Salvador
Coast 0 to 100 m. Resistance to DDT; DDT spraying Mass treatment No progress in
of Depts. of Excito-repellency to recent years
Usulutan, San Miguel 166 000 1 807 DLN 1 A. albimanus DDT; migration of Pop.
and La Uni6n DDT 8 aggressions to spraying;
new houses. Coast, 0 to 100 m.
of Depts of Ahuacha- 130 000 2'200 DLN 1 . .. DDT spraying; Mass Continue Good
pan, Sonsonate, La DDT 8 Treatment with
Chloro-Libertad, La Paz, quine-Primaquine
bi-San Vicente 296 000 4 007 weekly
General Note: Unless otherwise noted, DDT and DLN sprayings are at standard doses and intervals.
Table 5 (Cont.)
THE EXTENT AND NATURE OF PROBLEM AREAS AND REMEDIAL MEASURES TAKEN AND PLANNED AS OF DECEMBER 1964
Insecticide Remedial Measures
Country and Area
Country and Population (kie 2a) d Years of Vector Causes of Problem In operation
name of area (kni2) Kind Years of In operation Planned
name ot area
K ind
I
R esults.overage mn1 1 9 for 1965
Guatemala
Pacific coas, 329 358 6 109 I DLN 2 A. albimanus Resistance to DDT and Mass treatment in cotton Mass Treatment Poor (western 2/3) DDT 6 A. pseudopuncti- DLN; excito-repellency; plantations
pennis (rarely) migration; new houses
Moyutla 12066 310 .. Excito-repellency; DDT; Radic-al T: eat.., Good
migration, new houses mass Treat. 4 months bi-weekly
Jalapa 71069 1 324 ... .. Resistance to DDT and Larviciding in Capital Larvicides Insufficient DLN. internal migratio Distirct
Baja Verapaz 27870 675 .. .... Resistance to DDT and None Larvicides None DLN, internal migration
Alta Verapaz 78 025 2112 .. .... Internal migration; Improved spraying Insufficient
518 388 10 530 open construction of houses
Haiti
Petit-Goave 44 091 200 DDT 2 1/2 A. albimanus Aggresions to spraying; Mass treatment, Chloro- Cont. Mass treat. Too soon to tell habits of population Pyrimethamine 3 week
schedule Honduras
Southern area 132 517 3 682 DDT 4 A. albimanus Resistance to DDT and Malathion in quarterly Mass treatment; Insufficient Mal. 1 1/2 DLN cycles, but interrupted malathion in
and delayed by lack of limited foci funds
Mexico
Tapachula-Suchiate 41 648 1 204 DDT 4 A. albimanus Partial resistance to DDT; Radical treatment. Mass treatment Transmission
DDT and DLN persists
Basin middle 40 596 3 078 .. .. A. pseudopunct. Internal migration; Prompt spraying; s Grijalva river A. albimanus open houses Radical treatment '
0d 0
aq O_
(D c,
W-an
P
li
Table 5 (Cont. )THE EXTENT AND NATURE OF PROBLEM AREAS AND REMEDIAL MEASURES TAKEN AND PLANNED AS OF DECEMBER 1964
Insecticide Remedial Measures
Country and |Population (ea2) Vector Causes of Problem
naefara(ki2) K Yiears of IIn operation Planned
name of area Kind coverage in 1964 Results
for 1965
Mexico (Cont. )
North Slope, Sierra Chiapaneca
Isthmus, Gulf slope
Ravine Miguel Alemdn Dam
Upper basin of Papaloapan river Huastecas
Upper basin of Sta. Maria river
Southern Pacific Coast
Basin of the Balsas river and tributaries
Morelos Valley
Coast of Colima and Pihuamo
Coast of Nayarit
Basin of the Santiago river and tributaries
Basin rivers and Pacific coast
albimanus pseudopunct.
..
A. albimanus
A. pseudopunct.
A. albimanus
A. pseudopunct.
A. albimanus A. pseudopunct.
A. pseudopunct.
A. pseudopunct.
A. pseudopunct.
A. pseudopunct.
A. pseudopunct.
A. albimanus i. pseudopunct.
Not yet determined
Excito-repellency to DDT, exophagy; new houses
Population movements
Exophagy; new houses
Aggressions; new houses Aggressions because of bed-bugs
Excito-repellency, aggressions;new houses Aggressions (studies in progress)
New houses
Not yet determined
Not yet determined
Population movements; new houses
Excito-repellency; exophagy; new houses
Radical treatment
Prompt spraying and radical treatment
Added BHC to DDT
4-month spraying cycles
Prompt spraying
Prompt spraying;
Radical treatment Radical treatment
(a)
All purpose functionaries Larvicides
I . I L
~
, .Transmission persists
Problem disap-pearing
Improving
Transmission persists
..
(a) A pilot Plan of Integrated Attack including DDT thrice a year, intensive case-detection and 5-day radical treatment with additional measures if necessary, began in October 1964 on the south coast of the Pacific area and will continue. Larviciding and other current measures will be continued.
DDT .. 4 I?? A. A. 238 138 156 662 117736 18 749 579035 23153 950723 1349733 205548 58 426 94 636 96 929 220160 10495 13 467 3 562 1757
12 307
Table 5 (Cont.)
THE EXTENT AND NATURE OF PROBLEM AREAS AND REMEDIAL MEASURES TAKEN AND PLANNED AS OF DECEMBER 1965
Insecticide Remedial Measures
Country and Population (Kre) name of area Years of Vector (Km2) Kind Causes of Problem
In operation Planned
coverage in 1964 for 1965
Mexico (Cont.)
Basins of Fuerte and 132 908 27 693 DDT 4 A. pseudopunct. People sleep outdoors Radical treatment Transmission
Mayo rivers 4 324 780 290455 persists
Nicaragua
Departments of: 767 051 19 021 DDT 3 or 4 Known: Resistance of A. albi- Malathion; mass treat- Continue Good
Managua Mal. A. albimanus manus to DDT and DLN ment with
chloroquine-Leon pimaquine bi-weekly
Chinandega Suspected:
~~~~~~~~~Madriz
~A.
pseudopunct.Esteli occasionally
Surinam
Upper Surinam 14 138 ... DLN 2 or 3 A. darlingi Refusal of spraying for Health education; Medicated salt Insufficient
Marowijne 2 954 ... DDT 2 social and religious substitution of DLN beginning in 1966
Tapanahony 5 956 ... reasons; refusals be- for DDT
Lawa 2 356 ... cause of
DDT-resist-ance of cockroachs
25 404
pa 0
,_Pio
Ur (D
CD16/13- (Eng. ): Page 12
Table 6
MASS DRUG PROGRAMS IN THE AMERICAS, 1964
Population Area Planned
Country trLoceated (K 2) ion Drug Cycle for 1965 measures
Bolivia .... 308 770 Quebrade de Tonina Chloroquine- 2 weeks C DDT spraying
Depto. de Chiquisa- primaquine ca
E1 Salvador 130 000 2 200 Coast of: , . E a DDR spraying,
Ahuachapan, Sonso- larviciding
nate, La Libertad, San Salvador, La Paz, San Vicente
Guatemala 68866 ... Nueva Concepci6n, ." " Eb DDT spraying
Oc6s, Moyutla, cotton plantations
Haiti ... 44091 200 Petit Goave Chloroquine- 3 weeks E _
pyrimetha-mine
Nicaragua 28056 1477 Some localities in Chloroquine- 2 weeks E Malathion
Depts. Madriz, primaquine spraying;
Managua, Chinan- larviciding
dega
Venezuela 116 614 ... . Oriental and "1 week: C Spray;
occidental 85 922 pers.
peri-domi-2 weeks: ciliary;
29094 pers. fogging
1 month: 1 598 pers.
C = To be continued E = To be expanded
CD16/13 (Eng.) Page 13
Mexico still faces problems of persistent transmission in areas with over 4.3 million persons. Transmission is at low levels but continues without further reduction. Experiments were made during the year with larviciding and varying schedules of spraying with some success. A program of attack integrating intensified DDT-spraying and case-finding with radical treatment of
all cases was initiated in the problem areas of Oaxaca State on the south coast with financial support from WHO. Complete attack on the problem areas during 1964 was prevented by inadequate financing; it is expected that in 1966 the Government will be able to provide the substantially increased budget required.
In British Guiana, chloroquine-resistant strains of Plasmodium falciparum caused adoption of DDT-spraying in 1962 in an area of the interior, supplementing the chloroquinized-salt program which was the main attack measure. This program achieved good results after an interruption in
early 1963, and cases are now confined to a few foci.
A summary of programs of collective treatment of populations with anti-malarial drugs is presented in Table 6. This attack measure has increased in importance and will undoubtedly play a large role as a complementary method in the future in problem areas with resistant or excitable vectors or a considerable proportion of outdoor biting.
In general, events during 1964 have shown that where technical measures properly adapted to the existing situation are thoroughly applied, satisfactory results are obtained, but that in the absence of adequate attack covering all the areas with transmission combined with good surveillance in all cleared areas, transmission may rise and the work of eradication become longer and more difficult.
C. Field Operations
The personnel engaged in national malaria eradication programs is shown by category of operations and by type of work in Table 7. Tables 8 to 11 show available details of personnelby country.
Spraying operations personnel were slightly more numerous at the end of 1964 thanthey had been at the end of 1963. The increase occurred mainly in Brazil's federal program, where additional areas were brought into attack phase. Honduras also employed more spraying-operations personnel at the end of 1964 than at the end of the preceding year, but this reflects primarily the drop in personnel in late 1963 due to financial difficulties. In El Salvador, spraying cycles were so timed as to take place in only six months of the year, so that there were no spraying personnel at 31 December; spraying was carried on in 1964 and will be continued in 1965. In Haiti, the drop in personnel stems from the cessation of spraying in large areas, discussed above. The decrease in Surinam is an indication of difficulties experienced by the program in the interior of the country, where refusals by the people of the interior to permit spraying increased, for various social reasons, during the year. To overcome some of the objections, operational changes were attempted in order to obtain the cooperation of the people. The most promising one was to hire spraymen in each vil-lage among members of each family group, train them in spraying techniques, supervise their work closely and pay each one according to the number of houses sprayed. The approach is unorthodox, but special approaches must be devised when special populations are being dealt with.
CD16/13 (Eng.)
Page 14
Table 7
PERSONNEL EMPLOYED IN MALARIA ERADICATION PROGRAMS IN THE AMERICAS
31 DECEMBER 1963 AND 1964, BY CATEGORY
(Part-time personnel in parentheses)
Title
1963
1964
Engineers ...
Spraying Chiefs (non-professionals) ...
Sector Chiefs ...
Squad Chiefs ...
Spraymen ...
Draftsmen ...
SUB-TOTAL ...
Physicians ...
Entomologists ...
Entomologist Assistants ...
Statisticians and Statistician Assistants...
Evaluation Inspectors ...
Evaluators ...
Microscopists ...
SUB-TOTAL ...
Administrators ...
Administrative Assistants ...
Accountants ...
Disbursing Officers ...
Storekeepers .
Assistant Storekeepers ...
Secretaries .
Others .
SUB-TOTAL ...
Transport Chiefs, Mechanics and Assistant
Mechanics
...
Drivers .
Motorboat Operators ...
Boatmen .
SUB-TOTAL ...
GRAND TOTAL .
119(1)
166 (2)
646 (2)
1 923 (2)
9584 (20)
133
12 571 (27)
278 (18)
31 (1)
262 (12)
119
507 (2)
3693 (7)
756(14)
5 646 (54)
317 (1)
947
34
51
96
104 (1)
351 (1)
1852 (56)
3 752 (59)
507
1 464 (2)
223 (2)
36
2 230 (4)
24 199 (144)
117 (1)
208 (2)
662(2)
2 082 (2)
10036 (20)
141
13 246 (27)
271 (13)
21 (1)
247 (12)
139
770 (5) a
4 188 (9) a
747 (15)
6 383 (55)
347 (1)
1 123
38
50
106
93 (1)
351 (1)
1 645 (32)
3 753 (35)
579
1 557 (2)
229 (2)
28
2 393 (4)
25 775 (121)
(a) Includes personnel engaged in mass drug treatment and larviciding.
To
Fa
a
0
C9
rz
0j
w
0,
a 0
N w
z
CD16/13 (Eng.) Page 15 Table 8
PERSONNEL EMPLOYED IN SPRAYING OPERATIONS IN MALARIA ERADICATION PROGRAMS IN THE AMERICAS - 31 DECEMBER 1964
(Part-time personnel in parentheses)
Sanitarians
Country or otherl Eieer or Sector Squad Sraymen Draftsmen
political unit Spraying Chiefs Chiefs
-Chiefs
Argentina ... 148 2 6 11 28 96 5
Bolivia a ... 34 1 7 3 3 20
Brazil (Excl.Sao Paulo)b .. 5 334 29 56c 229 800 4 183 37
Brazil (Sao Paulo) ... 606 9 - 33 128 418 18
Colombia ... 706 3 16 54 1 3 2d 487 14
Costa Rica ... 46 1 1 7 8 28 1
Cuba ... 515 1 4 15 74 419 e 2
Dominican Republic ... 527 3 - 14 75 434 1
Ecuador b ... 570 6 - 36 96 431 1
El Salvador ... 3 1 - - - 2
Guatemala ... 335 1 22f 8 46 254 4
Haiti ... 661 6 8 22 96 524 5
Honduras ... 113 - 3 3 16 91
Mexico ... 2446 45 58 117 385 1 818 23
Nicaragua ... 126 - 4 28 15 77 2
Panama ... 257 - 6 10 43 197 1
Paraguay ... 34 2 6 2 18 - 6
Peru ... 303 5 9 34 51 198 6
Trinidad and Tobago ... 30 - - 8 7 12 3
Venezuela ... 331 1 - 20 33 269 8
British Guiana ... 9 1 - - 1 7
French Guiana ... 29 - - 2 7 20
Guadeloupe ... 37 - - 1 6 30
Panama Canal Zone ... (27) (1) (2) (2) (2) (20)
Surinam ... 46 - 2 5 14 23 2
Total 13 246 (27) 117 (1) 208 (2) 662 (2) 2 082 (2) 10 036 (20) 141
- None
Table 9
PERSONNEL EMPLOYED IN EPIDEMIOLOGICAL EVALUATION IN MALARIA ERADICATION PROGRAMS IN THE AMERICAS - 31 DECEMBER 1964
(Part-time personnel in parentheses)
Country or other Assistant Statisticians and Evaluation
T
MicroscopistspoliticalunitTotal Physicians Entomologists E ist an n to Evaluators and Laboratory
political unit Entomologists Statisticians' Inspectors
Assistants personnel
Argentina ... 164 9 1 4 2 25 99 24
Bolivia a 123 8 1 4 6 28 61 15
Brazil (excl.Sao Paulo)ub 1782 57 3 24 51 297 1 185 165
Brazil (Sao Paulo) ... 239 12 1 12 1 32 124 57
Colombia ... 496 16 - 7 4 55 377 37
Costa Rica ... 91 1 - - 2 3 72 13
Cuba ... 42 7 1 2 4 3 9 16
Dominican Republic ... 61 2 1 4 6 4 27 17
Ecuador b ... 161 9 1 5 1 - 111 34
E1l Salvador ... 216 5 - 7 4 10 17 0C 20
Guatemala ... .. 144 3 1 19 6 -16 c 77 c 22
Haiti ... 197 8 3 11 9 15 c 109 c 42
Honduras ... 121 2 - 2 1 12 82 22
Jamaica ... 105 2 - 7 - 4 77 15
Mexico .... 988 81 1 33 2 70 7 0 6c 95
Nicaragua ... 224 5 1 6 7 91 c 98c 16
Panama ... 43 2 1 3 4 - . 23 10
Paraguay ... 66 5 1 13 10 2 23 12
Peru ... 209 16 1 6 15 3 126 42
Trinidad and Tobago .... 125 1 - 40 - 1 75 8
Venezuela ... 661 17 2 25 - 71 c 497 c 49
British Guiana ... 24 (1) (1) - - 3 - 16 5
British Honduras ... 12 1 - _ - 2 7 2
Dominica ... 7 (1) (1) - _ _ 1 5 1
French Guiana ... 4 1 1 - 2
Grenada ... 25 (2) - - 10 _ 14 1 (2)
Guadeloupe ... 12 (8) 1 1 1 3 (2) 6 (6)
Panama Canal Zone ... (40) (10) (1) (12) _ (2) (3) (12)
St. Lucia ... 7 (3) (1) - - 4 (1) 3 (1)
Surinam .... ... 34 1 1 4 22 6
Total ... 6 383 (55) 271 (13) 21 (1) 247 (12) 139 770 (5) 4 188 (9) 747 (15)
- None
(a) June. (b) November.
& d a a a b &
Table 10
PERSONNEL EMPLOYED IN ADMINISTRATIVE AND OTHER SERVICES IN MALARIA ERADICATION PROGRAMS IN THE AMERICAS - 31 DECEMBER 1964
(Part-time personnel in parentheses)
Country or other dminis- A tie DisbursinAccountants Storekeepers Secretaries Others
Total trative Accountants Storekeepers
political unit trators Ai tants Officers Assistants
Assistants
Argentina .... .. 130 4 64 - 4 8 3 [ 47
Bolivia a ... 35 9 5 5 _- - 8 8
Brazil (excl. Sao Paulo) b. 1 596 274 564 23 - 29 - 20 686
Brazil (Sao Paulo) ... 408 15 85 - 9 7 13 - 279 c
Colombia ... 2 235 2 7 - 15 14 8 60 129
Costa Rica ... 17 17 7 - - 2 1 1 5
Cuba ... ... 28 1 4 1 2 5 15
Dominican Republic ... 22 1 3 - - 1 1 5 ! 1
Ecuadorb ... 105 5 13 - 4 6 - 20 57
El Salvador ... 38 1 1 - 1 1 4 8 22
Guatemala ... 36 1 8 - - 3 - 4 20
Haiti ... 109 6 5 3 3 5 3 18 66
Honduras ... 51 1 5 2 - 1 - 15 27
Jamaica ... 9 (1) 2 - - - 1 3 3 (1)
Mexico ... 555 15 236 - 16 15 25 138 110
Nicaragua ... 40 - 5 - - 1 7 8 19
Panama ... 31 1 4 - - 2 9 4 11
Paraguay ... 51 1 25 - - 1 1 7 16
Peru ... 180 1 65 4 1 5 5 15 84
Trinidad and Tobago ... 24 2 15 - - 3 1 2 1
Venezuela ... ...
British Guiana ... 10 - - 1 1 1 7
British Honduras ... 4 1 - - 2 1
Dominica ... 1(1) (1) - - 1
-French Guiana ... 3 - - 1 2
Grenada ... 1(1) 1 - - (1) -
-Guadeloupe ... 3 (26) 1 _- - - 2 (26)
Panama Canal Zone ... (2) _- _ - _ - - (2)
St. Lucia ... (4) _- - - (1) (3) d
Surinam ... 31 1 2 - 1 2 3 2 20
Total ... 3 753 (35) 347 (1) 1 123 38 50 106 93 (1) 351 (1) 1 645 (32)
... No information. - None
(a) June. (b) November. (c) Includes personnel of Chagas disease control. (d) Spraymen.
aq
a
(Cog
CD oM
CD16/13 (Eng. ) Page 18
PERSONNEL EMPLOYED
Table 11
IN TRANSPORT SERVICES IN MALARIA ERADICATION PROGRAMS IN THE AMERICAS - 31 DECEMBER 1964
(Part-time personnel in parentheses)
Transport Chiefs,
Country or other Total Mechanics Drivers Motorboat Boatmen
political unit and operators
Assistant Mechanics
Argentina ...
Boliviaa ...
Brazil (excl. Sao Paulo)b ....
Brazil (Sao Paulo) ...
Colombia ...
Costa Rica ...
Cuba ...
Dominican Republic ...
Ecuador b ...
El Salvador ...
Guatemala ...
Haiti ...
Honduras ...
Mexico ...
Nicaragua ...
Panama ...
Paraguay ...
Peru ...
Trinidad and Tobago .-...
Venezuela ...
British Guiana ...
British Honduras ...
Dominica ...
French Guiana ...
Guadeloupe ...
Panama Canal Zone ....
Surinam ...
Total ...
59 43 1032 250 237 11 13 73 74 41 30 70 40 126 61 9 21 70 30 35 12 3 1 6 6 . (4). 40
2 393 (4)
27 8 246 19 56 2 6 17 12 15 1 30 8 85 2 5 1 18 3 . .. 2 1 2 13 579 32 21
7 4 2c
228 63 9 7 56 62 25 29 39 32 25 51 4 18 29 27 31d 6 1 1 4 4 (2) 11
1 557 (2)
14 38 3 101 1 1 16 8 23 4 3 1 (2) 16
229 (2)
a i i i a
... No information - None.
(a) June. ' (b) November. (c) Includes two airplane pilots. (d) 23 fogging machine operators.
.
~
~
~ ~~
. I I6
17
2
3
CD16/13 (Eng.) Page 19
Some increase occurred in the total number of persons in administration and related ac-tivities, due to increases in Brazil, where the federal program increased its personnel in this cate-gory by several hundred. A number of programs experienced decreases, some, as in Peru, related to re-structuring of zone divisions to meet the current needs of the campaign more economically, without hampering its efficiency.
In transport operations also, an increase in personnel took place which was greatest in the Brazilian federal program. In Peru, increased attention to activities in the Amazon basin region is reflected in the increase in motorboat operators. Venezuela increased the number of operators of machines for insecticidal fogging. Decreases occurred in the transport category in Sao Paulo, El Salvador and Guatemala, and smaller changes in other programs.
Table 12, showing details of means of transport in use in the various programs, shows the increasing use of motorcycles, which have more than doubled in number, and of bicycles which also doubled. These changes accompany increasing evaluation operations and drug distribution programs, which require one-man transport. An increase of almost 20 per cent occurred in the number of motorboats used in the campaigns, while the number of boats without motor, already low, fell further. Venezuela increased the number of fogging machines, used for peridomiciliary fogging of vegetation. Means of transport - two-wheeled, four-wheeled, and fluvial - have as usual been provided promptly by UNICEF in the kinds and quantities recommended by PAHO.
The figures country by country for national budgets for malaria eradication in 1963 and 1964 and amounts committed for 1965 are shown in Table 13. By comparing the amounts actually provided to the programs in 1964 with the amounts committed for that year (shown in last year's report), it can be seen that five countries provided more than originally planned, -these were Argentina, Bolivia, Costa Rica, Honduras and Venezuela, all countries which were experiencing some difficulty either in financing or in technical matters. Four of these, although they had increased their financing above the committed level, were still considered underfinanced. Four programs provided exactly the amount committed; and seven provided very nearly the committed amount, al-though of the seven, six fell slightly short. Among the territories. British Guiana increased the amount of the national malaria budget significantly, while British Honduras and Dominica reduced theirs as a result of progress in their programs. Grenada and Surinam programs received what had been committed.
When commitments for 1965 are compared with amounts provided in 1964, a slight de-crease can be noted. This decrease is more than accounted for by the reduction in the national budget of the federal Brazilian program, for which a new plan of operations has been elaborated ex-tending activities over a somewhat longer period than had been anticipated previously. This exten-sion was required for financial reasons, and is possible within a true eradication program only because the great size of the country permits eradication to be carried out successively region by region.
Programs in South America which made a sizeable increase in their budget commitments in 1965 include Argentina, Bolivia (this would merely restore the total budget to its 1963 level), Co-lombia, Ecuador, Paraguay and Venezuela. Of these programs four were underfinanced in 1964 and three are still considered underfinanced. In the Isthmus of Panama and Central American region, Guatemala and Panama have increased their commitments greatly compared with 1964. Guatemala had increased its budget last year also and the 1965 commitment is double the 1963 budget. In Pana-ma, the 1965 budget will restore the program's funds to the level planned but not actully met in 1964, plus an increase of some 7 per cent. In the Caribbean, Haiti has doubled its commitment (this program, like that of Bolivia in prior years, is primarily externally financed by USAID), Cuba has increased its budget slightly, the Dominican Republic planned to increase its by about 14 per cent, while Jamaica and Trinidad and Tobago, both now finished with their consolidation phase, have reduced their commitments.
I'dC C(D
tD O
CD i
Table 12
MEANS OF TRANSPORT IN MALARIA ERADICATION PROGRAMS IN THE AMERICAS - 1964
Trucks
Country or other Trucks and Boats SadAutomobidle
political unit (3 tons or "Pick-up" Jeeps station Motorcycles Bicycles Motor without and pack Other
more) (less than motor animals
l13 tons) wagons
Argentina ... 10 106 17 13 1 21 -
-Bolivia ... 23 37 2 18 54 35 - 95
Brazil (Excl. Sao Paulo) 54 354 807 34 - 232 150 9 787 2a
Brazil (Sao Paulo) ... 11 158 58 13 - 1 11 - - 2
Colombia ... 16 143 122 37 2 77 153 - 867
Costa Rica ... 1 8 14 3 - 80 11 - (b)
Cuba ... - 36 29 14 - - - - 158
Dominican Republic ... 1 64 15 3 5 c 14 - - 6
Ecuador ... 4 50 37 12 30 10 16 21 326
El Salvador ... 2 49 13 8 48 1 1 -
-Guatemala ... 1 42 14 22 51 40 9 1
-Haiti ... 5 69 13 22 - 2 1 - 16
Honduras ... 2 35 30 7 20 50 1 - 157
Jamaica ... - 14 16 8 - - - -
-Mexico ... 15 436 347 2 9 2 394 d
Nicaragua ... 2 17 34 10 _ 11
-Panama ... - 52 20 8 11 - 20 - (b)
Paraguay ... - 10 15 2 3 2 15 1 12
Peru ... 3 108 66 - - 1 48 13
-Trinidad and Tobago ... 9 9 9 2 - _ _ 1
-Venezuela ... 3 92 72 27 19 314 122 - 560 62e
British Guiana ... - 2 5 4 1
British Honduras ... - 2 8 1 - 3 7 4
-Dominica ... - 3 - 4 - - -
-French Guiana ...
Guadeloupe ... 1 4 6
Panama Canal Zone ... - 2f - - - 2 f
St. Lucia ... _ _ 3
Surinam ... 1 2 5 1 4 6 24
- None.
(a) Airplanes. (b) Rented as needed.
CD16/13 (Eng.) Page 21
Table 13
NATIONAL BUDGETS FOR MALARIA ERADICATION IN THE AMERICAS, 1963-1965
(in thousands of U. S. dollars)
National
Country or other National Budget National Budget Commitments
political unit 1963 1964 1965
1965
Argentina ... 520 951 1 392
Bolivia ... - 83 160
Brazil (Excl. Sao Paulo) ... 3 395 11277 8 900*
Brazil (Sao Paulo) ... 1 123 1 242 2 241
Colombia ... .... 2 333 2 333 2 778*
Costa Rica ... 270 264 264
Cuba ... 1 684 1 778 1 861
Dominican Republic ... 772 1 127 1 284
Ecuador ... 685 715 1 045
E1 Salvador ... 366 732 ...
Guatemala ... 452 738 990*
Haiti ... ... 50 50 100
Honduras ... 300 300 300*
Jamaica ... 267 249 167
Mexico ... ... 5 675 6 322 5 974*
Nicaragua a ... .. 453 453 443*
Panama ... 589 518 690*
Paraguay ... 256 258 294*
Peru ... 937 950
Trinidad and Tobago ... 473 470 426
Venezuela ... 3593 3 947 4 296
British Guiana ... ... 39 67 ...
British Honduras ... 33 24 25
Dominica ... .... 9 9 10
French Guiana ... ...
Grenada ... 1 1 1
Guadeloupe ... 147 186 192
Panama Canal Zone ... 50 50 50
St. Lucia ... 5 3 4
Surinam ... 288 301 298
Total ... 24 765 35 398 34 185
- None
... No information
Table 14
COMPARATIVE RESULTS OF ACTIVE AND PASSIVE CASE DETECTION IN MALARIA ERADICATION PROGRAMS IN THE AMERICAS, 1964
~d
0 P Uaq C_ (DDCD C0
.aq
Active case detection Passive case detection
Blood slides Blood slides Average
Country or other A Average Average Average Average of slidesof slides
political unit nmeofproduction number of o ocin per month per
political er unit Number Per cent per evaluator notification Number Per cent productive
examined positive per month posts perexamined positive notification
post
Argentina ... 102 152 934 0.1 124.9 1 299 232 28 788 1.4 10.3
Bolivia ... 87 108 097 2.0 103.5 2 545 581 47 443 2.8 6.8
Brazil (excl. Sao Paulo) 1 167 643 911 4.4 46.0 18 829 7 112 597 331 13.5 7.0
Brazil (Sao Paulo) .... 229 454 406 0.1 165.4 4 949 1 768 80 216 1.7 3.8
Colombia ... 302 289 152 1.4 79.8 7 889 4138 210 371 5.0 4.2
Costa Rica ... 67 111721 0.5 138.9 654 141 11 564 5.5 6.8
Cuba ... 9 38 995 0.2 361.1 548 266 237 475 0.2 74.4
Dominican Republic ... 29 87 552 0.2 251.6 1 192 352 33 659 0.4 8.0
Ecuador ... 113 66181 0.3 48.8 4 443 2 280 248 519 1.8 9.1
El Salvador ... 59 95 784 1.9 135.3 2 000 1 656 255 059 9.4 12.8
Guatemala ... 126 178 619 3.0 134.8 2 244 1 104 110439 13.7 8.3
Haiti ... 63 281601 3.0 372.5 2 051 978 191696 5.5 16.3
Honduras ... 64 75769 2.0 98.7 2 238 1101 131 231 3.9 9.9
Jamaica ... 62 55 249 0 74.3 711 82 79 575 0.0 80.9
Mexico ... 323 1 216 462 0.7 313.8 25755 3 977 378 861 1.4 7.9
Nicaragua ... 65 153 836 3.4 197.2 1 692 919 93 775 8.3 8.5
Panama ... 20 55 156 1.1 229.8 1 105 261 76 731 1.6 24.5
Paraguay ... 37 31 072 3.6 70.0 2 605 a 836 a 72 097' 10.7 7.2
Peru ... 119 383 820 0.4 268.8 8 821 1 184 110199 0.5 7.8
United Statesb... 16 0 .... ... ... 90 86.7
Trinidad and Tobago .. 75 28 583 0 31.8 82 82 53455 0.006 54.3
Venezuela c ... 499 248 602 1.1 55.4 2 331 413 125 508 1.5 33.8
British Guiana 16 b 50 253 0.4 261.8 78b 23 b 4 932 0.3 17.9
British Honduras ... 8 5 255 0.2 54.7 127 71d 6 571 0.3 7.7
Dominica ... 6 8 026 0 111.5 26 21 8 128 0 32.3
French Guiana ... _- - - 16 10 3025 1.6 25.2
Grenada ... 1 517 0 43.1 - -
-Guadeloupe ... 9 21810 0 201.9 ... ... 21 0 ...
Panama Canal Zone ... 3 e 1 147 0 63.7 ... ... 25 081 0.1 ...
St. Lucia. ... 3 13 368 0.03 371.3 - -
-Surinam ... 24 72115 0.6 250.4 54 . 9 4441 28.9 41.1
·.. No information - None
CD16/13 (Eng.) Page 23
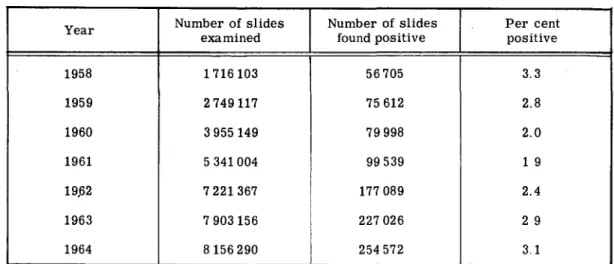
Table 15
SUMMARY OF CASE DETECTION IN THE AMERICAS, 1958-1964
Number of slides Number of slides Per cent
examined found positive positive
1958 1 716 103 56705 3.3
1959 2 749 117 75 612 2.8
1960 3 955 149 79 998 2.0
1961 5 341004 99 539 1 9
19.62 7 221 367 177 089 2.4
1963 7 903 156 227 026 2 9
1964 8 156 290 254 572 3.1
The Central American countries in which the malaria campaigns face serious technical problems, and Costa Rica where some problem areas also remain, are taking steps to provide con-siderably higher budgets over the next three years. in order to permit their programs to attack the existing problems with thorough, technically-adequate campaigns, in a coordinated manner through-out Central America.
Table 14 sets forth data on active and passive search for cases in each program. It is clear from inspectionof the columns showing per cent of positive smears among those taken in active search and those taken by the passive network that the latter is consistently more productive of cases. This is to be expected since the persons from whom blood-samples are taken by passive search are self-selected as possible malaria cases.
CD16/13 (Eng.) Page 24
Country: ARGENTINA Date attack phase began: 1 August 1959
STATUS OF MALARIA PROGRAM AT DECEMBER 1964
Population A km2
(thousands)
TOTAL COUNTRY 21480
Non malarious areas 18 742
Originally malarious areas
Maintenance phase 1 021
- J~~n
Consolidation phaseAttack phase
Preparatory phase
Total originally malarious areas
4 024 458
3 675 407
40 100
627 66963
329 85922
761 156066
2738 349051
PERSONNEL
Activity Professional
f
Non professionalI
TotalSpraying operations 2 146 148
Evaluation operations 11 153 164
Administrative and other - 130 130
Transport - 59 59
Total 13 488 501
TRANSPORT FACILITIES
Type OSpraying Evaluation Mixed or other Total
Operations Operations operations
Four wheel vehicles 53 50 43 146
Two wheel vehicles - 18 4 22
Boats . .
Animals _ _
Other
ARGENTINA (Cont.)
SPRAYING OPERATIONS
Houses sprayed Inhabitants directly protected Insecticide used Average houses
coverage Planned Sprayed Planned Protected DDT man/day
1st 81619 5 849a 288 768 205189 263
2146b
1st Aug. 59-Jun. 60 81170a ..
2nd 92438 6909b 6909b 347 012 330733 255
3rd 84 011 78487a 323 610 327 209 305
2nd Jul. 60-Jul. 61 6442b
74188a
4th 84 077 2 8038b 308142 282178 334
3rd Aug. 61-Jun. 62 5th 81906 23 6 8052b 303 290 280425 383 6th 96 249 73 027 a 341 780 259 379 349
7th 97 908 63 967 a 351098 229 432 353
4th Jul. 62-Jun. 63 8th 95552 54392a288 182273 329
3 5 0b
9th 90 333 46 627 a 317 972 164 420 320 5th 10th Jul. 63-Jun. 43 572 64 39 430a .135 574 122 685 324 6th Jul. 64-Dec. 64 11th 50 322 44 972 a 172 313 153 995 302 (a) Sprayed twice a year. (b) Sprayed once a year.
1st 2nd 3rd
120 i I V a o t I 360
o100 __ _ ___ (~\\\\(\\x,,,\,,,,,__ _ _ _ _ 300
~~~~~~~~~~~~~~~~~80
~
~
~
~
~
240~~~~,60
/\\\\X\\\\\l\\\\\___ 184th 5th 6th 7th Mth 9th IUth 11tn
Year 1959 1960 1961 1962 1963 1964
l
il i? !7
. Inhabitants to be directly protectedm
Inhabitants directly protectedHouses to be sprayed
60
C.
0
pU
R
0-)a
0
p.
aq
0 atC
0r
(Dq
Houses sprayed
z
0
EnM
W
3·' 0
rz
C
Ca
0:s 0: Ca-
0'Pl-\\UU Ue Ux
~UUUU
A · \~I\\\\h\\\\\\RI \\ \\\U\t\\ *
~
\\~\\\~
I~~~l~\ 1\\II CW I INNNII C :t k~~C''t 1WY WCY r~~,\\\\\~~~~i~~-.
,.. ,. .^^A
u- ...,._... ;... ... ....-... .
ARGENTINA (Cont.)
EPIDEMIOLOGICAL EVALUATION OPERATIONS, ATTACK PHASE AREAS
Slides examined Species found
Year of_ _
total Date Total Positive P.
falci-coverage No. P. vivax P. malariae
parupn
coverage No. Number Percentage parum
Ista Aug. 59-Jun. 60 70700 2497 3.53 6 2491
2ndb Jul. 60-Jul. 61 96991 3880 4.00 4 3876
3rd Aug. 61-Jun. 62 107 926 5 081 4.71 1 5 080
4th Jul. 62-Jun. 63 100 342 1 572 1.56 1 1571 1
5th Jul. 63-Jun. 64 93850 549 0.58 * - 549
6th Jul. 64-Dec.64 53 980 140 0.26 - 140
LTION AND MAINTENANCE PHASE AREAS
10 0
so0
(a) Data for entire country; not separated by attack or consolidation phases. (b) Data for attack and consolidation phases, July to December 1960; attack phase only, January to July 1961.
Country: BOLIVIA
CD16/13 (Eng.) Page 27
Date attack phase began: 1 September 1958
STATUS OF MALARIA PROGRAM AT DECEMBER 1964
Population A km2
(thousands)
TOTAL COUNTRY 4 266 1 098 581
Non malarious areas 2913
-Originally malarious areas
Maintenance phase 0
E11
Consolidation phaseAttack phase
Preparatory phase
274 321
0
1141 619540
212 204720
0 0
Total originally malarious areas 1 353
PERSONNEL
Activity Professional Non-professional Total
Spraying operations 34 34
Evaluation operations 11 112 123
Administrative and other 35 35
Transport 43 43
Total 11 224 235
TRANSPORT FACILITIES
Spraying Evaluation Mixed or other
Type Operations Operations operationstal
Four-wheel vehicles 23 34 5 62
Two-wheel vehicles - 51 21 72
Boats 12 22 1 35
Animals 60 35 - 95
Other -
-Total 95 142 27 264
824 260
/
I
-a"
BOLIVIA (Cont.)
SPRAYING OPERATIONS
- None
(a) Includes emergenc 200
o 150
I 100
0
1 50
5.
0
y spraying
800
00
0 Cycle 1st 2nd
Year 119581 - 1959
3rd 4th 5th 6th 1 1960 1 1961
7th 8th 9th
1 1962 1 1963
10th 11th 12th
aqnm
m
v
pz0
$0
1 1964 1
l/. 71:1 Inhabitants to be directly protected
Inhabitants directly protected
- - - -Houses to be sprayed Houses sprayed
Houses sprayed Insecticide used Average
Year of Inhabitants directly per house houses
total Date DDT Dieldrin protected per housesprayed
coverage per
Cycle Planned Sprayed Cycle Planned Sprayed Planned Protected DDT Dieldrin spray-man/day 1st 131444 116572 st 6 6 10 910 627 362 556190 362 8.3
2nd 148 200 129119 691820 627 210 331 7.0
3rd 147 263 136 601 695 521 634859 319 7.6
2nd 11 331 12268 118
nd 4th Sep. 59-Aug. 60 153 514 142 536 692 274 660185 309 7.2
5th 169 690 159 952 742902 700 295 331 7.6
3rd Sep. 60-Aug. 61 6th 142 210 134173 - 612 356 577 743 329 7.5 Sep. 61-Sep. 62 7th 129 600 124 623 546 005 524 986 353 7.9
4th Sep. 61-Sep. 62 8th 135474 128898 551785 525 005 359 8.6
Oct. 62-Sep. 63 9th 32 561 34469 124 643 131962 408 6.0
10th 32 361 28893 110 578 98 727 428 5.9
6th a Oct. 63-Sep. 64 1th 32 361 32160 123 923 123152 533 5.3
Oct.-Sep. 64 12th 28536 27509 101503 97855 547 5.6
,--..-BOLIVIA (Cont.)
EPIDEMIOLOGICAL EVALUATION OPERATIONS, ATTACK PHASE AREAS
Slides examined Species found
Year of
Yetotal
Date Positive P.falci-total Date Total P. vivax P. malariae
coverage
~coverage
No. No. Number Percentage parumparum1st Sep. 58-Aug. 59 50980 1843 3.62 273 1 268 302
2nd Sep. 59-Aug. 60 99 241 1 106 1.12 124 803 179
3rd a Sep. 60-Aug. 61 126 384 735 0.58 90 615 30
4th a Sep. 61-Sep. 62 174800 982 0.56 214 758 10
5th a Oct. 62-Sep. 63 165 200 2 026 1.23 803 1 222 1
6th a Oct. 63-Dec. 63 64 913 679 1.05 281 398
6th- 7thb Jan. 64-Dec. 64 88 368 3 315 3.75 477 2838
Date Origin of infections Species of parasite
Estimated No. of % of Total Imported nclassi
in the area Cd examined
lation
itive tochtho- Relaps- frnm Induced Intro- and no P. falci-fi_
P
malar]4 (thousands) sampled ing from areas duced t parum Piae
1961 1 -4 461 11975 2.6 14 1 1 5 7 - 1 14
1962 1-3 759 18t131 3.2 21 - - 2 19 .- a --1 21
1963 1 - 3 1 179 58 587 7.4 104 18 1 - 73 - 2 10 4 100
-1964 1-4 1141 67172 5.9 139 19 2 4 77 - 16 21 16 121 2
CD16/13 (Eng) Page 30
Country: BRAZIL (Excl. Sao Paulo) Date attack phase began: August 1959
STATUS OF MALARIA PROGRAM AT DECEMBER 1964
Population Area km2 (thousands)
TOTAL COUNTRY
'I3
-J Non malarious a OrMaintenance pha
Consolidation ph
m~ Attack phase
II2
Preparatory ph,65 332
Lreas 27 801
riginally malarious areas
Lse 0
mase
ase
8 266 622
1 048 880
0
0 0
5712 325865
31819 6891877
Total originally malarious areas 37 531
PERSONNEL
Activity Professional Non-professional Total
Spraying operations 29 5 305 5 334
Evaluation operations 66 1 716 1 782
Administrative and other 61 1 535 1 596
Transport - 1032 1032
Total 156 9588 9 '744
TRANSPORT FACILITIES
Type Spraying Evaluation Mixed or other
__ _ypeOperations Operations operations ota
Four-wheel vehicles 717 276 256 .1 249
Two-wheel vehicles - 232 - 232
Boats 102 48 9 159
Animals 664 123 - 787
Other - - 2a 2
Total 1 483 679 267 2429
(a) Airplanes
BRAZIL (Excl. Sao Paulo) (Cont.)
SPRAYING OPERATIONS
Year of Houses sprayed Inhabitants directly protected Insecticide used Average houses
total Date Cycle per house sprayed per
total Datege DDT (g. technical)
spray-Planned Sprayed Planned Protected DDT man/day
(a) Jan. 61-Nov. 61 (a) 820 095 8 1 4 4 7 5 3 399 300 c 3 380 000 c .. .. Jan. 62-Jun.- 62 ... 1622 052 1 350 566 7 016 997 5 843 075 424 ... (a) Jul. 62-Dec. 62 ... 2 292 000 1 960 358 9 724 956 8 317 433 420 ... Jan. 63-Jun. 63 ... 2 062 265 1726 289 8 574 898 7178 751 407 ... (a) Jul. 63-Dec. 63 ... 2 045 534 2 010 035 8 524 558 8 376 676 414 7.5
Jan. 64-Jun. 64 ... 2 532153 1 899 065 10 502 357 7 876 719 412 7.9
L(a)
| Jul. 64-Dec. 64 ... 2 993954 2 350 055 12 310 241 9 662834 419 7.7NT
~ ~
~ ~ ~ ~ ~ ~ ~ ~ ~ ~ ~ ~ ~ ~ ~ ~ ~ ~ ~ ~ ~~~~~~~~~~~.
~
~ ~
~
~ ~
(a) Owing to different spray cycle timing in different regions, these data refer to the calendar year. (b)
3 0 0 0
1
5o
0
CD
CD
Year 2 000 1 800 1 200
8 000 0
6 000 .
4000 X
0
2000
001
60C
0
1961 1962 1963 1964
!!IZiiiiii
i
Inhabitants to be directly protected
\\\\\ Inhabitants directly protected
…Houses to be sprayed
Houses sprayed
Hv 0
p 0
(D C
W
v:
-C.,
I'd 0
(D M
t
--C4C~
R
;z
Vq
BRAZIL (Excl. S[o Paulo) (Cont.)
EPIDEMIOLOGICAL EVALUATION OPERATIONS, ATTACK PHASE AREAS
Slides examined Species found Year of
total Date Total Positive P.
falci-Total
~~~~~~~~~P.
vivax P. malariae~coverage
No. Number Percentage parum(a) Jan. 61-Dec.61 230205 3 6 9 1 2b 16.03 3.620 32 285 2
(a) Jan. 62-Dec. 62 513767 68 371 13.31 22683 45 683 5
(a) Jan. 63-Dec.63 860 681 109 210 12.69 37 502 71 610 98
(a) Jan. 64-Dec.64 1 241 242 109 507 8.82 41 737 67 713 57
(a) Owing to different spray cycle timing in different regions, these data refer (b) Includes 1,005 undifferentiated mixed infections from Espiritu Santo Sector.