Artigo
*e-mail: [email protected]
SPECTROPHOTOMETRIC DETERMINATION OF FAMOTIDINE USING SULPHONPHTHALEIN DYES
Kanakapura Basavaiah* and Okram Zenita
Department of Chemistry, University of Mysore, Manasagangotri, Mysore-570006, India
Recebido em 18/2/10; aceito em 1/12/10; publicado na web em 18/2/11
Four new extraction-free spectrophotometric methods have been established for the quantitation of famotidine (FMT). The methods are based on the formation of yellow ion-pair complexes between FMT and four sulphonphthalein dyes viz., bromothymol blue (method A), bromophenol blue (method B), bromocresol purple (method C) and bromocresol green (method D) in dioxane or acetone medium. The experimental variables such as reagent concentration, solvent medium and reaction time have been carefully optimized to achieve the highest sensitivity. The proposed methods were applied successfully to the determination of famotidine in tablets with good accuracy and precision and without interferences from common excipients. The results obtained by the proposed methods were compared favorably with those of the reference method.
Keywords: famotidine assay; spectrophotometry; tablets.
INTRODUCTION
Famotidine(FMT),3-[2-(diaminomethyleneamino)thiazol-4-ylmethylthio]-N-sulfamoylpropionamidine (Figure 1), is a histamine H2-receptor antagonist (H2-RA) which competitively inhibits the
action of histamine on the H2-receptors of parietal cells and thereby reduces the gastric acid secretion under daytime and nocturnal basal conditions. It is widely used in the management of gastrointestinal disorders, such as aspiration syndrome, dyspepsia, gastro-esophageal relux disease, peptic ulcer and Zollinger-Ellison syndrome.1 FMT is
oficial in both the British Pharmacopoeia (BP)2 and the United States
Pharmacopoeia (USP).3 The BP2 recommends a potentiometric non
aqueous method for the determination of FMT using perchloric acid as the titrant, while the USP3 recommends a similar approach for the
determination of FMT in its bulk form, and an HPLC method using a mixture of acetate buffer of pH 6: acetonitrile (93:7) as a mobile phase with UV detection at 275 nm.
A survey of the literature revealed that FMT has been estimated in pharmaceuticals by UV-spectrophotometry,4 HPLC,5,6 HPTLC,7,8
capillary electrophoresis 9 and electrochemical methods.10-13 Some of
these methods have enough sensitivity to determine lower concen-tration of the drug, however, it is always required to develop simple, fast, inexpensive analytical methods that can be readily adopted for routine analysis at relatively low-cost to the different requirements of analytical problems.
Visible spectrophotometry is still considered to be a very
convenient and economical technique because of its simplicity and speed, the inexpensive equipment needed and accuracy of results. Visible spectrophotometric methods based on diverse reaction chemistries have been proposed for the assay of FMT in pharmaceuticals. Methods based on charge-transfer complexation reactions between famotidine and π acceptors such as chloranil, dichlorodicyanobenzoquinone and dichloronitrophenol,14
tetracya-noquinodimethane15 and p-chloranilic acid16,17 have been used for
its determination in commercial tablets. Many other methods using copper (II) chloride in methanolic medium,18 cupric acetate,19
palladium (II) chloride,20 ninhydrin in DMF medium,21 sodium
nitroprusside in alkaline medium,22 NBS with p-aminophenol,23
Folin-Ciocalteau reagent24 and bromate-bromide25 have also been
reported. Most of the above visible spectrophotometric methods suffer from one or other disadvantage such as poor sensitivi-ty,14,16-19,22,25 poor selectivity,24 use of expensive reagent15 or heating
step,21 narrow linear range,21,23 strict pH control20etc., as indicated
in Table 1. Ali et al.26 have earlier employed bromocresol green
(BCG) and bromothymol blue (BTB) as chromogenic agents in which the ion-pairs formed at speciic pH values were extracted into chloroform before measurement. These procedures involve strict pH control besides the cumbersome extraction step. Many a time, incomplete separation may lead to erratic results.
In the present article, we report the development and validation of four simple, highly accurate and precise spectrophotometric methods using the four dyes based on ion-pair complex formation between the drug and dyes. The hall marks of these methods are that they are free from pH control and extraction step. The methods were demonstrated to be more sensitive than the extraction methods using the same dyes.26 The proposed methods were applied to the
determination of FMT in tablets, and no interference from common excipients in levels found in tablets was observed in the assay. EXPERIMENTAL
Apparatus
106 digital spectrophotometer (Ahmedabad, India) equipped with 1-cm matched quartz cells.
Materials and reagents
All chemicals and reagents used were of analytical-reagent grade. The solvents used were of HPLC-grade.
Two brands of tablets containing FMT, Topcid-20(Torrent Phar-maceuticals Ltd., H. P, India) and Famocid-20 (Sun PharPhar-maceuticals Industries, Jammu, India), used in the investigation were purchased from local commercial sources.
0.03% solution of bromothymol blue (BTB, Loba Chemie, Mumbai, India) and 0.1% solution of bromophenol blue (BPB, Loba Chemie, Mumbai, India) were prepared in dioxane (Merck, Mumbai, India).
0.01% solution each of bromocresol purple (BCP, Loba Che-mie, Mumbai, India) and bromocresol green (BCG, Qualigens Fine Chemicals, Mumbai, India) were prepared in acetone (Merck, Mumbai, India).
Standard solution preparation
Pharmaceutical grade FMT, certiied to be 99.98 % pure was procured as gift from Cipla India Ltd., Mumbai, India, and was used
as received. A 200 µg/mL stock standard solution was prepared by dissolving the calculated amount of pure FMT either in dioxane (Mer-ck, Mumbai, India) (method A and method B) or in acetone (Mer(Mer-ck, Mumbai, India) (method C and method D) and diluted to a deinite volume with the respective solvents. The stock solutions were diluted to get working concentrations of 20 µg/mL for method A and method B, and 15 µg/mL for method C and method D with the respective solvents. Sample preparation
Tablets
Ten tablets were accurately weighed and powdered. A portion equivalent to 5 mg FMT was accurately weighed and transferred into two separate 50 mL volumetric lasks, 30 mL of dioxane or acetone was added to the lasks and the content was shaken thoroughly for 15-20 min to extract the drug into the liquid phase; the volume was inally diluted to the mark with either dioxane or acetone (50 mL lask), mixed well and iltered using a Whatman No. 42 ilter paper. An aliquot of the iltrate (100 µg/mLin FMT) was diluted to get required concentrations with the respective solvents.
Placebo blank
A placebo blank of the composition: talc (10 mg), starch (5 mg), acacia (5 mg), methyl cellulose (10 mg), sodium citrate (5 mg), mag-Table 1. Comparison of the performance characteristic of the existing spectrophotometric methods with the proposed methods
Sl. No. Reagent/s used Methodology Linear range, µg/mL and molar absorptivity(L/mol cm)
Remarks Ref.
1. a)Chloranil, b) DDQ and c) DCNP
Charge-transfer complex measured at 458, 460 and 425 nm, respectively.
50-500 Poor sensitivity 14
2. Tetracyanoquinodimethane Green radical anion measured at 840 nm. 1.0-7.0 Uses expensive reagents 15 3. a)p-chloranilic acid in
methanol b) p-chloranilic acid in
acetonitrile
C-T complex measured at 525 nm a) 16000-110000 b) 25-240
Less sensitive, uses acetonitrile which is very expensive
16 17
4. Copper (II) chloride in methanolic medium
Blue color complex measured at 660 nm. 200-1.200 (ε =1.11x10²)
Less sensitive 18
5. Cupric acetate Complex measured at 630 nm. 50-1250 Poor sensitivity 19 6. Palladium (II) Yellow color complex measured at
345 nm in the pH range 2.23-8.50.
17-200 Less sensitive ant requires close pH control
20
7. Ninhydrin in methanolic medium
Blue colored product measured at 590 nm.
5.0-30.0 Requires heating in a boiling water bath and narrow linear range
21
8. Sodium nitroprusside Orange species fomed in alkaline medium measured at 498 nm.
50-500 Poor sensitivity 22
9. NBS with p-aminophenol The decrease in the absorbance of the colored product measured at 552 nm.
6.0-22.0 Two step reaction, longer reaction time and narrow linear range
23
10. F-C reagent Blue color product measured at 650 nm 16-48 Less selective, less sensitive and narrow linear range
24
11. Brominating mixture Yellow color developed measured at 350 40-200 Less sensitive and measured at shorter wavelength
25
12. a) Bromocresol green b) Bromothymol blue
Ion-pair complex measured at 420 nm. 2.0-23 (ε =5.0x10³)
0.7-8.1 (ε =1.2x10⁴)
Require close pH control and extraction
26
13. a) BTB
b) BPB c) BCP d) BCG
In all the methods, resulting yellow col-ored ion-pair complexes were measured
at 410nm.
a) 1.0-12 (ε=2.07 x 10⁵)
b) 1.0-12 (ε =2.28 x 10⁵)
c) 0.75-7.5 (ε=2.91 x 10⁵)
d) 0.75-9.0 (ε=1.66 x 10⁵)
Highly sensitive with wide linear dynamic ranges, no heating or extraction step, no pH-adjustment, single step reaction and inexpensive
instrumental setup.
Present methods
nesium stearate (10 mg) and sodium alginate (5 mg) was made and its solution was prepared as described under ‘Procedure for tablets’. Synthetic mixture
To the placebo blank of the composition described above, 5 mg of FMT was added and homogenized, transferred to 50 mL volumetric lask and the solution was prepared as described under “Procedure for tablets”.
Standard curves construction
Method A and method B
Aliquots of 0.25, 0.5……….3.0 mL FMT standard solution in dioxane (20 µg/mL) were measured accurately and transferred into a series of 5 mL volumetric lasks. To each lask, 1 mL of 0.03% BTB solution in method A or 1 mL of 0.1% BPB in method B, was added, diluted to the mark with dioxane and mixed well. The absorbance of the resulting yellow color chromogen was measured at 410 nm against the respective reagent blank.
Method C and method D
Varying aliquots, 0.25, 0.5…….. 2.5 mL of 15 µg/mLstandard FMT solution in acetone (method C) or 0.25, 0.5…….. 3.0 mL of 15 µg/mLstandard FMT solution in acetone (method D), were measured accurately and transferred into a series of 5 mL volumetric lasks. To each lask was added 1 mL of 0.01 % BCP in method C or 1 mL of 0.01 % BCG in method D. The content was mixed well and diluted to the mark with acetone. The absorbance of each solution was measured at 410 nm against respective reagent blank.
In all the methods, a standard curve was prepared by plotting the increasing absorbance values versus concentrations of FMT. A linear equation for the standard curve was calculated by linear regression. Statistical analysis
The tablet solutions were analyzed for FMT by following the recommended procedures. The same batch tablets were analyzed by the B P method2 which consisted of potentiometric titration of acetous
FMT solution with acetous perchloric acid and the percent recoveries and standard deviation were computed for the results obtained from which the Student’s t-value and F-value were calculated using the formulae:27,28
where x– and –y are the mean recoveries by the two methods, nx and
ny are the number of individual results obtained by the two methods,
Sx andSy are the standard deviations of the two methods; and Sp is
the pooled standard deviation, and , where S x
2 > S y
2
Procedure for stoichiometric ratio
Job’s method of continuous variations of equimolar solutions was employed: 5.927 x 10⁻⁵ M solution each of FMT and BTB
(method A) or BPB (method B) in dioxane; and 4.445 x 10⁻⁴ M
solution each of the FMT and BCP (method C) or BCG (method D) in acetone were prepared separately. A series of solutions was prepared in which the total volume of FMT and reagent was kept at 5 mL. The drug and reagent were mixed in various complementary
proportions (0:5, 1:4, 2:3,………..5:0, inclusive) and completed as directed under the recommended procedures. The absorbance of the resultant ion-pair complex in each case was measured at 410 nm. Method validation
The proposed methods were validated for linearity, sensitivity, precision, accuracy, robustness, ruggedness, speciicity, according to the International Conference on Harmonization (ICH)29 guidelines.
Linearity, limit of detection (LOD) and limit of quantiication (LOQ) Linear correlations were obtained from the standard curves between the absorbance and concentration of FMT. To prepare the standard curves, solutions for each FMT concentration were prepared in triplicate in all the four methods. The standard curve is described by the equation: Y = a + bX, (where Y = absorbance, a = intercept, b = slope and X = concentration in µg/mL) obtained by the method of least squares. The limit of detection (LOD) and limit of quantiication (LOQ) were computed using the formulae: LOD=3.3σ/s and LOQ=10σ/s, where σ is the standard deviation of replicate reagent blank absorbance readings and s is the slope of the standard curve.
Precision
Intra-day precision (repeatability) of the proposed methods was evaluated by carrying out the determination of seven replicates (n=7) of pure drug at 3 different concentration levels on the same day. Inter-day precision (intermediate precision) was determined by assaying the pure drug solution in 7 replicates (n=7) at the same concentration levels on 5 consecutive days. The relative standard deviation for replicate analysis of intra-day precision (repeatability) and inter-day precision (intermediate precision) were calculated.
Accuracy
Intra-day accuracy (on the same day) and inter-day accuracy (on 5 consecutive days) were evaluated in terms of percent relative error (% RE) by assaying the pure drug solution in 7 replicates (n=7) at three different concentration levels. The % RE was calculated by
using the formula: . The accuracy of the
proposed methods was further ascertained by performing recovery studies via standard-addition procedure. Pre-analysed tablet pow-der was spiked with pure FMT at 3 concentration levels (50, 100 and 150% of that in tablet powder) and the total was found by the proposed methods. Each determination was repeated 3 times. The recovery (%) of the pure drug was calculated as [(C1 -C2)/C3] × 100,
where C1 is the total drug concentration found, C2 is the drug
con-centration in the tablet taken and C3 is the pure drug concentration
added to the formulation. Robustness and ruggedness
Method robustness was evaluated by the analysis of tablet and standard solutions at different concentrations of dye (n=3) in ± 0.2 units and by maintaining the solutions at room temperature (25 ± 2 oC). In order to demonstrate the ruggedness of the method,
deter-minations at 3 different concentrations of the pure drug and tablet solutions were carried out by 4 different analysts, and also with 3 different instruments by a single analyst.
Speciicity
con-venient aliquot of the placebo blank solutiotn and synthetic mixture solution was subjected to analysis according to the recommended procedures. For all the methods, the interference from the formulation matrix was evaluated.
RESULTS AND DISCUSSION
Ion-pair extraction-free spectrophotometry has received conside-rable attention in the recent years for the quantitative determination of many pharmaceuticals.30-33 This technique depends on the reaction of a
drug that has basic cationic nitrogen and an anionic dye, where a highly colored ion-pair complex is formed. The structural formula of FMT features amino groups; therefore, attempts were made to determine FMT based on the formation of ion-pair complex with anionic dyes. Absorption spectra
FMT either in dioxane or acetone does not absorb in the visible region, but upon addition of any of four dyes (BTB, BPB, BCP and BCG), yellow color is immediately produced with the absorption maximum at 410 nm (Figure 2). The developed yellow color is due to the conversion of the dye into an open quinoidal anionic deriva-tive,34,35 which subsequently forms an ion pair with FMT as shown
in Scheme 1.
Optimization of reaction conditions
Optimum reaction conditions for quantitative determination of ion-pair complexes were established via various preliminary expe-riments such as choice of organic solvent, concentration of the dye and reaction time.
Choice of organic solvent
Since FMT is insoluble in most of the organic solvents, few solvents such as methanol, acetone and dioxane were tested. FMT is easily soluble in methanol but the dye alone in methanol (blank) gave an intense yellow color. Hence, acetone and dioxane were preferred to carry out the experiments. In the case of BTB and BPB, better sensitivity was achieved in dioxane medium whereas acetone was selected as the suitable solvent for BCP and BCG, yielding maximum absorbance. The blanks yielded least absorption in these solvents. Effect of dye concentration
The inluence of the concentration of BTB, BPB, BCP and BCG on the intensity of the color developed at the selected wavelength was studied. 1 mL each of 0.03% BTB, 0.1% BPB, 0.01% BCP or BCG was suficient to produce maximum and reproducible color with minimum blank absorbance.
Effect of reaction time
The optimum reaction time for the development of color at ambient temperature (25 ± 2 oC) was studied and it was found that
complete color development was instantaneous in all the methods. The formed color was stable for at least 3 h in all cases.
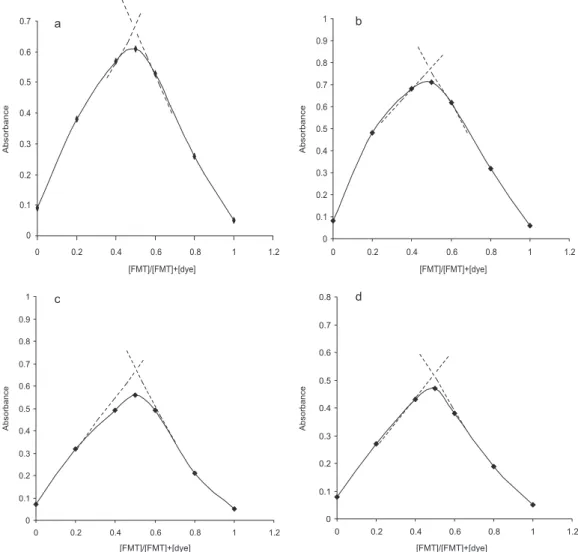
Stoichiometric ratio
The molar ratio of FMT to dyes in the complex was determined by applying the Job’s method of continuous variations. In all the cases, the plot reached a maximum value at a mole fraction of 0.5 which indicated the formation of 1:1 (FMT:Dye) complex (Figure 3). Based on this it was conirmed that only one nitrogen atom in the drug is protonated and through the electrostatic attraction ion-pair complex is formed with the negatively charged dye. In FMT nitrogen atom present in the thiazole ring is the most vulnerable one to protonate Figure 2. Absorption spectra of ion-pair complexes (FMT: BTB; FMT: BPB;
FMT: BCP; FMT: BCG) against respective reagent blank
Figure 3. Job’s Continuous - variations plots (a) FMT + BTB; (b) FMT + BPB; (c) FMT+BCP and (d) FMT+BCG
when compared to other nitrogen atoms. The reaction pathway is proposed to proceed as shown in Scheme 1.
Conditional stability constants (Kf) of the ion-pair complexes
The conditional stability constants (Kf) of the ion-pair complexes
for famotidine were calculated from the continuous variation data using the following equation:36
where A and Am are the observed maximum absorbance and the
ab-sorbance value when all the drug present is associated, respectively. CM is the molar concentration of drug at the maximum absorbance
and n is the stoichiometry with which dye ion associates with drug. The log Kf values for BTB, BPB, BCP and
FMT-BCG ion-pair associates were 7.554 ± 0.225, 7.196 ± 0.241, 8.146 ± 0.219 and 7.164 ± 0.326, respectively.
Experimental results
Under optimum experimental conditions, linear correlations were obtained between the absorbance and concentration of FMT in the range of 1.0-12 µg/mL (method A and method B), 0.75-7.5 µg/mL (method C) and 0.75-9.0 µg/mL (method D). In
all the methods regression coeficient was 0.999 indicating good linearity. The intercept and slope for the calibration data are summarized in Table 2. Sensitivity parameters such as apparent molar absorptivity and Sandell’s sensitivity values, LOD and LOQ are compiled in the same table, speak of the excellent sensitivity of the proposed methods. The LOD and LOQ values are small in method C, indicates that BCP method is most sensitive among the proposed four methods.
Table 3 summarizes the intra-day and inter-day precision ex-pressed as percentage relative standard deviation (RSD, %) and intra-day and inter-day error data (RE %) for the assay of FMT in pure drug by the proposed methods. The intra-day and inter-day RSD values were found to be < 1.5 %, relecting the usefulness of the methods in routine use, and RE % data was ≤ 3%.
Method robustness was determined with small incremental change in dyes concentrations (n=3). The % RSD with the altered dyes concentration was < 1.5 % in both pure drug and tablet so-lutions indicates that the absorbance value remains unaffected by small deliberate variations. Regarding the evaluation of ruggedness of the method, the inter-analysts RSD were < 1.5%, whereas the inter-instrumental variation expressed as RSD were < 2%. These low values of precision demonstrate the robustness and ruggedness of the proposed methods (Table 4).
Table 2. Sensitivity and regression parameters
Parameter Method A Method B Method C Method D
λmax, nm 410 410 410 410
Linear range, µg/mL 1.0-12 1.0-12 0.75-7.5 0.75-9.0
Molar absorptivity(ε), L/mol cm 2.07 x 10⁵ 2.28 x 10⁵ 2.91 x 10⁵ 1.66 x 10⁵
Sandell sensitivitya, µg/cm2 0.016 0.015 0.012 0.022
Limit of detection (LOD), µg/mL 0.11 0.09 0.07 0.12
Limit of quantiication (LOQ), µg/mL 0.32 0.27 0.20 0.36
Regression equation, Yb
Intercept (a) ± CL 0.010 ± 0.053 0.002 ± 0.047 0.003 ± 0.049 0.002 ± 0.025 Slope (b) ± CL 0.059 ± 0.0088 0.067± 0.0035 0.086 ± 0.0067 0.049 ± 0.0038
Standard deviation of a (Sa) 0.039 0.019 0.019 0.010
Standard deviation of b (Sb) 0.004 0.002 0.003 0.002
Regression coeficient (R2) 0.999 0.999 0.999 0.999
a Limit of determination as the weight in µg per mL of solution, which corresponds to an absorbance of A = 0.001 measured in a cuvette of cross-sectional area
1 cm2 and l = 1 cm. b Y=a+bX, Where Y is the absorbance, X is concentration in µg/mL, a is intercept, b is slope. CL is conidence limit at 95%.
Table 3. Evaluation of intra-day and inter-day precision and accuracy of the methods Method FMT taken
µg/mL
Intra-day precision and accuracy (n=7) Inter-day precision and accuracy (n=7)
FMT found µg/mL %RSD %RE FMT found µg/mL %RSD %RE
Method A 4.0 4.07 0.92 1.75 4.06 1.02 1.50
8.0 7.84 1.01 2.00 8.13 0.97 1.63
12.0 11.86 0.98 1.17 11.80 1.05 1.67
Method B 4.0 4.10 1.02 2.50 4.08 1.11 2.00
8.0 8.11 0.96 1.38 8.15 1.20 1.88
12.0 11.76 1.08 2.00 12.23 1.15 1.92
Method C 1.5 1.47 1.12 2.00 1.53 1.15 2.33
4.5 4.40 1.15 2.22 4.59 1.21 2.00
7.5 7.31 1.02 2.53 7.67 1.11 2.26
Method D 3.0 3.09 1.17 3.00 3.05 1.25 1.66
6.0 6.17 1.21 2.83 6.13 1.19 2.17
9.0 9.14 1.14 1.56 9.21 1.27 2.33
RSD. Relative standard deviation; RE. Relative error.
Table 4. Robustness and ruggedness expressed as intermediate precision (%RSD)
Method FMT taken µg/mL Method robustnessa Method ruggedness
RSD, % (n=3) Inter-analyst, RSD, % (n=4) Inter-instruments, RSD, % (n=3)
Method A:BTB (Pure drug) 4.0 1.21 0.83 1.35
8.0 1.34 0.98 1.21
12.0 1.27 0.92 1.27
Tablet (Topcid-20) 4.0 1.42 1.11 1.31
8.0 1.37 1.03 1.35
12.0 1.32 0.98 1.28
Method B:BPB (Pure drug) 4.0 1.41 0.89 1.52
8.0 1.32 0.96 1.47
12.0 1.29 0.83 1.41
Tablet (Topcid-20) 4.0 1.35 0.96 1.31
8.0 1.14 1.14 1.43
12.0 1.31 1.07 1.38
Method C:BCP (Pure drug) 1.5 1.13 0.79 1.52
4.5 1.19 0.85 1.38
7.5 1.24 0.81 1.45
Tablet (Topcid-20) 1.5 1.28 0.97 1.37
4.5 1.32 1.17 1.42
7.5 1.37 1.08 1.29
Method D:BCG (Pure drug) 3.0 1.25 0.87 1.61
6.0 1.17 0.72 1.50
9.0 1.32 0.76 1.46
Tablet (Topcid-20)
3.0 1.25 1.09 1.54
6.0 1.37 1.13 1.36
9.0 1.29 1.25 1.41
Table 5. Recovery of the drug from synthetic mixture Method FMT in synthetic
mixture taken µg/mL
FMT recoverda
(Percent ±SD)
Method A 4.0 97.85 ± 1.16
8.0 97.57 ± 1.25
12.0 97.42 ± 1.11
Method B 4.0 101.0 ± 1.24
8.0 100.3 ± 1.26
12.0 99.78 ± 1.36
Method C 1.5 97.82 ± 1.34
4.5 97.45 ± 1.21
7.5 96.82 ± 1.28
Method D 3.0 98.21 ± 1.19
6.0 97.83 ± 1.25
9.0 97.72 ± 1.21
a Mean value of ive determinations
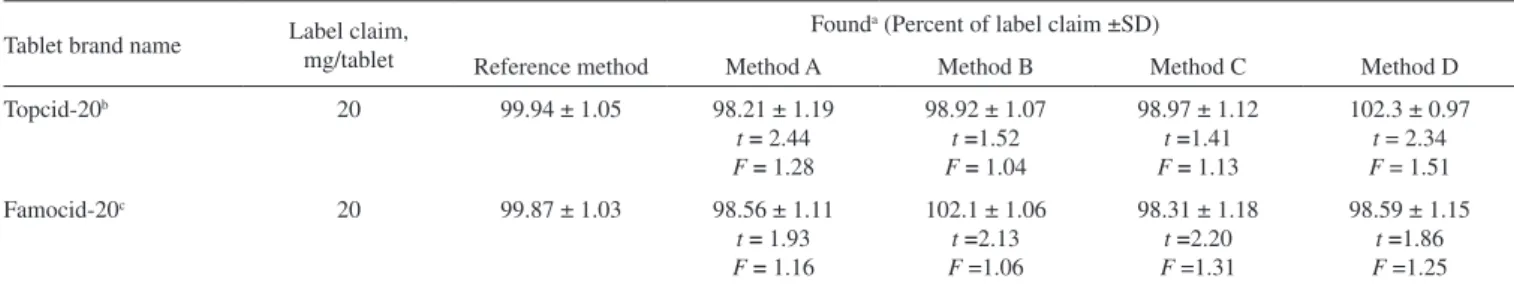
Table 6. Results of analysis of tablets by the proposed method
Tablet brand name Label claim, mg/tablet
Founda (Percent of label claim ±SD)
Reference method Method A Method B Method C Method D
Topcid-20b 20 99.94 ± 1.05 98.21 ± 1.19
t= 2.44 F = 1.28
98.92 ± 1.07 t =1.52 F = 1.04
98.97 ± 1.12 t =1.41 F = 1.13
102.3 ± 0.97 t = 2.34 F = 1.51 Famocid-20c 20 99.87 ± 1.03 98.56 ± 1.11
t = 1.93 F = 1.16
102.1 ± 1.06 t =2.13 F =1.06
98.31 ± 1.18 t =2.20 F =1.31
98.59 ± 1.15 t =1.86 F =1.25
a Mean value of ive determinations. b Torrent Pharmaceuticals Ltd., H. P, India; c Sun Pharmaceuticals Industries, Jammu, India. The value of t (tabulated) at
95% conidence level is 2.78. The value of F (tabulated) at 95% conidence level is 6.39.
Table 7. Accuracy assessment by recovery experiments Method Tablet studied FMT in tablet
µg/mL
Pure FMT added µg/mL
Total found µg/mL
Pure FMT recovereda
Percent ± SD
RSD %
Method A Topcid-20 3.93 2.0 5.96 101.5 ± 1.21 1.19
3.93 4.0 7.92 99.75 ± 1.13 1.13
3.93 6.0 9.87 99.00 ± 1.17 1.18
Method B Topcid-20 3.96 2.0 5.98 101.0 ± 1.05 1.04
3.96 4.0 7.95 99.75 ± 1.08 1.08
3.96 6.0 9.93 99.50 ± 1.02 1.03
Method C Topcid-20 2.97 1.5 4.46 99.33 ± 1.16 1.17
2.97 3.0 5.95 99.33 ± 1.07 1.08
2.97 4.5 7.42 98.89 ± 1.13 1.14
Method D Topcid-20 3.07 1.5 4.52 96.67 ± 1.07 1.11
3.07 3.0 6.08 100.3 ± 0.98 0.98
3.07 4.5 7.64 101.5 ± 1.04 1.08
a Mean value of three measurements.
deviation of 1.11-1.36 in all the cases. The results of this study are presented in Table 5 indicating that the inactive ingredients did not interfere in the assay.
For a statistical comparison of the tablet assay results obtained by the proposed methods with those obtained by reference me-thod,2 Student’s t-test for accuracy and F-test for precision were
applied to the experimental results. The results (Table 6) showed that the Student’s t- and F-values at 95% conidence level did not exceed the tabulated values, which conirmed that there is a good agreement between the results obtained by the proposed methods and the reference method with respect to accuracy and precision.
The accuracy and validity of the proposed methods were fur-ther ascertained by performing recovery studies. In all the cases, the percentage recovery values of pure FMT added was in the range of 96.67-101.5% with standard deviation of 0.98-1.21. The results of this study summarized in Table 7 indicate that neither the accuracy nor the precision of the methods is affected by the co formulated substances.
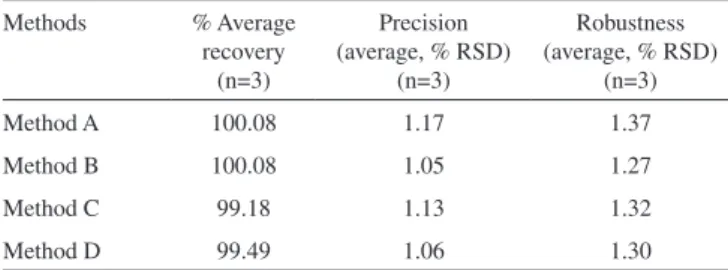
Comparison of the tablet assay results by the four proposed methods The results of the four different methods for the assay of FMT in tablets were compared by calculating average percent recovery, average % RSD for precision and robustness. The results shown in Table 8 indicate that method B is more accurate, precise and robust, hence BPB is found to be the best dye for quantitative analysis of FMT from tablets.
CONCLUSIONS
step reaction and cost-effective. Besides simplicity and selectivity, the proposed spectrophotometric methods are the most sensitive ever reported for FMT (Table 1). The methods are one order of magnitude more sensitive than the reported methods using the same dyes with extraction procedure. The most attractive feature of the method is its relative freedom from interference by the usual tablet diluents and excipients in amounts far in excess of their normal occurrence in pharmaceutical formulations. The high accuracy and precision of the methods may be attributed to the absence of experimental variables which normally would affect the absorbance values. Hence, recommended methods are well suited for the assay and evaluation of drug in pharmaceutical industrial quality control.
ACKNOWLEDGEMENTS
The authors wish to acknowledge, Cipla India Ltd, Mumbai, India, for providing the gift sample of famotidine. One of the authors (OZ) also wishes to thank University Grant Commission (UGC), New Delhi for the award of UGC Meritorious Research Fellowship and also thank the authorities of the University of Mysore for giving permission and facilities to carry out the research work.
REFERENCES
1. Goodman & Gilman; The Pharmacological Basis of Therapeutics, 9th
ed., McGraw Hill: New York, 1996, p. 904.
2. British Pharmacopoeia, The Stationary Ofice London, 1998, p. 572. 3. U.S. Pharmacopoeia 30-NF25, National Formulary 25, Pharmacopoeial
Convention: Rockville, 2008, p. 2137.
4. Sahu, P. N. R.; Bhattacharya, V.; Deepti, J.; Indian J. Pharm. Sci.2006, 68, 503.
5. Biffar, S. E.; Mazzo, D. J.; J. Chromatogr.1986, 363, 243.
6. Mutaz, A.; Sheikh, S.; Hanan, A. N.; Adnan, B. A.; Anal. Lett. 1989, 22, 2501.
7. Campbell, A. N.; Sherma, J.; J. Liq. Chromatogr. Rel. Technol. 2003, 26, 2719.
8. Novakovic, J.; J. Chromatogr. 1999, 846, 193.
9. Ibrahim, D. S. A.; Hussein, A. M.; Mahmoud, A. H. I.; Int. J. Biomed. Sci.2007, 3, 123.
10. Walash, M. I.; Sharaf-El-Din, M. K.; El-Sayed, M. M.; Shabana, M. R.; J. Chin. Chem. Soc. 2005, 52, 927.
11. Ayad, S. M.; Hisham, E. J. M.; J. Pharm. Biomed. Anal. 2002, 29, 247. 12. Juan, A. S.; Carmen, R.; Igor, L.; Nunez-Vergara, L. J.; Michrochim.
Acta 1990, 100, 343.
13. Magda, M.; Ayad, A. S. H. E.; Abdellatef, H. E. M.; J. Pharm. Biomed. Anal. 2002, 29, 247.
14. Kamath, B. V.; Shivram, K.; Saroj, V.; Anal. Lett. 1992, 25, 2239. 15. Sheikha Al-Ghannam, F. B.; J. AOAC Int. 2002, 85, 1003. 16. Chukwurah, B. K.; Ajali, U.; Boll. Chim. Farm. 2001, 140, 354. 17. Mohammad, H. A.; Bull. Pharm. Sci. (Assiut University) 2000, 23, 157. 18. Basavaiah, K.; Prameela, H. C.; Indian Pharmacist2004, 3, 59. 19. Guvener, B.; Ates, S.; Acta Pharm. Turc.1988, 30, 67.
20. Zagorka, K.; Tatijana, J.; Jelena, P.; Dragica, M.; J. Serb. Chem. Soc. 2004, 69, 485.
21. Naisur, R.; Mohammad, K.; II Farmaco2003, 58, 1045.
22. Agarwal, Y. K.; Shivaramchandra-Singh, K.; Rao, G. N.; J. Pharm. Biomed. Anal.1992, 10, 521.
23. Ibrahim, A.; Darwish Samiha, A.; Hussein, A. M.; Mahmoud, A. H. I.; Acta Pharm. 2007, 58, 87.
24. Rao, G. R.; Kanjilal, G.; Mohan, K. R.; Analyst1978, 103, 521. 25. Rami, N. R.; Prabhavathi, K.; Bhaskar, R. Y. V.; Chakravarthy, I. E.;
Indian J. Pharm. Sci.2006, 68, 645.
26. Ali, Z.; Abu, Z. R. M.; Shubietah, G. M. B.; J. Pharm. Biomed. Anal. 1999, 21, 459.
27. Christian, G. D.; Analytical Chemistry, 6th ed., John Wiley & Sons:
Singapore, 2004, p. 92.
28. Lung, K. R.; Gorko, M. A.; Llewelyn, J.; Wiggins, N.; J. Autom. Method Manag.2003, 25, 123.
29. International Conference On Harmonization of Technical Requirements for Registration of Pharmaceuticals for Human Use, ICH Harmonized Tripartite Guideline, Validation of Analytical Procedures: Text and Methodology Q2(R 1), Complementary Guideline on Methodology dated 06 November 1996, incorporated in November 2005, London. 30. Abdine, H.; Belal, F.; Zoman, N.; II Farmaco2002, 57, 267. 31. Al-Ghannam, S. M.; J. Pharm. Biomed. Anal.2006, 40, 151.
32. Shahdousti, P.; Aghamohammadi, M.; Alizadeh, N.; Spectrochim. Acta, Part A2008, 69, 1195.
33. Manjunatha, D. H.; Shaikh, S. M. T.; Harikrishna, K.; Sudhirkumar, R.; Kandagal, P. B.; Seetharamappa, J.; Eclet. Quim. 2008, 33, 37. 34. Ashour, S.; Chehna, M. F.; Bayram. R.; Int. J. Biomed. Sci.2006, 2, 273. 35. Higuchi, T.; Brochmann-Hanssen, E.; Pharmaceutical Analysis,
Inter-science Publication: New York, 1961, p. 413.
36. Amin, A. S.; El-Fetouh Gouda, A. S.; El-Sheikh, R.; Zahran, F.; Spec-trochim. Acta, Part A2007, 67, 1306.
Table 8. Comparison of the tablet assay results obtained from four proposed methods
Methods % Average recovery
(n=3)
Precision (average, % RSD)
(n=3)
Robustness (average, % RSD)
(n=3)
Method A 100.08 1.17 1.37
Method B 100.08 1.05 1.27
Method C 99.18 1.13 1.32