A
rti
g
o
*e-mail: [email protected]
DEVELOPMENT AND VALIDATION OF A RP-HPLC METHOD TO DETERMINE THE XANTHYLETIN CONTENT IN BIODEGRADABLE POLYMERIC NANOPARTICLES
Cristiane de Melo Cazala,*, Moacir Rossi Forimb, Maria Fátima G. Fernandes da Silvab, Paulo Cezar Vieirab and João Batista Fernandesb
aInstituto Federal de Educação, Ciência e Tecnologia Goiano – Campus Iporá, Rod. GO 060, Km 01, 76200-000 Iporá – GO, Brasil bDepartamento de Química, Universidade Federal de São Carlos, Rod. Washington Luiz, km 235, CP 676, 13565-905 São Carlos
– SP, Brasil
Recebido em 26/11/2013; aceito em 09/05/2014; publicado na web em 22/07/2014
Xanthyletin is used as an inhibitor of the symbiotic fungus (Leucoagaricus gongylophorus) of the leaf-cutting ant (Atta sexdens rubropilosa), one of the most significant agricultural plague insects. The incorporation of this compound into nanoparticles is a promising approach to effectively control leaf-cutting ants. This study presents the development and validation of a specific analytical method using high-performance liquid chromatography (HPLC) for quantification of the xanthyletin content in biodegradable polymeric nanoparticles. The analytical methodology developed was specific, linear, accurate, precise, and robust. The absolute recovery of xanthyletin in colloidal suspensions was nearly 100%. The HPLC method proved reliable for the quantification of xanthyletin content in nanoparticle formulations.
Keywords: xanthyletin; HPLC-UV; nanoparticles.
INTRODUCTION
Several biological functions such as anti-tumor and anti-bac-terial activities, as well as inhibition of the symbiotic fungi of the Lepiotaceae family cultivated by leaf-cutting ants,1-3 have been
asso-ciated with xanthyletin of the structure illustrated in Figure 1, which is a coumarin that has been isolated from several Citrus species.4,5
Leaf-cutting ants of the Attasp. and Acromyrmexsp. use mostly fresh plant fragments to raise their symbiotic fungi; thus, they are responsible for important losses in forests, gardens, and field crops, which causes significant leaf defoliation and results in considerable economic damage.6-11 Accordingly, these ants are one of the most
significant agricultural plague insects.12 The control of this insect is
still problematic, presenting only temporary effects, and this insect is sometimes also harmful to the environment and to both humans and animals. Consequently, extensive research for alternative methods to control these insects is currently necessary in an effort to replace traditional agrochemicals by high specificity chemicals that cause less damage to the environment.
Nowadays, concern has increased to not only develop safer pes-ticides but also to reduce the amount of pesticide applied per hectare. The latter concern may be accomplished by changing the formulations of currently used pesticides to prolong their effectiveness; thus, redu-cing the need for high initial doses and/or multiple applications. The incorporation of biopesticides (pesticides from natural products) in carrier systems such as polymeric nano- and micro-particles seems a very promising approach given that it may provide protection against degradation phenomena as well as prevent volatilization. Moreover, the use of carrier systems controls the release rate and prolongs the duration of agrochemicals in the field.13-15 Recently, various studies
involving encapsulated pesticides have demonstrated new promi-sing properties for these compounds. For instance, an amphiphilic carboxymethyl chitosan with ricinoleic acid was synthesized and used as a carrier for the natural pesticide azadirachtin.16 Polymeric
nanoparticles have also been used to control the efficient release of
bifenthrin, for which imidacloprid pesticides were prepared through chitosan natural polysaccharide and sodium alginate.17-19
The nanoparticles of interest in the present discussion are polymeric-organic compound carriers that have a diameter usually ranging from 10 to 1000 nm. Nanoparticles that serve as nanocarriers of encapsulated pesticides can be divided in two different products: nanocapsules (NC), in which the active compound is confined in a cavity surrounded by a polymeric membrane, and nanospheres (NS), in which the substance is dispersed throughout the polymer matrix.20,21
Poly-ε-caprolactone (PCL) is normally used for the preparation
of nanocarriers because it is a biocompatible and biodegradable polymer.22,23
To explore the expected benefits of nanotechnology applied to agricultural systems, a novel and highly specific analytical method using high-performance liquid chromatography (HPLC) has been developed and validated for evaluation of the xanthyletin content in nanoparticles. In this method, a nanocarrier system has been produced using a biodegradable polymer. Moreover, the present study provides a very efficient, safe, and rapid quality control method for formulations loaded with this compound. Furthermore, compelling evidence is provided for the successful use of this method for quantification of the xanthyletin content in nanoparticles that can be further applied in the control of significant agricultural pests.
EXPERIMENTAL
Materials
Xanthyletin was isolated from Citrus sinensis grafted on Citrus limonia aspreviously described.24 Methanol, acetone, and acetonitrile
for HPLC use were purchased from J.T. Baker (Phillipsburg, USA). The polymer poly-ε-caprolactone (PCL), average Mw 65,000, and
sorbitan monostearate (Span®60) were obtained from Sigma Aldrich
(Steinheim, Germany). Polysorbate 80 (Tween®80) and isodecyl
oleate were obtained from the chemistry importer Delaware (Porto Alegre, Brazil). Ultrapure water was produced in house using a Milli-Q System (Millipore Corporation, Watford, UK).
Instrumental and chromatographic conditions
All HPLC runs were performed using an Agilent 1200 Series Liquid Chromatography apparatus (Agilent Technologies, Santa Clara, USA), configured with a G1322A degasser, G1311A qua-ternary pump, G1329A autosampler, G1316A column oven, and G1314B UV detector. The reversed-phase procedure utilized a stain-less steel Phenomenex® Phenil-Hexil column (250 × 4.6 mm i.d., 5
µm particle size, Torrance, CA, USA) fitted with a Phenomenex® C18 (4 × 3 mm i.d., 5 µm particle size, Torrance, CA, USA) security guard cartridge. Control of the HPLC system acquired and processed data collection were performed by Agilent Technologies EZCrom SI software (G6702AA, s.n.08021502300).
Chromatographic analysis was performed by isocratic elution. The mobile phase composition was acetonitrile-water (60:40, v/v) and the flow rate was 1.0 mL min−1. The injected volume was 20 µL
and the detection wavelength was set at 263 nm. This wavelength was selected because it is a UV maximum and provides the necessary sensitivity for quantification of the low xanthyletin concentration in the diluted samples.
Preparation of xanthyletin standard solutions
A stock standard solution of xanthyletin (1000 µg mL−1) was
prepared in acetonitrile. Xanthyletin standard solutions were obtained by dilution of the freshly prepared stock standard solution with ace-tonitrile to obtain eight different concentrations (0.15, 0.30, 0.70, 1.00, 2.00, 4.00, 6.00, and 8.00 µg mL−1). All solutions and dilutions
were prepared in triplicate. These solutions were used to perform the calibration curve, linearity, range, limit of detection (LOD), and limit of quantification (LOQ) of the method. Three other solutions (0.18, 4.50, and 7.50 µg mL−1), which were used to investigate both the
ac-curacy and precision of the method, were prepared in quintuplicate in the same manner as the standard solutions.
Validation of the method
The validation of the analytical method was performed accor-ding to the criteria proposed by the ICH (International Conference on Harmonization of Technical Requirements for Registration of Pharmaceuticals for Human Use).25
Specificity: In the present study, specificity was evaluated by comparing chromatograms obtained from nanoparticle samples with xanthyletin and nanoparticle excipients (i.e., spiked with empty nanoparticles).
Linearity and range: Linearity was evaluated by constructing a calibration curve using peak areas versus nominal concentrations of xanthyletin (0.15, 0.30, 0.70, 1.00, 2.00, 4.00, and 8.00 µg mL−1).
Accuracy: Accuracy was determined by calculating the percent-age recovery of xanthyletin with concentrations of 0.18, 4.50, and 7.50 µg·mL−1. These concentrations corresponded to 120% of the starting
point of the range of linearity, and 56.25% and 93.75% of the end point, respectively. These solutions were prepared in quintuplicate, and the ratio of standard deviation (sd) was determined on three nonconsecutive days (n = 3).26,27
Precision: The solutions used for the accuracy determination were also used to evaluate the precision. Thus, the precision was determined by repeatability (intra-day) and intermediate precision (inter-day)
and reported as relative standard deviation (RSD) for a statistically significant number of replicate measurements.27,28 The solutions
were prepared with a total number of 15 samples for each evaluated concentration level, and five were analyzed per day. Precision was calculated by the RSD between samples of different concentrations.
Limits of quantification (LOQ) and detection (LOD): The LOQ and LOD established for this method were calculated by the relation-ship between the standard deviation (sd) of the calibration curve and its slope (S), using the multipliers suggested by the ICH standard:25
LOQ = 10.0 × (sd /S) and LOD = 3.3 × (sd /S).
Preparation of the polymeric nanoparticles loaded with xanthyletin
Xanthyletin NC were prepared by the modified-solvent displa-cement technique.29-31 Briefly, an organic solution of PCL, isodecyl
oleate, Span®60 (100 mg), and different amounts of dissolved
xanthyletin in acetone (15 mL) were poured into 30 mL of water containing Tween®80 (100 mg) under moderate magnetic stirring
using a peristaltic pump operated at 10% (PumpPro TPM 600 55RPM, Waton-Marlow, Wilmington, UK) at ambient temperature. Following 10 min of moderate stirring, the solvents were removed by evaporation under reduced pressure using a rotary evaporator (R-21, Büchi, Switzerland), and the final volume of the suspension was adjusted to a total volume of 10 mL. Each colloidal suspension was analyzed using optimized chromatographic parameters (n = 3). Xanthyletin NS were prepared according to the same procedure, but by omitting the isodecyl oleate in the organic phase.
Pre-treatment of samples for determination of xanthyletin in nanoparticles
To assay the total amount (absolute recovery) of xanthyletin in colloidal suspension, sample solutions were prepared by dissolving an aliquot of a colloidal dispersion of nanoencapsulated xanthyletin into acetonitrile (dilution of 1:500). Then, the solutions were filtered using a cellulose acetate syringe filter of 0.2 µm pore size (431219, Corning Inc.) into an HPLC vial.
A second pre-treatment method was investigated to assay the incorporation efficiency of xanthyletin into nanoparticles using the filtration-centrifugation technique. This method used cellulose acetate 0.22 µm pore membrane tube filters (Costar®Spin-X®, Corning Inc.). Approximately 0.5 mL of the nanoparticle dispersion was placed in the outer chamber of the filter assembly. The assembly was then centrifuged at 3000 rpm for 30 min using an Eppendorf® 5810R
centrifuge (Hamburg, Germany). The nanoparticles were retained on the membrane, whereas the filtered aqueous solutions were analyzed by HPLC to determine the concentration of free xanthyletin in the aqueous dispersion.
The incorporation efficiency (IE%), according to percentage, can be determined for the difference between the total xanthyletin concentration and the concentration of free xanthyletin in the aqueous dispersion, calculated as follows:
IE% = [(XA – XB) / XA] x 100
where XA is the total amount of xanthyletin in colloidal suspension
(µg mL−1) and X
B is the concentration of free xanthyletin in the
aqueous dispersion media (µg mL−1).
Particle size
PCS measurements, 0.1 mL of each evaluated NP suspension was diluted to 10 mL with ultrapure water. Measurements were perfor-med at room temperature and a fixed angle of 90° to yield the mean particle hydrodynamic diameter. The values of PS were measured on a Zetatrac apparatus (Microtrac Inc., USA), which was controlled using the Microtrac Flex V.10.5.0 software (Microtrac Inc., USA). Statistical analysis
To further confirm the analytical method validation, a single factor analysis of variance (ANOVA) of the linear regression data measurements was performed to evaluate the linearity of the proposed method. Statistical significance was established by a P-value < 0.05, which indicates that the model is explained by the proposed regression at a 95% confidence interval.
RESULTS AND DISCUSSION
Method development and optimization
Before the validation step, the method was developed and opti-mized with respect to several chromatographic parameters such as mobile and stationary phase, peak symmetry, flow rate, maximum absorption, and retention factor. Initial analyses were conducted with mobile phases similar to those described previously.32-34 Accordingly,
mixtures of methanol/water and acetonitrile/water in various pro-portions were tested. Short and reproducible retention times and symmetric peaks were observed using the acetonitrile mixture.
The best mobile phase obtained consisted of 60:40 (v/v) acetoni-trile-water. This organic system applied with a flow of 1.0 mL min−1
exhibited a narrow and very well resolved chromatographic peak for xanthyletin. The chromatographic peak was assumed to have a symme-tric Gaussian shape under these ideal conditions, describing a normal distribution for the velocity of the xanthyletin molecules populating the peak zone migrating through the stationary phase inside the column. In this context, this symmetric peak is the ideal being thus fundamental during peak’s integration as well as to improve the accuracy of the quantification method.
Moreover, the flow rate of 1 mL min−1 provided an optimal
signal--to-noise ratio and a reasonable separation time (as illustrated by Figure 2b). The total time required for analyses was 10 min, and the retention time of xanthyletin was 7.2 min. The selected wavelength for analysis was 263 nm, which is consistent with the maximum absorp-tion of the compound. By utilizing this wavelength, it was possible to analyze very dilute sample solutions. This procedure simplified the cost of analysis and, simultaneously, raised reproducibility by decreasing the number of required steps.
Method validation
The validation of the analytical method for xanthyletin follows a previously developed process that was used to establish and nor-malize the laboratory studies conducted during the development of nanoformulations loaded with xanthyletin, in an effort to ensure good agreement with the results obtained by HPLC within our research group. The method validation was also a very significant aide toward defining a final protocol of quality control. Regarding the validation method, several parameters were utilized to demonstrate the perfor-mance characteristics of the method applied.
Specificity of the method
The specificity of the method was evaluated in relation to the
potential interference of nanoparticle excipients. To this end, the chromatograms of samples comprising nanoparticles loaded with the active compound were compared with samples of the nanoparti-cles prepared without xanthyletin (blank). The blank samples were prepared according to the same experimental procedure, and all sam-ples were conducted by the same pre-treatment steps. The obtained chromatograms of blank samples, such as that shown in Figure 2a, indicate the absence of any peak in the region where the xanthyletin elute (at 7.2 min) should be observed for the working wavelength of 263 nm, as indicated by Figure 2b. As a result, the omission of xanthyletin in the blank samples clearly indicates that the method is specific concerning xanthyletin in nanoparticle excipients.
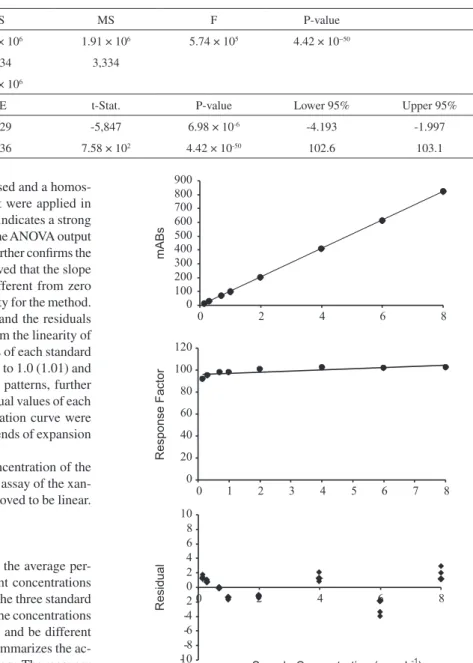
Linearity of the method
The linear dynamic range was assessed by the development and visual evaluation of the calibration curves obtained using external standards in triplicate in a concentration range from 0.15 to 8.0 µg mL−1, as shown in Figure 3a, as well as by calculating the regression
equation (y = bx±a) and the correlation coefficient (r2) by the
me-thod of least squares:
y = 102.8 (±0.1045)x – 3.095 (±0.2367)
The standard deviations of the values of a (slope coefficient) and b (intercept coefficient) are indicated in parentheses. The cor-relation coefficient, which was obtained by regression analysis, was r2= 0.9999, and the data indicates a P-value < 0.05 by ANOVA, as
listed in Table 1. A value for r2 greater than 0.999 indicates a good
Figure 2. Xanthyletin chromatograms indicative of method specificity.
correlation of linearity for all the concentrations used and a homos-cedastic distribution of replicates at all levels that were applied in the calibration curve assembly. The small P-value indicates a strong relationship between the y and x values. Moreover, the ANOVA output of the linear regression model described in Table 1 further confirms the linearity and sensibility of the model. It was observed that the slope of the calibration curve was very significantly different from zero (P-value < 0.05) in accordance with a high sensibility for the method.
The response factor plot shown in Figure 3b and the residuals plot shown in Figure 3c were also utilized to confirm the linearity of the analytical method. Plotting the response factors of each standard solution over the work range revealed a slope close to 1.0 (1.01) and a 3.78% RSD between all levels of concentration patterns, further substantiating the linearity of the method. The residual values of each standard sample that was used to build the calibration curve were scattered randomly about zero, and exhibited no trends of expansion with respect to concentration.
The working range of the method (i.e., the concentration of the analysis aliquot from 0.15 to 8.0 µg mL−1) allowed assay of the
xan-thyletin content within the limits of interest, and proved to be linear. Accuracy and precision of the method
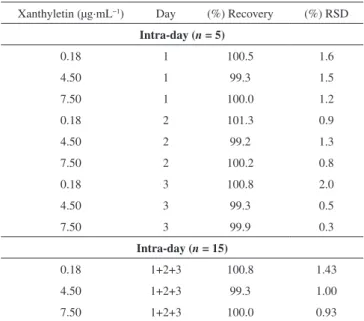
The accuracy may be analyzed by calculating the average per-centage recoveries for the analyte at three different concentrations and the relative standard deviation (RSD).35 Thus, the three standard
solutions chosen were 0.18, 4.5, and 7.5 µg mL−1. The concentrations
chosen should be within the linear working range and be different from those used in the calibration curve. Table 2 summarizes the ac-curacy values, which are expressed as percent recovery. The recovery data were 99.9 ± 1.06%, showing a strong agreement between the experimental and nominal values.
The precision of the method was investigated by assay of the degree of repeatability of the analytical method under normal operational con-ditions of the analyst and of the equipment. Therefore, precision was measured by the analysis of three different standard solutions (0.18, 4.50, and 7.50 µg mL−1) in quintuplicate (n = 5) on three
nonconsecu-tive days (n = 15). The results are described in Table 2 as Recovery (%) and RSD. Similar to the accuracy, the samples used to determine the precision were assessed within the linear working range.
The RSD data for repeatability at each standard solution concen-tration level intra-day (n = 5) ranged from 0.3% to 2.0%, showing an inter-day (n = 15) average result of 1.12%. The results indicate a very high precision for the analytical method. Precision data express the importance that random errors may have on the performance of the method and that it may also be expressed at different levels. The ANOVA output resulted in a calculated F of 1.53, which was lower than the critical value of 5.14, indicating that the results obtained on different days and for different concentration levels were not statistically different.
Limits of Quantification (LOQ) and Detection (LOD)
The LOQ and LOD were calculated according to the standard deviation (sd = 0.955) and the slope (S = 102.9) of the calibration curve. The LOD and LOQ were 0.03 and 0.09 µg mL−1, respectively.
The LOQ was smaller than the first point of the calibration curve (≤ 0.15 µg mL−1), confirming that the method used was linear, accurate,
and precise within the working range.28,36,37
Application of the developed method for the quantitation of xanthyletin in nanoparticles
The validated method was successfully applied in the determination of the absolute recovery and encapsulation efficiency of xanthyletin in various NC and NS, as listed in Table 3. Nanoparticles were prepared
Table 1. Summary of the ANOVA output for the linear regression analysis
ANOVA
d.f. SS MS F P-value
Regression 1 1.91 × 10⁶ 1.91 × 10⁶ 5.74 × 10⁵ 4.42 × 10−50
Residual 22 73.34 3,334
Total 23 1.91 × 10⁶
Coefficients S.E t-Stat. P-value Lower 95% Upper 95%
Intercept (a) -3.095 0.529 -5,847 6.98 × 10⁻⁶ -4.193 -1.997
Slope (b) 102.8 0.136 7.58 × 10² 4.42 × 10-50 102.6 103.1
Figure 3. Linearity of the quantitative method of xanthyletin analysis by
using various amounts of both PCL polymer and isodecyl oleate (thereafter called oil only) that ranged from 1.7 to 15.0 and 0 to 100.0 with respect to the ratios polymer/xanthyletin (w/w) and oil/xanthyletin (w/w), respectively. The amount of substance encapsulated is dependent on several factors such as substance affinity for the polymer, type of polymer and oil, and substance solubility in the oily core.38,39
Independent of the amount of both xanthyletin and polymer that were used in the nanoformulations, the method of sample pre--treatment and analysis proved to be efficient for absolute recovery analysis. During the pre-treatment steps, it was necessary to promote a total solubilization for both polymer and the compound under in-vestigation; however,, at the same time, it was necessary to eliminate the harmful interference of the polymer on the analytical column. To this end, acetonitrile was used during the pre-treatment, and a high dilution of the samples was promoted. The method demonstrated an average-absolute recovery value of 98.6% ± 2.33%, which was considered very efficient and incurred no damage to the equipment and analytical column.
The validated method also demonstrated the capability of analyzing the quantity of free xanthyletin present in an aqueous dispersion medium. The difference between the total quantity of xanthyletin in a colloidal suspension and that in an aqueous
medium determines the encapsulation efficiency, which describes the efficiency of the process of preparation of nanoparticles loaded with xanthyletin. For this analysis, it was necessary to separate the nanoparticles from the dispersion medium; thus, a centrifuge-filtration process was further used. The speed (centrifugal force) and time of rotation were the main optimization parameters of this technique for preventing smaller diameter particles from being transposed. The filtrate (dispersion medium) could be directly analyzed by the HPLC analytical method without the need for further sample preparation steps. As a result, the encapsulation efficiency was determined to range between 74.1% and 98.5%. Using quantitative data analysis, it was possible to determine the optimum formulation for encapsu-lating xanthyletin.
Nanoparticles were prepared as NC or NS with or without the use of oil in the formulations, respectively. Again, the method was demonstrated to be effective for the analysis of xanthyletin in both types of colloidal systems prepared (Table 3).
The mean diameters of the particles of colloidal suspensions are related to the preparation method and the qualitative-quantitative com-position of the polymeric nanoparticles (Table 3). Although nanopar-ticles, even when prepared by various methods, typically have a mean diameter between 100 and 300 nm, nanoparticles with diameters of about 50–70 nm have also been obtained.40-43 In good agreement with
the commonly observed mean, the NC in the present work exhibited mean diameters between 261 and 295 nm. The NS exhibited mean diameters < 201 nm. Note that the method was successfully applied to analyze all formulations independently of the particle sizes that were obtained for different formulations. Different particle sizes can interfere in the solubilization of the analyte and consequently, affect the absolute recovery values of the method. However, this possibility was not observed, indicating a higher encapsulation efficiency. The encapsulation efficiency values for xanthyletin (> 89%) in NC were higher than those corresponding to NS.
The incorporation of natural insecticide, such as xanthyletin, in polymeric carrier systems can provide protection from degradation and prevent volatilization or leaching losses and control release,14
and analytical tools, such as HPLC methods, can be used to confirm these benefits.
CONCLUSIONS
The results from our study demonstrated the development and validation of a new method for quantitation of xanthyletin in PCL nanoparticles by a method using liquid chromatography in accordance with ICH guidelines. The method was shown to be simple, rapid,
Table 3. Absolute recovery (%), encapsulation efficiency (%), quantity of polymers and oil applied in the nanoformulations, and the mean particle size of PCL nanoparticle formulations loaded with xanthyletin
Nominal Concentration
(µg mL−1) Recovery (%)
a Encapsulation
efficiency (%)a Diameter (nm) Ratio P/X
b Ratio O/X b
1000 95.6 91.6 185 5.0 0
1000 96.1 92.3 201 15.0 0
1000 101.8 98.5 295 5.0 100.0
1000 98.6 89.5 294 15.0 100.0
3000 96.7 74.1 178 1.7 0
3000 100.3 79.4 200 5.0 0
3000 101.1 98.3 261 1.7 33.3
3000 98.7 97.8 283 5.0 33.3
aMean determined from the calculated concentrations in µg·mL−1(n = 3); b Ratio of Polymer/Xanthyletin (w/w) in formulations; c Ratio of Oil/Xanthyletin (w/w) in formulations.
Table 2. Data of accuracy (recovery) and precision (RSD) concerning to the validation of the HPLC quantification method for xanthyletin
Xanthyletin (µg·mL−1) Day (%) Recovery (%) RSD
Intra-day (n = 5)
0.18 1 100.5 1.6
4.50 1 99.3 1.5
7.50 1 100.0 1.2
0.18 2 101.3 0.9
4.50 2 99.2 1.3
7.50 2 100.2 0.8
0.18 3 100.8 2.0
4.50 3 99.3 0.5
7.50 3 99.9 0.3
Intra-day (n = 15)
0.18 1+2+3 100.8 1.43
4.50 1+2+3 99.3 1.00
specific, linear, accurate, sensitive, and precise, and it could be rea-dily applied in the determination of xanthyletin associated with these nanocarriers. Moreover, this new analytical method shall be now used in research aimed at the development of new formulations of natural fungicide/insecticidal products involving xanthyletin.
ACKNOWLEDGMENTS
The authors are grateful to Conselho Nacional de Desenvolvimento Científico e Tecnológico (CNPq), Fundação de Amparo à Pesquisa do Estado de São Paulo (FAPESP), Coordenação de Aperfeiçoamento de Pessoal de Ensino Superior (CAPES), Instituto Nacional de Ciências e Tecnologia-Controle Biorracional de Insetos Pragas (INCT-CBIP), and Instituto Federal de Educação, Ciência e Tecnologia Goiano (IF Goiano) for financial support.
REFERENCES
1. Khan, A. J.; Kunesch.; G.; Chuilon,S.; A. Ravise; Fruits1985, 40, 807. 2. Magiatis, P.; Melliou.; E, Skaltsounis.; A, Mitaku.; S, Léonce, S.;
Renard, P.; Pierré, A.; Atassi, G.; J. Nat. Prod. 1998, 61, 198.
3. Godoy, M. F. P.; Victor, S. R.; Bellini, A. M.; Guerreiro, G.; Rocha, W. C.; Bueno, O. C.; Hebling, M. J. A.; Bacci Jr, M.; Silva, M. F. G. F.; Vieira, P. C.; Fernandes, J. B.; Pagnocca, F. C.; J. Braz. Chem. Soc.
2005, 16, 669.
4. Chan, Y-Y.; Li, C-H.; Shen, Y-C.; Wu, T-S.; Chem. Pharm. Bull.2010, 58, 61.
5. Ribeiro, A. B.; Abdelnur, P. V.; Garcia, C. F.; Belini, A.; Severino, V. G. P.; Silva, M. F. G. F.; Fernandes, J. B.; Vieira, P. C.; Carvalho, S. A.; Souza, A. A.; Machado, M. A.; J. Agric. Food Chem.2008, 56, 7815. 6. Boulogne, I.; Germosen-Robineau.; L, Ozier-Lafontaine, H.;
Jacoby-Koaly C.; Aurela, L.; Loranger-Merciris, G.; Pest Manage. Sci.2012, 68, 313.
7. Della-Lucia, T. M. C.; As Formigas Cortadeiras, Folha de Viçosa: Viçosa, 1993.
8. Mikheyev, A. S.; Biol. Invasions2008, 10, 467.
9. Bacci Jr, M.; Solomon, S. E.; Mueller, U. G.; Martins, V. G.; Carvalho, A. O. R.; Vieira, L. G. E.; Silva-Pinhati, A. C. O.; Mol. Phylogenet. Evol.
2009, 51, 427.
10. Berti Filho, E.; Marchini, L. C.; Nakano, O.; Formigas Cortadeiras e Cupins, FEALQ: Piracicaba, 1992.
11. Mariconi, F. A. M.; As Saúvas, Agronômica Ceres: São Paulo, 1970. 12. Erthal Jr, M.; Peres Silva, C.; Ian Samuels, R.; J. Insect Physiol.2004,
50, 881.
13. Cohen, E.; Pestic. Biochem. Physiol. 2006, 85, 21. 14. Ohtsubo, T.; Tsuda, S.; Tsuji, K.; Polymer1991, 32, 2395.
15. Silva, M. S.; Cocenza, D. S.; Melo, N. F. S.; Grillo, R.; Rosa, A. H.; Fraceto, L. F.; Quim. Nova 2010, 33, 1868.
16. Feng, B. H.; Peng, L. F.; Carbohyd. Polym.2012, 88, 576.
17. Liu, Y.; Tong, Z.; Prud’homme, R. K.; Pest Manage. Sci.2008, 64, 808. 18. Guan, H.; Chi, D.; Yu, J.; Li, H.; Crop Prot. 2010, 29, 942.
19. Guan, H.; Chi, D.; Yu, J.; Li, X.; Pestic. Biochem. Physiol.2008, 92, 83. 20. Alonso, M. J. In Microparticulate systems for the delivery of proteins and vaccines, Cohen, S.; Bernstain, H., eds.; Marcel Dekker: New York, 1996.
21. Couvreur, P.; Dubernet, C.; Puisieux, F.; Eur. J. Pharm. Biopharm.1995, 41, 2.
22. Leite, E. A.; Grabe-Guimaraes, A.; Guimaraes, H. N.; Lins Machado-Coelho, G. L.; Barratt, G.; Mosqueira, V. C. F.; Life Sci.2007, 80, 1327. 23. Liu, J.; Xu, L.; Liu, C.; Zhang, D.; Wang, S.; Deng, Z.; Lou, W.; Xu, H.;
Bai, Q.; Ma, J.; Carbohyd. Polym.2012, 90, 16.
24. Cazal, C. M.; Domingues, V. C.; Batalhão, J. R.; Bueno, O. C.; Rodrigues Filho, E.; Silva, M. F. G. F.; Vieira, P. C.; Fernandes, J. B.; J. Chromatogr. A2009, 1216, 4307.
25.http://www.fda.gov/Drugs/GuidanceComplianceRegulatoryInformation/ Guidances/ucm065005.htm, accessed June 2013.
26. Puhl, A. C.; Fagundes, M.; Santos, K. C.; Polikarpov, I.; Silva, M. F. G. F.; Fernandes, J. B.; Vieira, P. C.; Forim, M. R.; Int. J. Drug Delivery
2011, 3, 683.
27. Peters, F. T.; Drummer, O. H.; Musshoff, F.; Forensic Sci. Int. 2007, 165, 216.
28. Neves, J.; Sarmento, B.; Amiji, M. M.; Bahia, M. F.; J. Pharm. Biomed. Anal.2010, 52, 167.
29. Fessi, H.; Devissaguet, J. P.; Puisieux, F.; Thies, C.; French pat. 2, 608, 9881988.
30. Fessi, H.; Puisieux, F.; Devissaguet, J. P.; Eur. pat. 0274961 A1, 1988. 31. Fessi, H.; Puisieux, F.; Devissaguet, J. P.; N. Ammoury.; Benita, S.; Int.
J. Pharm.1989, 55, R1.
32. Park, A. Y.; Park, S-Y.; Lee, J.; Jung, M.; Kim, J.; Kang, S. S.; Youm, J-R.; Han, S. B.; Biomed. Chromatogr.2009, 23, 1034.
33. Bertolucci, S. K. V.; Pereira, A. B. D.; Pinto, J. E. B. P.; Ribeiro, J. A. A.; Oliveira, A. B.; Braga, F. C.; Planta Med.2009, 75, 280.
34. Brenzan, M. A.; Nakamura, C. V.; Filho, B. P. D.; Ueda-Nakamura, T.; Young, M. C. M.; Mitsui, M. L.; Cortez, D. A. G.; J. Liq. Chromatogr. Relat. Technol. 2009, 33, 283.
35. Sarkar, M.; Khandavilli, S.; Panchagnula, R.; J. Chromatogr. B 2006, 830, 349.
36. Taverniers, I.; De Loose, M.; Van Bockstaele, E.; TrAC, Trends Anal. Chem.2004, 23, 535.
37. Sarmento, B.; Ribeiro, A.; Veiga, F.; Ferreira, D.; Biomed. Chromatogr.
2006, 20, 898.
38. Schaffazick, S. R.; Guterres, S. S. U.; Freitas, L. D.; Pohlmann, A. R., Quim. Nova2003, 26, 726.
39. Guterres, S. S.; Fessi, H.; Barratt, G.; Devissaguet, J. P.; Puisieux, F.; Int. J. Pharm.1995, 113, 57.
40. Mello, V. A.; Ricci-Júnior, E.; Quim. Nova2011, 6, 933.
41. Govender, T.; Riley, T.; Ehtezazi, T.; Garnett, M. C.; Stolnik, S.; Illum, L.; Davis, S. S.; Int. J. Pharm.2000, 199, 95.
42. Muller, C. R.; Bassani, V. L.; Pohlmann, A. R.; Michalowski, C. B.; Petrovick P. R.; Guterres S. S.; Drug Dev. Ind. Pharm.2000, 26, 343. 43. Seijo, B.; Fattal, E.; Roblottreupel, L.; Couvreur, P.; Int. J. Pharm.1990,