Other uses, including reproduction and distribution, or selling or
licensing copies, or posting to personal, institutional or third party
websites are prohibited.
In most cases authors are permitted to post their version of the
article (e.g. in Word or Tex form) to their personal website or
institutional repository. Authors requiring further information
regarding Elsevier’s archiving and manuscript policies are
encouraged to visit:
Talanta
j ourna l h o me p a g e :w w w . e l s e v i e r . c o m / l o c a t e / t a l a n t a
A
fast
method
using
a
new
hydrophilic–lipophilic
balanced
sorbent
in
combination
with
ultra-high
performance
liquid
chromatography
for
quantification
of
significant
bioactive
metabolites
in
wines
Catarina
L.
Silva
a,
Jorge
Pereira
a,
Van
G.
Wouter
a,b,
Carme
Giró
a,c,
José
S.
Câmara
a,∗aCQM–CentrodeQuímicadaMadeira,CentrodeCiênciasExactasedaEngenhariadaUniversidadedaMadeira,CampusUniversitáriodaPenteada,9000-390Funchal,Portugal bKatholiekeHogeschoolKempen,Kleinhoefstraat4,2440Geel,Belgium
cInstitutdel’Aigua,UniversitatdeBarcelona,AvingudaDiagonal,684,08034Barcelona,Spain
a
r
t
i
c
l
e
i
n
f
o
Articlehistory: Received8June2011
Receivedinrevisedform2August2011 Accepted6August2011
Available online 1 September 2011
Keywords: Wines
Bioactivemetabolites Solidphaseextraction Ultra-highperformanceliquid chromatography
a
b
s
t
r
a
c
t
Thismanuscriptdescribesthedevelopmentandvalidationofanultra-fast,efficient,andhigh through-putanalyticalmethodbasedonultra-highperformanceliquidchromatography(UHPLC)equippedwitha photodiodearray(PDA)detectionsystem,forthesimultaneousanalysisoffifteenbioactivemetabolites: gallicacid,protocatechuicacid,(−)-catechin,gentisicacid,(−)-epicatechin,syringicacid,p-coumaricacid, ferulicacid,m-coumaricacid,rutin,trans-resveratrol,myricetin,quercetin,cinnamicacidandkaempferol, inwines.A50-mmcolumnpackedwith1.7-mparticlesoperatingatelevatedpressure(UHPLC strat-egy)wasselectedtoattainultra-fastanalysisandhighlyefficientseparations.Inordertoreducethe complexityofwineextractandimprovetherecoveryefficiency,areverse-phasesolid-phaseextraction (SPE)procedureusingassorbentanewmacroporouscopolymermadefromabalancedratiooftwo monomers,thelipophilicdivinylbenzeneandthehydrophilicN-vinylpyrrolidone(OasisTMHLB),was performedpriortoUHPLC–PDAanalysis.Thecalibrationcurvesofbioactivemetabolitesshowedgood linearitywithintheestablishedrange.Limitsofdetection(LOD)andquantification(LOQ)rangedfrom 0.006gmL−1to0.58gmL−1,andfrom0.019gmL−1to1.94gmL−1,forgallicandgentisicacids, respectively.Theaveragerecoveries±SDforthethreelevelsofconcentrationtested(n=9)inredand whitewineswere,respectively,89±3%and90±2%.Therepeatabilityexpressedasrelativestandard deviation(RSD)wasbelow10%forallthemetabolitesassayed.Thevalidatedmethodwasthenapplied toredandwhitewinesfromdifferentgeographicalorigins(Azores,CanaryandMadeiraIslands).The mostabundantcomponentintheanalysedredwineswas(−)-epicatechinfollowedby(−)-catechinand rutin,whereasinwhitewinessyringicandp-coumaricacidswerefoundthemajorphenolicmetabolites. Themethodwascompletelyvalidated,providingasensitiveanalysisforbioactivephenolicmetabolites detectionandshowingsatisfactorydataforalltheparameterstested.Moreover,wasrevealedasan ultra-fastapproachallowingtheseparationofthefifteenbioactivemetabolitesinvestigatedwithhigh resolutionpowerwithin5min.
© 2011 Elsevier B.V. All rights reserved.
1. Introduction
Themoleculespresentinwinescoveralargenumberof metabo-litesincludingprimary (e.g.,sugars,organicacids,amino acids) andsecondarymetabolites(e.g.,polyphenolsincludingflavonoids, anthocyanins, and other pigments). These compounds have a stronginfluence onthequality and character of thewine, and therefore areimportant not only for theircharacterization and differentiation,butalsoforfrauddetection[1–6].Inrecentyears considerableattentionis beingpaid tonatural substances with
∗Correspondingauthor.Tel.:+351291705112;fax:+351291705149. E-mailaddress:[email protected](J.S.Câmara).
antioxidant activity,which playa crucialrole intheprevention of cardiovascular,neurodegenerativeand cancerdiseases acting throughdifferentmechanisms,namelydirecttrappingofreactive oxygenspecies(ROS)andreactivenitrogenspecies(RNS,i.e.nitric oxide),inhibitionofenzymesresponsibleforproducing superox-ideanions,chelationoftransitionmetalsinvolvedinprocessesthat originateradicalsandpreventionoftheperoxidationprocessby reducingalkoxylandperoxylradicals.Grapesandgrape-derived products suchas red wineare an abundant source of antioxi-dants(phenoliccompounds)andrepresentanimportantdietary component[1,2].Theirnatureandcontentcanvarysignificantly accordingtodifferentintrinsicandextrinsicfactorssuchasplant genetics and cultivar,soil composition and growingconditions, maturity stateand post-harvest conditions,among others [5,6].
0039-9140/$–seefrontmatter© 2011 Elsevier B.V. All rights reserved.
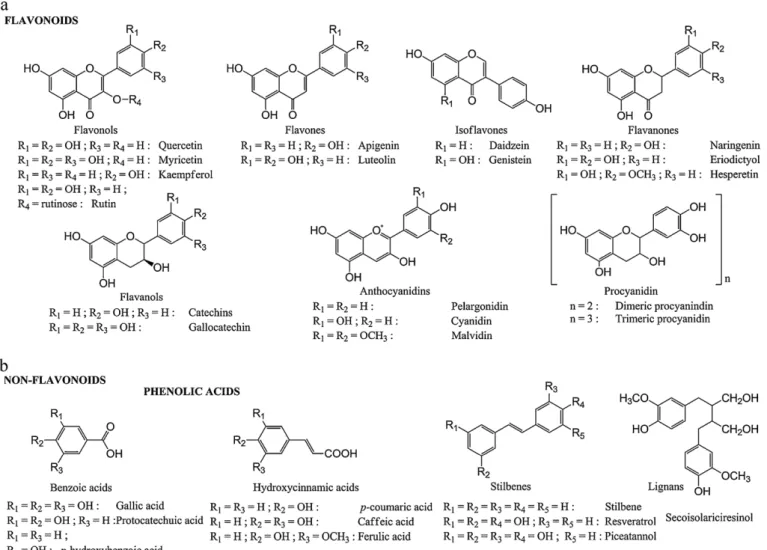
Fig.1.Chemicalstructuresofdifferentclassesofpolyphenols.
Phenoliccompounds,mainlypolyphenols,areresponsibleforsome oftheorganolepticcharacteristicsofthefruits,foodand drinks
[7],and actas potentantioxidants,reinforcing antioxidant sys-temagainst ROS and RNS. In fact, several studies associate to polyphenolsawiderangeofbiologicaleffects,including antibacte-rial,anti-inflammatory,anti-allergicandantithromboticactivities
[8].Moreover,accumulatingdatafromnumerousepidemiological studiesindicatethatregularintakeofpolyphenol-richbeverages andfoodssuchasredwine,tea,chocolate,fruitandvegetables leadtoa reductionof vascular oxidativestressand consequent increase of endothelial function,thus improvingcardiovascular protection[9].Theroleofpolyphenolsinthisprotectionasinvivo antioxidantsisclearlystrengthenedbytheirabilitytobindtoLDL, preventingits oxidation and consequent atherosclerosis devel-opment[9,10].Thesebioactivemolecules canbecategorizedas flavonoidsandnonflavonoidsphenoliccompounds.Thefirstclass includesflavonols,representedmainlybyquercetin,kaempferol, and myricetin; flavones represented by apigenin and luteolin; flavan-3-ols,rangingfromthesimplemonomers(+)-catechinand itsisomer(−)-epicatechintotheoligomericandpolymeric proan-thocyanidins; flavanones, isoflavones, and anthocyanidins. The nonflavonoids includes C6–C1 phenolic acids such as gallic, p -hydroxybenzoic,protocatechuic,vanillic,andsyringicacids;C6–C3 hydroxycinammates:p-coumaric, caffeic, and ferulic acids (fre-quentlyaccumulate as theirrespectivetartrateesters, coutaric, caftaric, and fertaric acids) and their conjugated derivatives;
andstilbenes[3,11].Thechemical structuresofpolyphenols are reportedinFig.1.
Owingtothecomplexnatureofthewinematrix,thereisa con-sensusonthatefficientsamplepreparationtrace-leveldetection andidentificationareimportantaspectsofanalyticalmethodsto determinepolyphenolsinwines.
Thetechniquemostfrequentlyusedforsampleextractionor clean-upisliquid–liquidextraction(LLE).However,insomecases, suchmethodologyisstillnotselectiveenoughtocomplywiththe needsof food safety and regulations. NowadaysSPEis becom-ingmorepopularbecauseitrequirelessorganicsolvent,iseasy to implement, allow high sample throughputs and, in general, isusedwithgoodresults.In thisway,C18 cartridgeshavebeen
widelyusedinpolyphenoliccompoundsextraction,nevertheless theypresentsomedisadvantages,suchaslowrecoveriesforsome polarcompounds,namelyhydroxybenzoicandhydroxycinnamic acids.
AccordingtoPerez-Magarinoetal.[12]theuseofpolymer car-tridge, mainly theHLB with N-vinylpyrrolidone-divinylbenzene copolymerassorbentseemstobeagoodalternativetoreplace C18cartridges.TheseHLBcartridgespresentstrongerretentionand
method (time%B) method
Wines
Flavan-3-ols,phenolic acidsandstilbenes
•Filtration(0.45m)
•10×dilutioninthemobile phases.
SynergiHydroRP(150mm×4.6mm, 4m)
(A)0.1%H3PO4,(B)MeOH;0min10% B,15min22%B,25min50%B,34min 66%B,35min10%B.
HPLC–UV/VIS [19]
(A)0.25%AA+50%ACN,(B)2%AA; 0min70%B,10min70%B,30min0%B, 350%B,40min70%B.
HPLC–MS/MS
•Acidification(pH2.0) •Extraction2×DE(20min) •Organiclayerseparation; evaporation
•Regenerationin50% MeOH
•Filtration(0.45m)
Nova-PakC18column (150mm×3.9mmi.d.,4m)
(A)2%AA+10%MeOH,(B)2%AA+90% MeOH;0min0%B,15min15%B, 25min50%B,34min70%B,46min0% B.
RP-HPLC–DAD [20]
Flavan-3-olsand stilbenes
•Filtration(0.45m) UPLCHSST3column
(150mm×2.1mm,1.8m)
(A)0.1%FA,(B)ACN;0min%B,2.5min 20%B;7min80%B,7.5min80%B; 8min20%B.
UPLC–PDA [21]
Flavonols,flavan-3-ols, anthocyaninsand phenolicacids
•Driedskinsandseeds addedto
CH3OH/H2O/HCOOH (50:48.5:1.5,v/v) •Centrifugation(2500×g, 5◦C,15min)
•Filtration(0.45m)
Ace®5C18column(250mm×4.6mm) (A)NH4H2PO4(50mM,pH2.6),(B)20%
mobilephaseA+80%ACN(C)H3PO4 (200mM,pH1.5);0min100%A,2min 100%A,5min92%A8%B,17min0%A 14%B,22min0%A18%B,29.5min0% A21%B,55min0%A33%B,70min0% A50%B,75min0%A50%B,78min20% A80%B,81min20%A80%B,86min 100%
HPLC–DAD-FD [22]
Redwines
Flavan-3-ols,flavonols, flavanoldimmers, phenolicacidsand organicacids
•Freeze-dryingandliquid extraction
•Extractfractionationby semipreparative C18-RP-HPLC.
BEHC18column(100mm×2.1mmi.d., 1.7m)
(A)5%FA,(B)ACN;0min10%B,12min 30%B;12.5min50%,13.5min100%B; 13.6min10%B.
UPLC–MS [15]
Flavan-3-ols,flavonols phenolicacidsand stilbenes
•Filtration(0.45m)
•Dilution1:10(10% MeOH+10mMammonium formatebufferpH3.75).
HTC-18reversedphase (50mm×2.1mm,1.8m)
(A)0.1%FA+1%ACN,(B)0.1%FA+99% ACN;0min2%B,1.5min2%B, 11.25min45%B,12.75min70%B, 12.82min2%B.
LC–MS/MS [23]
Flavan-3-ols,flavonols andphenolicacids
•Filtration(0.45m) OmniSpherC18column
(250mm×4.6mm);ChromSepguard column(100mm×3mm)
(A)0.1%H3PO4,(B)MeOH;0min55% B,30min80%B,33min80%B,35min 5%B. HPLC–PDA [24] Flavanols, anthocyaninsand phenolicacids •Dealcoholizationand acidification(concentrated FApH2.0)
•Fractionationinto aqueousandorganic fractionsusingLLEandSPE
XTerraTMMSC18reversephase column(150mm×2.1mm,3.5m); XTerraTMMSC18guardcolumn (10mm×2.1mm,3.5m)
Aqueous(anthocyanin)fraction: (A)2%FA+2%ACN,(B)2%FA+80% ACN;0min5%B,11min15%B,26min 30%B,46min60%B,69min80%B, 94min5%B,124min55B.
HPLC–DAD-MS [17]
Organic(non-anthocyanin)fraction: (A)0.1%FA+2%ACN,(B)0.1%FA+80% ACN;0min5%B,30min25%B,35min 30%B,40min55%B,45min55%B, 50min80%B,85min5%B,90min5%B. Flavonolsandflavones •Filtration(0.45m) LiChrospher100RP-18ecolumn
(250mm×4.0mmi.d.,5m);RP-18
(10mm×4.0mm)guardcolumn
(A)19%ACN+5%MeOH+1%THF(pH 3.0),(B)55%ACN+15%MeOH(pH3.0); 0min2%B,15min2%B,28min28%B, 40min36%B,44min36%B,45min 80%B,52min80%B.
HPLC–UV/VIS [16]
Flavan-3-ols,flavonols, flavones,phenolic acidsandothers phenolics
•Filtration(0.45m)
•Dilutionto90%with Milli-Qwater.
KinetexC18column (100mm×4.6mmi.d.,2.6m)
(A)0.1%FA,(B)ACN;0min5%B,4min 5%B,10min23%B,15min23%B, 19min50%B,20min95%B.
HPLC–DAD [25]
Whitewines Glutathione,catechin
andcaffeicacid
•Centrifugation (14,000rpm,5min) •Derivatizationwith p-benzoquinone.
BEHC18column(100mm×1.7mm, 1.7m)
(A)0.05%TFA,(B)MeOH;0min10%B; 5min17%B;7.5min30%B;8.5min 35%B;8.8min100%B;9.3min10%B; 11min10%B.
UPLC–PDA [26]
Phenolicacids •Infusion(dryleaves incubationindistilled water10min,80◦C) •Filtration(3500rpm, 5min,0.22m)
BEHC8reversedphasecolumn (150mm×2.1mm,1.7m)
(A)7.5mMFA,(B)ACN;0min5%B,5% B0.8min,1.2min10%B,1.9min10%B, 2.4min15%B,3.7min15%B,4min21% B,5.2min21%B,5.7min27%B,8min 50%B,9min100%B,9.5min5%B.
UPLC–MS/MS [27]
Otherwines(Brandies,fruitwinesandmodelwinesolutions) Phenolicacids,
aldehydesandfuran compounds
•Filtration(0.22m) LiChrospherRP-C18column
(250mm×4mmi.d.,5m)
(A)2%AA+5%MeOH,(B)2%AA+90% MeOH;0min0%B,20min10%B, 60min75%B.
Table1(Continued)
Analytes Samplepreparation method
Stationaryphase Mobilephases;gradientconditions (time%B)
Detection method
Ref.
UPLCBEHC18column (100mm×2.1mmi.d.,1.7m)
(A)2%AA+3%ACN,(B)2%AA+85 ACN;0min0%B,3min10%B,4min 10%B,6.5min75%B,9.5min100%B, 12.5min0%B.
UPLC–PDA
Anthocyaninsand hydroxycinnamic acids
•Referencesolutions preparedinawine-like medium(tartaricacidin 12%EtOHacidifiedtopH 3.5)
BEHC18column(50mm×2.1mmi.d., 1.7m)
(A)acidifiedwater(pH2.6),(B)ACN; 0min3%B,2min10%B,6.8min24%B, 10.8min40%B,11min3%B,15min3% B.
UPLC/ESI-TOF MS
[13]
Abbreviations:PDA,photodiodearraydetection;DAD,diodearraydetection;DAD–ESI-MS,diodearraydetectionandelectrosprayionizationmassspectrometry; DAD–FD-ED,diodearray,fluorescenceandelectrochemicaldetectors;FD,fluorescencedetector;LLE,liquid–liquidextraction;SPE,solid-phaseextraction;SS-LLE,solid-supported liquid–liquidextraction;AA,aceticacid;ACN,acetonitrile;DE,diethylether;EA,ethylether;EtOH,ethanol;FA,formicacid;MeOH,methanol.
Liquidchromatographic(LC)methodologiesrepresent,todate, themostwidelyusedapproachtophenolicanalysis.Several meth-odsforthedetectionandquantificationofphenoliccompoundsin winesandothermatrices,usingthisapproach,havealreadybeen developed(Table1).However,insomeofthereportedanalytical methodsthepolyphenolsseparationrequire40,50oreven60min ofrunanalysistimepersample[14–18].
Asanalternative,anultra-fastUHPLCmethodappearsrecently toovercomesomeoftheLCdrawbacksretaining theprinciples ofLCwhileofferingsomeclearbenefitsintermsofanalysistime, resolvingpower,solventconsumptionand,toalesserextent, sen-sitivity[25,13].Uptonow,onlyafewapplicationsusingUHPLC havebeenreportedfortheanalysisofpolyphenols(Table1).Spacil etal.[14]comparedaconventionalHPLCsystemandaUHPLC sys-tem,equippedwithcolumnscontainingsimilarstationaryphases, intheanalysisofwineandteasamples.Whilebothanalytical meth-odsgavegoodresults,theUHPLCsystemappearedtobesuperior. UHPLCmethodsarenotonlyfaster,moresensitiveandmore effi-cient,butarealsomorereliableandecological[14,29].
Hence, the current research study is dedicated towardsthe developmentand validation of an ultra-fast, efficient and high throughputUHPLC–PDAmethodusinga50-mmcolumn(Acquity BEHRP18)packedwith1.7-mparticles,fortheseparationand
quantificationofawiderangeofbioactivepolyphenolsinwines. Inordertoreducethecomplexityofwineextractandimprovethe recoveryefficiency,areverse-phaseSPEprocedureusingassorbent anewcopolymermadefromabalancedratiooftwomonomers,the lipophilicdivinylbenzeneandthehydrophilicN-vinylpyrrolidone, wasperformedpriortoUHPLC–PDAanalysis.Thismethodpresents manyadvantagesthatincludehighresolution,speed,an exception-allysmallsamplevolumeandshortrunningtimefortheseparation. Itwasappliedinredandwhitewinesfromdifferentregionsto characterizethephenolicswithanefficientseparation. Neverthe-less,themethodcanbeappliedinseveralotherapplicationssuch asplantextractsanddietarysupplements.
2. Materialsandmethods
2.1. Chemicalsandstandards
For the UHPLC–PDA experiments, HPLC-gradient grade methanol (99.9% purity) was obtained from Sigma–Aldrich (St. Louis, MO, USA). Ethanol and formic acid, both of HPLC-gradientgrade,wereprovidedbyPanreacQuimicaSA(Barcelona, Spain) and ethyl acetate from Lab-Scan (Dublin, Ireland). The eluentswerepreviously filteredwith0.22mmembrane filters
(Millipore,Milford,MA, USA).The SPEcartridges used,OasisTM
HLBsorbent(30mg) fromWaters was provided byVia Athena (Lisbon,Portugal).Finally,ultra-purewaterwaspreparedfroma
Milli-Qwaterpurificationsystem(Millipore,Bedford,MA,USA), Polyphenolsstandards gallicacid, gentisicacid, (−)-epicatechin, m-coumaric acid, cinnamic acid,p-coumaric acid, rutin, ferrulic acid and kaempferol, were supplied by Fluka Biochemica AG (Buchs,Switzerland), protocatechuicacid, (−)-catechin, syringic acidandtrans-resveratrol,bySigma–Aldrich(St.Louis,MO,USA), myricetinwasacquiredfromAcrosOrganics(Geel,Belgium)and quercetinfromRiedel-de-Haën(Seelze,Germany). Thepurity of allpolyphenolicstandardswasgreaterthan95%.
Individual stocksolutions of all bioactivemetabolitestested werepreparedinpuremethanolatconcentrationsof1000mgL−1,
aliquotedin 4mLvials,andstored at−20◦C.Workingstandard solutionsatvariousconcentrationswereprepareddailyfromthe individualstocksolutionsinthemobilephaseusedatinitialstepof gradientelution(waterat0.1%formicacidwitha20%ofmethanol solution).Thesestandardswereusedtospikethewinesinorder toperformtheassaysformethodvalidation.Thechemical struc-tures of the investigated bioactive metabolites are reported in
Fig.1.Calibrationstandardswerepreparedfreshonthedayofthe analysisbydilutingtheappropriateworkingsolutionswithinitial mobilephasesolution.Therangesofconcentrationswereselected infunctionofsensitivityoftheUHPLC–PDAtowardseachbioactive metabolite.Physical–chemicalcharacteristicsaffecttheanalytical signalandforsomecompoundshigherconcentrationshadtobe usedinordertodetectedthecompound.
2.2. Samples
Themethodologywasappliedtoninerepresentative commer-cialtablewinesavailablefromdifferentregions,Madeira(TT,PT,LB, EB,SB,RBB),Azores(TLT)andCanaryIslands(VT,VGB)whichwere producedaccordingtostandardproceduresanddefinedvarietal composition.
2.3. Bioactivemetabolitesextractionprocedure
Thepolyphenolsextractionprocedurewasbasedon reverse-phaseSPEusing OasisTM HLB extractioncartridges. Briefly, 1cc
(30mg)OasisTMHLBextractioncartridgeswereconditionedwith
1mLofethylacetateandmethanolandequilibratedwith1mLof water.Analiquotofsample(900L),previouslyacidifiedtopH
2.7withaceticacid30%,waspassedthroughtheSPEcartridges at around 1.5mLmin−1 using an extractionunit (Alltech, SGE).
Thecartridgeswerewashedwithasolutionofmethanol5%and subsequentlythepolyphenolswereelutedwith500Lmethanol,
1000L ethylacetateandfinally500Lmethanol.Theextracts
wereevaporated todrynessusinga nitrogenstream.The dried residuewasredissolvedin1000Lofinitialmobilephase(water
times.
2.4. UHPLC–PDAanalysisandoperatingconditions
The analysisof bioactive metabolites werecarried out on a WatersUltraPerformance LiquidChromatographicAcquity sys-tem(UPLC,AcquityH-Class)(Milford,MA,USA) combinedwith aWatersAcquityquaternarysolventmanager(QSM),anAcquity samplemanager(SM),acolumnheater,a2996PDAdetector,anda degassingsystem.ThewholeconfigurationwasdrivenbyEmpower softwarev2.0fromWatersCorporation.Optimumseparationwas achievedwithabinarymobilephasewhichconsistedof(A)water at0.1%formicacid,and(B)methanol,witha constantflowrate of 250Lmin−1,giving a maximum backpressure of 6.000psi,
whichiswithinthecapabilitiesoftheUHPLC.2Lofextractswere
injectedintotheWatersAcquityUPLCsystem,equippedwithan AcquityUPLCTMbridgedethylenehybridBEHC
18analytical
col-umn(1.7mparticlesize,2.1mm×500mm)andprotectedwith anAcquity UPLCTM BEH C
18 Van GuardTM Pre-column(1.7m,
2.1mm×5mm)(Waters,Milford,MA,USA);columntemperature wasthermostatedat40◦Candthesampleswerekeptat4◦Cinthe samplemanager.The5mingradientwasasfollows:0min,80%A, 0.25min,70%A,0.5min,68%A,4min,20%A,and5min,80%A, followedbyare-equilibrationtimeof3min,forbringingthe col-umntotheinitialconditionsaftergradientanalysis,givenatotal runtimeof8min.Allsolventsandsampleswerefilteredthrough 0.22mmembranefiltersfromMillipore(Millipore,Milford,MA,
USA),beforeuse. Forquantificationpurposes thePDAdetection wasconductedbyusingfourdistinctchannelsthatweresettothe maximumabsorbancewavelengthofeach polyphenol,210,270, 307,and360nm,asindicatedinTable3.Theywereidentifiedby comparingtheretentiontimeandspectralcharacteristicsoftheir peakswiththoseofstandardsandtheywerequantifiedusingthe standardsofeachone.
Low Medium High
(LL) (ML) (HL)
Gallicacid 0.5 5.0 10.0
Protocatechuicacid 2.0 12.0 30.0
(−)-Catechin 2.0 15.0 45.0
Gentisicacid 4.0 16.0 40.0
(−)-Epicatechin 5.0 20.0 60.0
Syringicacid 1.5 5.0 16.0
p-Coumaricacid 2.0 20.0 80.0
Ferulicacid 1.0 3.0 8.0
m-Coumaricacid 2.0 10.0 30.0
Rutin 3.0 15.0 32.0
Trans-resveratrol 2.0 15.0 60.0
Myricetin 3.5 20.0 60.0
Quercetin 2.0 10.0 30.0
Cinnamicacid 3.0 10.0 30.0
Kaempferol 2.0 15.0 40.0
2.5. Methodvalidation
Retentiontimeswerepreviouslydeterminedusingindividual standards.Themethodwasvalidatedintermsofselectivity, lin-earity,limitsofdetection(LOD) andquantification(LOQ), inter-andintra-dayprecisions,accuracyandextractionefficiency.The accuracyandprecisionstudieswerecarriedoutbyspikingred(PT) andwhite(LB)winesatthreedifferentconcentrationlevels, cor-respondingtothelowlevel(LL),mediumlevel(ML)andhighest point(HL)ofcalibrationcurve(Table2).
Theselectivityofthemethodwasassessedbytheabsenceof interferingpeaksattheelutiontimesofthebioactivemetabolites. Thelinearityoftheanalyticalmethodwasevaluatedbuildingthree calibrationcurves(theareasobtainedwereplottedagainstthe cor-respondingstandardconcentrations)foreachbioactivemetabolite usingstandards,preparedinwaterat0.1%formicacidwitha20% ofmethanolsolutionfromindividualstocksolutions,at7 differ-entconcentrationslevels,includingthezeropoint,runatdifferent
Table3
Validationprocessdatashowingtheconcentrationrangeinsidewhichthelinearitywastested,retentiontimes(RT),andresultsofregressionfortotalareaversusconcentration andanalyticalperformanceforthebioactivemetabolites(polyphenols)determinedbySPEOasis®HLB/UPLC-PDA.
Peaknumber RT(min) Bioactivemetabolites maxb(nm) Analyticalperformancea
Conc.range(gmL−1) yc Rd LOD
(gmL−1)e
LOQ (gmL−1)e
1 0.664 Gallicacid 270 0.01–10.00 8.98E+07x–7.82E+03f 0.995 0.006 0.019
2 1.032 Protocatechuicacid 270 0.10–30.00 1.85E+07x–1.53E+04 0.985 0.008 0.026
3 1.234 (−)-Catechin 210 2.50–45.00 7.67E+07x+2.09E+03 0.983 0.089 0.297
4 1.595 Gentisicacid 307 2.00–40.00 2.06E+06x+1.58E+03 0.996 0.581 1.938
5 2.044 (−)-Epicatechin 270 1.00–60.00 9.52E+05x+7.03E+02 0.994 0.180 0.599
6 2.210 Syringicacid 270 0.25–16.00 5.90E+06x+4.18E+03 0.989 0.008 0.026
7 2.615 p-Coumaricacid 307 0.05–80.00 6.07E+06x+1.19E+03 0.997 0.011 0.035
8 2.791 Ferulicacid 307 0.25–8.00 122E+07x+4.46E+03 0.989 0.014 0.047
9 2.946 m-Coumaricacid 315 0.25–30.00 1.65E+07x+1.42E+03 0.994 0.076 0.255
10 3.029 Rutin 360 1.00–32.00 1.02E+07x+3.18E+03 0.998 0.011 0.038
11 3.187 Trans-resveratrol 307 0.80–60.00 3.52E+06x–5.57E+03 0.989 0.032 0.108
12 3.393 Myricetin 360 2.50–60.00 3.64E+06x–1.40E+04 0.995 0.038 0.128
13 3.891 Quercetin 360 1.00–30.00 6.14E+06x–1.31E+04 0.982 0.010 0.032
14 4.108 Cinnamicacid 270 0.05–30.00 2.27E+07x+2.70E+03 0.999 0.013 0.044
15 4.388 Kaempferol 360 0.40–40.00 1.09E+06x+5.56E+03 0.987 0.059 0.198
aRT:retentiontime(min).
b max:maximumabsorbancewavelength. c y:representsthepeakareaofbioactivephenolics. d R:correlationcoefficient.
eLOD:limitofdetection,thelowestanalyteconcentrationthatproducesaresponsedetectableabovethenoiselevelofthesystem–(a+3Sa)/b,andLOQ,quantification limit,thelowestlevelofanalytethatcanbeaccuratelyandpreciselymeasured–(a+10Sa)/b.
days.Thezeropoint(extractionsolvent)enablestoverifythatnone ofthecompoundsshowedresiduallevelorbackgroundsignal.Each levelofconcentrationwaspreparedintriplicateandinjectedthree times,sotherewereatotalofninereplicates.
MethodsensitivitywasassessedbydeterminingtheLOD(the lowestanalyteconcentrationthatproducesaresponsedetectable abovethenoiselevelofthesystem)andLOQ(thelowestlevelof analytethatcanbeaccuratelyand preciselymeasured)foreach compound.LODandLOQwerecalculatedwiththedatagenerated inthelinearitystudies,beingLODdefinedas(a+3Sa)/bandLOQ as(a+10Sa)/b,where“a”representsoriginordinate,“Sa”theorigin ordinatevarianceand“b”theslope.Theseparameterswere calcu-latedforeachanalytefromthestandardsolutionsusedtoobtain thecorrespondingcalibrationcurves,usingtheUHPLCdeveloped method.For methodprecision,PTredwineandLBwhitewine, spiked at three different concentration levels (LL, ML and HL, seeTable2)ofeachpolyphenolandtreatedbySPEOasisHLBwere
measuredin seven replicates(n=7)in the same dayto obtain repeatability(intra-dayprecision),andthreetimesoverfour differ-entdaystoobtaininter-dayprecision(intermediateprecision– IP). Bothprecisionmeasureswereexpressedas%RSDwhichdescribes theclosenessofagreementbetweenseriesofmeasurements.
In order to check the accuracy of the proposed method a recoverystudywascarried outby spikinga redwine(PT) and a white wine (LB), at three concentration levels (Table 2) in triplicate.The mixtures were subjected to the SPEOasisHLB
pro-ceduredescribedinSection2.3.ThePTandLBwinesphenolics concentration was previously determined, and the recovery valueswerecalculatedaccordingtothefollowingformula: Accu-racy=100×([analyte]afterspiking–[analyte]beforespiking)/[analyte
added];where[analyte]afterspikingistheanalyteconcentrationin
spikedwine;[analyte]beforespiking istheanalyteconcentrationin unspikedwine,and[analyteadded]isthenominalconcentration of the analyte added to wine. Extraction efficiency (EE) was determined by replicate analysis (n=3) of bioactive phenolics standardsolutions at medium level of concentration (ML) and processedasdescribedabove(ASS-SPE);asecondsolutionwiththe
sameconcentrationwasanalysedbutnotsubmittedtoSPEOasisHLB
(ASS).Theobtainedpeakarearatioswerecompared,andextraction
efficiencywasthuscalculated:%EE=(ASS-SPE/ASS)×100.
3. Resultsanddiscussion
Thereisavarietyofpolyphenolcompoundspresentinwines whichhasbeendemonstratedthatpossessratherpotent antioxi-dantpropertiesandasignificantdegreeofbioavailability,resulting in beneficial health effects. For this reason it is important to developefficientanalyticalmethodsabletoassessthesebioactive metabolites.Inthis work,theUHPLCmethoddevelopedforthe quantificationofbioactivephenolicsinwinesextractswasfound tobecapableofgivingafasteranalysiswithgoodresolutionthan thatachievedwithconventionalHPLC.
3.1. Methoddevelopmentandvalidation
Themostabundantbioactivemetabolitesoftenreportedtobe presentinwinecomposition,suchasgallicacid,(−)-catechinand (−)-epicatechin,aswellothers,likequercetin,thatarenotso abun-dant,buthaveahighbioactivepotentialagainstseveraldiseases
[30],werechosen tobeanalysedin this work.Thewavelength thatcorrespondtothemaximumabsorbanceintheUVregionwas determinedforeachoneofthepolyphenolsanalysed(Table3).
Themethodwasvalidatedbydeterminingtheselectivity,the linearity,thelimitsofdetection(LOD)andquantification(LOQ),the inter-andintra-dayprecisions(expressedas%RSD),theextraction
efficiencyandtheaccuracyatdifferentlevelsoffortification.The spikinglevelsusedfortheaccuracyandprecisionstudiesare sum-marizedinTable2.
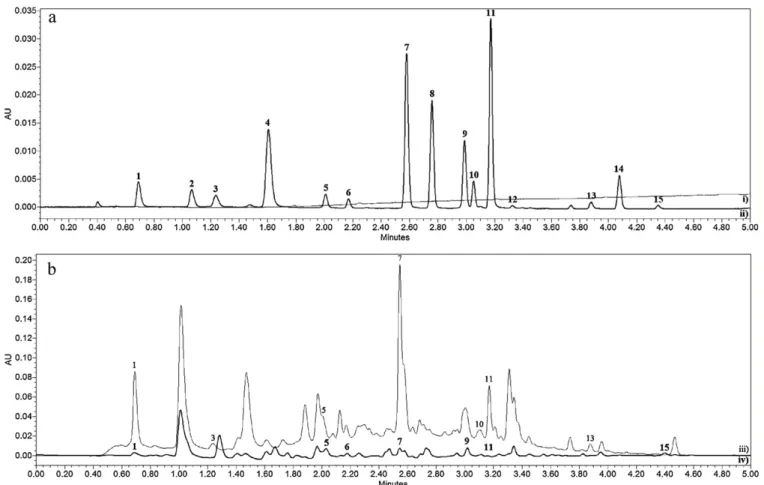
Selectivitywasassessedbytheabsenceofinterferenceinthe same chromatographic windows as examined in a solution of standardsofbioactivephenolicsandanalysisof“blankmatrices” (extraction solvent). Nointerfering peakswere observedin the blankchromatograms(Fig.2a)atthequantificationwavelengths (210,270,307,315and360nm).
Methodlinearitywasevaluatedforeachoneofthe15bioactive metabolitesusingstandardsolutionsinordertodemonstratethat concentrationislinearlydependentondetectorresponse, while otherparametersinfluencingmethodprecisionandaccuracywere determined usingspikedrealwines treatedbeforeor afterSPE procedure.Todeterminethelinearityofthemethod,calibration plotsof theanalytepeak areaversusnominalstandard concen-trationsusing replicates(n=3)at sevenlevelsof concentration (Table3)wereconstructed.Theseconcentrationlevelscoveredthe concentrationrangesexpectedforthebioactivemetabolitesfound inwines.Table3summarizesthevalidationprocessdatashowing theconcentrationrangeinsidewhichthelinearitywastestedfor eachanalyte,theslope,theoriginordinate,thecorrelation coeffi-cients,andthelimitsofdetectionandquantificationforthetarget metabolites.
Asitcanbeseenthroughcorrelationcoefficients,the linear-itywassatisfactorywhenusingSPEOasisHLBmethod,withR-values
above 0.991 for allbioactive metabolites (Table 3). The lowest value ofR was obtainedfor both quercetinand protocatechuic acid(R>0.991)andthehighestvalueforcinnamicacid(R=0.999). Theslopeoftheregressionmodeldependsontheextraction effi-ciencyand onthedetectorresponsefor each compound.Gallic acid,cinnamic acid,andprotocatechuicacids,showedthe high-estslopevalueswithSPEOasisHLB/UPLC–PDAmethodology,while
(−)-epicatechinobtainedthelowest(Table3).
Thelimitsofdetectionwereestimatedasthepolyphenol con-centration which gave a signal equal to a+3Sa/b(described in Section2.5)[31].AsitcanbeseeninTable3,theSPEOasisHLB
/ULPC-PDAmethodologypresentedingeneralverylowdetectionlimits, rangingbetween0.006and0.58gmL−1,forgallicacidand
gen-tisicacid,respectively.Thelimitsofquantification,estimatedasthe polyphenolconcentrationwhichgaveasignalequaltoa+10Sa/b
[31],rangedfrom0.019gmL−1to1.94gmL−1,againforgallic
andgentisic acids,respectively.ComparingLODandLOQvalues obtainedwiththosereportedinliteratureforthephenolic com-pounds(Table1)thevaluesprovidedbythismethodaregenerally lowerthantheonesfromthecitedliterature.Theverylowvalues forLODandLOQconfirmedthehighsensitivityoftheproposed method for determination of bioactive phenolic metabolitesin wines.
Theprecisionofthemethod(Table4)wasevaluatedbasedonits repeatability,whichwasascertainedbyperformingseven succes-sivesampleextractionsfromspikedredandwhitewinesatthree differentconcentrationlevelsonthesamedayplusthree extrac-tionsperdayfor4days(IP).Theintra-dayrepeatabilityofpeak areas,expressedbymeansofthepercentageofrelativestandard deviation(%RSD,n=7),waslowerthan7%forredwinesand5% forwhitewines,withanaverageprecisionof3±3%,and3±1%, forredandwhitewines,respectively.TheIP(inter-day repeatabil-ity,4days;n=3),waslessthan10%,inbothwinetypes.Forred winesthelowestIPvaluewasobtainedformyricetin(1.4%)spiked at3.5gmL−1,andthehighestwasobtainedforgallicacidspikedat
0.5gmL−1(10%).ForwhitewinestheIPvaluesrangingfrom1.1%
(myricetin,3.5gmL−1)and8.9%forkaempferol(40.0gmL−1).
Intra-day(n=7) Inter-day(n=12)
Redwine Whitewine Redwine Whitewine
LL ML HL LL ML HL LL ML HL LL ML HL
Bioactivemetabolites Gallicacid 2.55 1.57 0.89 5.32 1.41 2.41 10.30 4.50 9.31 3.06 6.88 3.94 Protocatechuicacid 7.30 3.33 1.55 2.51 1.26 3.43 9.66 4.93 3.66 3.16 4.58 1.37 (−)-Catechin 2.85 1.42 0.34 2.42 1.77 2.82 2.02 3.90 4.10 2.00 1.23 4.36 Gentisicacid 4.75 2.30 3.82 1.57 1.61 1.30 9.13 6.93 2.18 1.94 4.02 4.55 (−)-Epicatechin 8.11 1.36 6.51 4.64 2.54 2.17 9.44 6.19 4.45 6.52 8.83 3.83 Syringicacid 3.44 2.89 3.01 5.21 2.44 1.48 7.10 2.36 1.76 3.89 6.39 2.21 p-Coumaricacid 1.62 3.10 2.55 3.20 1.65 4.14 1.54 8.66 8.16 2.86 6.15 2.26 Ferulicacid 5.02 1.52 1.70 4.17 1.27 6.24 2.21 5.02 5.74 3.68 5.39 8.51 m-Coumaricacid 2.51 1.53 2.91 2.80 1.24 1.89 2.69 6.18 1.13 7.25 5.80 4.06 Rutin 1.38 1.61 2.50 1.69 1.74 4.95 2.53 5.81 6.01 7.87 7.02 4.40 Trans-resveratrol 3.21 1.43 1.97 1.29 0.82 3.15 2.55 6.56 1.80 2.97 5.25 3.56 Myricetin 7.80 3.60 2.93 1.29 1.78 0.76 1.37 3.17 2.20 7.06 4.82 3.04 Quercetin 4.58 1.86 1.14 3.09 5.29 2.59 4.56 9.14 2.89 2.53 4.02 6.02 Cinnamicacid 5.55 2.77 2.43 1.13 1.58 5.54 512 5.68 4.36 4.92 5.65 5.92 Kaempferol 3.72 1.67 0.31 2.07 3.19 3.35 4.97 7.56 9.07 6.69 7.99 8.86
amountsofpolyphenolsatthreeconcentrationlevels,LL,MLand HL(Table2).Eachphenolicmetabolitepeakareaversusthe cor-respondingconcentrationwastheninterpolatedfromthelinear regression equation. In general,good recoveries were obtained forthemajorityofpolyphenoliccompounds,exceptforrutin(red wines)and(−)-epicatechin(whitewines)thatshowedthe low-estrecoveries59±39% and 72±3%, respectively,which can be attributedtotheirlowpolarstructures.Nevertheless,themethod accuracywasadequateforalltargetphenolicspresentinstudied wines.Forredwinestherecoveriesrangedfrom57%(rutin,HL –32gmL−1)to114%(quercetin,ML–10gmL−1),whereasin
whitewinestherecoveriesvariedbetween71%(gallicacid,LL– 0.5gmL−1)and12%(cinnamicacid,LL–3gmL−1)withan
aver-agerecovery±SD(n=9)of89±3%and90±1%,forredandwhite wines,respectively.Theextractionefficiencywascarriedoutatone concentrationlevel,ML(Table2)analysedintriplicate.Theresults areshowninTable5.Asonecansee,theresultsaresatisfactory, beingtheextractionefficiencieshigherthan77%(rutin),withan average±SD(n=3)of89±7%.
Takingtogether,theresultsobtainedshowthat,besidesbeing simple,fastandstraightforward,thesampleextractionusingthis SPEmethodwithOasisTM HLBcartridgespresentsagood
repro-ducibilityandaccuracy[12].
3.2. Determinationofbioactivemetabolitesby SPEOasisHLB/UHPLC–PDA
OneofthemainadvantagesofUHPLCtechnologyisrelatedto thepossibilityofattainingeitherultra-fastorhighresolvingpower separations.Inordertodemonstratetheapplicabilityofthe devel-opedmethod,theSPEprocedurewasfirstappliedtoamixtureof polyphenolsstandards(Fig.2a)andthentoredandwhitewine samples(Fig.2b).AsshowninFig.2a,theseparationofthestandard mixtureof15polyphenolscompoundsisveryfast,beingachieved within5min.
Thechromatogramsforwhiteandredwines(Fig.2b)showed quitedifferentprofilesandtheircomplexityincreasesordecreases accordingtothewavelength(datanotshown).Thepolyphenolic contentinthewinesamplesanalysedisrepresentedinTable6.As canbeeasilyobserved,thepolyphenolscontentisaboutsixtimes moreabundantinredwinesthaninwhitewines.Thiswaswidely describedbeforeintheliterature[23].
RedwinefromAzores(TLT)wasbyfartheonethatshowed higher polyphenoliccontent consideringthe sumofthe fifteen polyphenols tested (almost 240gmL−1),followed by Madeira
and Canary Islands red wines, withpolyphenolic compositions around175(TT)and150gmL−1(VT),respectively(seeTable5).In
Table5
ValidationparametersbasedonrecoveriesandextractionefficiencystudiesforSPEOasis®HLB/UPLC-PDAofbioactivemetabolitesinspikedredandwhitewines.
Recovery(%) Extractionefficiency(%)
Redwine Whitewine
LLa MLa HLa LLa MLa HLa MLb
Bioactivemetabolites Gallicacid 80±7 85±5 84±8 71±4 67±5 80±7 87±9
Protocatechuicacid 84±9 103±8 80±6 84±8 94±6 79±6 92±8
(−)-Catechin 89±11 85±7 85±8 113±9 93±10 89±5 84±6
Gentisicacid 81±13 88±11 82±9 76±9 86±7 92±10 85±3
(−)-Epicatechin 95±10 87±9 80±6 70±4 72±5 75±4 80±5
Syringicacid 84±9 106±4 92±8 97±5 95±5 91±7 91±7
p-Coumaricacid 77±8 90±8 83±8 103±9 94±3 97±6 85±6
Ferulicacid 95±10 98±6 82±9 107±3 98±4 96±9 90±3
m-Coumaricacid 80±4 95±9 89±4 103±4 104±3 82±3 96±6
Rutin 59±7 63±5 57±4 74±4 76±8 79±6 77±5
Trans-resveratrol 105±7 101±7 100±5 86.±7 99±6 97±6 93±5
Myricetin 85±8 90±4 111±5 99±5 92±3 89±1 90±7
Quercetin 104±9 114±6 102±6 89±5 84±2 78±4 94±6
Cinnamicacid 98±7 96±6 108±8 116±3 97±8 101±5 96±3
Kaempferol 82±7 81±5 76±8 89±4 99±8 102±3 87±3
an=3;average ±RSD%. b n=6;average
Fig.2.(a)Chromatogramof(i)extractantsolvent,inordertotestthemethodselectivity;and(ii)astandardmixtureofpolyphenols;(b)UHPLC–PDAchromatogramof(iii) aredwine;and(iv)awhitewine;usingabsorbancedetectionat307nm.IndividualretentiontimesandpeakidentificationofthepolyphenolsarepresentedinTable1.
previousworkswherewinepolyphenolscompositionfromAzores IslandswascomparedwithwinesfromotherregionsofPortugal, thissameresultwasobserved[26].Inwhitewines,the polyphe-noliccontentissignificantlylower,varyingfrom14gmL−1inthe
RBB,MadeiraIslandwine,upto45gmL−1intheCanaryIsland
VGBwine.Thisfactmakeswhitewineslesspronetobeeffectivein healthprotectionagainstoxidativedamageastheprotectiveeffects
associatedtomoderatewineconsumptionhavebeenattributed totheircontentinpolyphenols[10,27].Infact,Fuhrmanand col-laborators haveshown thatit waspossibletohave whitewine withantioxidantcharacteristicssimilartothoseofredwinejustby increasingitspolyphenolscontent,whatcouldbeeasilyobtained byincreasingtheextractionofgrapeskinpolyphenolsduringthe macerationprocess[28].
Table6
ConcentrationaofbioactivemetabolitesfoundinredandwhitewinesassayedthroughproposedSPEOasis HLB/UHPLC–PDAmethod.
Redwine Whitewine
Sampleidentification VT TLT TT PT LB EB SB RBB VGB
Sampleorigin CANb AZOb MADb MAD MAD MAD MAD MAD CAN
Bioactivemetabolites Gallicacid 2.1±1 2.6±7 4.0±5 2.4±6 0.2±10 0.3±16 0.4±10 0.2±10 0.2±3
Protocatechuicacid 10±0.2 6.9±2.3 4.3±3
(−)-Catechin 7.8±11 51.1±6 30.4±18 377±8 1.2±16 1.9±4 0.9±4
Gentisicacid
(−)-Epicatechin 95.8±2 147.2±3 123.8±7 19.9±2 15.9±2 14.9±2 12.7±3 9.8±5 36.9±0.3
Syringicacid 8.9±0.5 7.9±6 0.8±1 0.7±3 0.8±5 0.3±3 1.7±1
p-Coumaricacid 9.4±0.9 7.1±4 2.9±3 2.2±2 1.8±4. 2.8±2 2.1±1
Ferulicacid
m-Coumaricacid 0.2±4 0.1±3
Rutin 19.4±0.4 8.4±10 11.6±1
Trans-resveratrol 6.5±6 5.1±9 2.4±8
Myricetin 9.7±2
Quercetin 5.4±6 2.1±9 2.2±4
Cinnamicacid 0.8±2
Kaempferol 2.7±9 1.1±0
aThecontentofeachofthefifteenpolyphenolsanalysedinthewinesamplestestedisthemeanofthreereplicates
±RSDandindicatedasgmL−1.Thegray-shadow
boxesrefertopolyphenolsthatwerenotdetectedintherespectivewinesample.
abundantpolyphenolis (−)-catechin, althoughit isnot present inEBandVGBwhitewines.Thesetwo polyphenolshave being extensivelyshowntohaveseveralhealthbenefits,namelyinthe cardiovascular and neurodegenerative protection [32,33]. Gallic acid,alsooftenreportedinwinecomposition[34,35],was identi-fiedinallwinesamples,whilesyringicandp-coumaricacidseems tobemorespecifictowhitewines.Inthesameway,m-coumaric acidwas only identified in white wines, while rutin was only detectedinredwines.Myricetin(inVTredwine)andkaempferol (inVGBwhitewineandVTredwine)weredetectedonlyinCanary Islandwines.Gentisicandferulicacidswerenotdetectedinany ofthewinesamplesanalysedandcinnamicacidwasonly iden-tified at very low amounts in the AzoresIsland red wineTLT. Trans-resveratrol,animportant bioactivepolyphenols shown to haveanti-mutagenandanti-fungalproperties[13],usuallypresent inredwineswasidentifiedinAzores(TLT–6.50±0.06gmL−1)
andMadeira(PT– 5.12±0.09gmL−1)redwines,butnotinthe
CanaryIslandredwine(VT).Curiouslyitwasidentifiedinoneofthe whitewinestested(VGBwinefromCanaryIsland).Ourdataabout trans-resveratrolareinagreementwiththeresultsfromBaptista etal.[26,35]thatfoundamountsofthiscompoundintherange of0.63–5.21mgL−1inotherPortugueseredwines,includingone
fromAzoresIsland.
Theseresultsconfirmedthatwinepolyphenoliccompositionis veryheterogenic,beingdependentofdiversefactors,namelylocal climateandvinificationconditionsthatarequitedifferentamong thewinesamplesusedinthiswork.
4. Conclusions
In the current study an ultra-fast and simple UHPLC–PDA methodology,usinga50-mmcolumn(AcquityBEHC18)packed with1.7-mparticles,wasdevelopedandvalidatedforthe
simul-taneousseparationandquantificationof15bioactivepolyphenols inredandwhitewines.Themethodwasvalidatedwithrespectto selectivity,linearity,LOD,LOQ,accuracy,precisionandextraction efficiencyforeachofthefifteencompoundsstudied.Thevalidation hasshownthat themethodislinear,and sensitivewith recov-ery,andprecisionvalueswithintheacceptedlimitsforvalidation offoodanalyticalmethods.Afteracarefulselectionoftheeluent systems,itwasdemonstratedthatthechromatographic separa-tionofthepolyphenolscouldbeachievedinwithinfiveminutes withhigh resolution. This is about tentimes faster separation thanthattraditionalHPLCapproachallowsforthesamepurpose. Thecombinationoftheshorterrunningtimewithasmallerflow ratealsoreduceddrasticallythesolventconsumptionandthusis moreenvironmentalfriendlyandeconomical.Inordertoreduce thecomplexityofwineextractsamplesandoptimizethe recov-eryefficiency,arapidprocedurebasedonSPEusingmethanoland ethyl acetateas extractionsolvents was employedprior to the UHPLC–PDAanalysis.Itspracticalapplicationinselectedwineshas alsobeendemonstrated.
Themethodologyherepresentedissuitableandveryusefulfor anunambiguousdeterminationofbioactivemetabolitesinwines andforroutineuseinlaboratory.Moreover,thevalidatedapproach
Acknowledgements
TheauthorsthankthefinancialsupportofFEDER(Transnational Cooperation MAC 2007-2013 Program) through VinSaudeMAC project (MAC/1/M105) and to Portuguese Foundation for Sci-enceandTechnology(FCT)throughtheMSPortugueseNetworks (REDE/1508/RNEM/2005) and Pluriannual base funding (QUI-Madeira-674).
References
[1]J.S.Câmara,M.A.Alves,J.C.Marques,Anal.Chim.Acta555(2006)191. [2]R. Lopez, M. Aznar, J. Cacho, V. Ferreira, J. Chromatogr. A 966 (2002)
166.
[3]V.Ferreira,R.López,J.Cacho,J.Sci.FoodAgric.80(2000)1659.
[4] J.S.Câmara,P.Herbert,J.C.Marques,M.A.Alves,Anal.Chim.Acta513(2004) 203.
[5]V.Ferreira,N.Ortin,A.Escudero,R.Lopez,J.Cacho,J.Agric.FoodChem.50 (2002)4048.
[6] J.S.Câmara,M.A.Alves,J.C.Marques,Talanta68(2006)1512.
[7]M.Prodanov,I.Garrido,V.Vacas,R.Lebron-Aguilar,M.Duenas,C. Gomez-Cordoves,B.Bartolome,Anal.Chim.Acta609(2008)241.
[8]N. Gheldof, X.H. Wang, N.J. Engeseth, J. Agric. Food Chem. 50 (2002) 5870.
[9]V.B. Schini-Kerth,C. Auger,J.H.Kim, N.Etienne-Selloum,T.Chataigneau, PflugersArch459(2010)853.
[10]M.I.Covas,P.Gambert,M.Fito,R.delaTorre,Atherosclerosis208(2010)297. [11] M.Naczk,F.Shahidi,J.Chromatogr.A1054(2004)95.
[12]S.Perez-Magarino,M.Ortega-Heras,E.Cano-Mozo,J.Agric.FoodChem.56 (2008)11560.
[13]M.Schwarz,M.C.Rodriguez,D.A.Guillen,C.G.Barroso,J.Sep.Sci.32(2009) 1782.
[14]Z.Spacil,L.Novakova,P.Solich,Talanta76(2008)189. [15]L.A.Kartsova,A.V.Alekseeva,J.Anal.Chem.63(2008)1024.
[16]E.Rijke,P.Out,W.M.A.Niessen,F.Ariese,C.Gooijer,U.A.Th.Brinkman,J. Chro-matogr.A1112(2006)31.
[17] H.Wang,G.J.Provan,K.Helliwell,FoodChem.81(2003)307.
[18]M.Pelillo,M.Bonoli,B.Biguzzi,A.Bendini,T.GallinaToschi,G.Lercker,Food Chem.87(2004)465.
[19] V.Atanasova,H.Fulcrand,V.Cheynier,M.Moutounet,Anal.Chim.Acta458 (2002)15–27.
[20]J.X.Castillo-Sánchez,M.S.García-Falcón,J.Garrido,E.Martínez-Carballo,L.R. Martins-Dias,X.C.Mejuto,FoodChem.106(2008)18–26.
[21] Z.Kerem,B.A.Bravdo,O.Shoseyov,Y.Tugendhaft,J.Chromatogr.A1052(2004) 211.
[22]V.Pereira,J.S.Camara,J.Cacho,J.C.Marques,J.Sep.Sci.33(2010)1204. [23]J.Gruz,O.Novák,M.Strnad,FoodChem.111(2008)789.
[24] M.A. Rodríguez-Delgado,G. González-Hernández,J.E. Conde-González, J.P. Pérez-Trujillo,FoodChem.78(2002)523–532.
[25]D.Guillarme,C.Casetta,C.Bicchi,Jean-LucVeuthey,J.Chromatogr.A1217 (2010)6882.
[26]J.A.B.Baptista, J.F.d.P. Tavaresa,R.C.B. Carvalho,Food Res. Int.34 (2001) 345.
[27]Y.Kuroda,Y.Hara,Mutat.Res.436(1999)69.
[28]B.Fuhrman,N.Volkova,A.Suraski,M.Aviram,J.Agric.FoodChem.49(2001) 3164.
[29]L.Nováková,SpacilZdenek,M.Seifrtova,L.Opletal,P.Solich,Talanta80(2010) 1970.
[30]A.A.Bertelli,D.K.Das,J.Cardiovasc.Pharmacol.54(2009)468.
[31]J.N.Miller,J.C.Milller,StatisticsandChemometricsforAnalyticalChemistry, PearsonEducation,Harlow,UK,2000.
[32]H.J.Heo,C.Y.Lee,J.Agric.FoodChem.53(2005)1445.
[33]H.Schroeter,C.Heiss,J.Balzer,P.Kleinbongard,C.L.Keen,N.K.Hollenberg, H.Sies,C.Kwik-Uribe,H.H.Schmitz,M.Kelm,Proc.Natl.Acad.Sci.U.S.A.103 (2006)1024.
[34]J.González-Rodríguez,P.Pérez-Juan,M.D.LuquedeCastro,Talanta56(2002) 53.