Article
Printed in Brazil - ©2017 Sociedade Brasileira de Química0103 - 5053 $6.00+0.00*e-mail: xu@fzu.edu.cn
Development of a Novel Spectrophotometric Method Based on
Diazotization-Coupling Reaction for Determination of Bisphenol A
Zhiqun Xu, Qiao Wu,Yunjian Duan, Meixia Yang, Minrui Ou and Xiaoping Xu*
Key Laboratory of Biopharmaceutical, College of Chemistry, Fuzhou University, 350116 Fuzhou, P. R. China
Bisphenol A (BPA) is an industrial material which can lead to endocrine disorders. In this work, a simple and sensitive spectrophotometric method for determination of BPA using diazotization-coupling reaction was presented. To achieve the best performance of the developed method, the experimental parameters were optimized in terms of reagent concentration, reaction time, pH, and temperature. Under the optimal conditions, the absorbance increased linearly with the increasing concentration of BPA in the range of 0.16-10.4 µg mL-1 with the correlation coefficient of 0.9991
and the detection limit of 0.05 µg mL-1. Results achieved with the spectrophotometric method were
compared with those obtained using high performance liquid chromatography (HPLC) method. The proposed method was successfully applied to determine BPA in milk and water bottle samples and satisfactory results were obtained, which make it very suitable for routine analysis of BPA in quality control laboratories.
Keywords: bisphenol A, sulfamethoxazole, diazo-coupling reaction, food analysis
Introduction
Bisphenol A (BPA, 4,4-(propane-2,2-diyl)diphenol), one of important synthetic materials, is heavily used in plastic industry in the production of polymers mainly including polycarbonate (PC) plastics, epoxy resins and polysulfone
resin.1-4 As the most widely used industrial compounds in
the world, it can also be used in the production of plasticizer, flame retardant, antioxidant, heat stabilizer, rubber protective
agent, pesticide, paint and other fine chemical products.5-7
Nowadays, the global amount of BPA and its products that are released into the environment annually is about 2000 tons. It is even more serious as BPA can migrate into food or food simulants from the resin or polymeric materials,
especially upon heating or at high temperature.8 BPA is an
environmental pollutant owing to its poor biodegradability.9
Low-dose exposure to BPA produces an increasing risk suffering from diabetes mellitus, at the same time with a variety of adverse effects on metabolic organs such as
pancreas, adipose tissue and liver.10-13 Thus there is an urgent
need to monitor the presence of BPA correlated to BPA-based food contact materials.
Up to now, various methods have been developed to
detect BPA using traditional analytical methods14 such
as: liquid chromatography (LC),15,16 gas chromatography
coupled with mass spectrometry (GC-MS)17,18 and
enzyme-linked immunosorbent assay.19 Although these methods
present low detection limits and good selectivity for routine analysis, they require large capital investment, skilled operators, cumbersome sample preparation and
pretreatment.20,21 Recently, different types of analytical
methods have also been studied, including fluorescent
method,11,22 surface-enhanced Raman scattering,23
colorimetric methods,24 and electrochemical sensors.25,26
However, most of them suffer from complex chemical synthesis, the use of volatile organic solvents, high cost and so on. Therefore, these techniques are unsuitable for online or field monitoring.
In the recent years, spectrophotometric method has attracted more and more attention due to its simple operation, rapid response time, low cost, high sensitivity, potential for miniaturization, and capability of real sample
analysis.27-29 A number of spectrophotometric methods
have been used for various ions and drugs detection. For
example, Cao et al.30 reported a simplified method based on
ratio derivative ultraviolet spectrometry for simultaneous determination of BPA. The method provides a direct analysis of the samples without tedious sample preparation.
The limits of detection was up to 3.5 × 10⁻⁷ mol L-1 for BPA.
because of the long time required for calculation prior to
detection. Poorahong et al.31 developed a simple and high
extraction efficiency online in-tube microextractor (ITME) assay for BPA detection in water samples. The ITME was fabricated by a stepwise electrodeposition of polyaniline, polyethylene glycol and polydimethylsiloxane composite (CPANI) inside a silico-steel tube. Under optimum conditions, the system provided a linear dynamic range of
0.1 to 100 µM with a limit of detection of 20 nM (S/N ≥ 3).
The aim of this study was to develop an accurate selective and sensitive analytical method for the quantification of BPA in human food samples. In this paper, a new spectrophotometric method for rapid and sensitive determination of BPA was investigated. The diazo compound of sulfamethoxazole (SMZ) can react with BPA based on the diazotization-coupling reaction. The experimental parameters in terms of reagent concentration, reaction time, pH, and temperature, etc. were optimized and a good linear relationship between the concentration of BPA and the intensity of the increased absorbance was obtained. We also introduced the fabrication of test strips for the sensitively determination of BPA in order to facilitate the adoption of our methodology by end users. Finally, the applicability of the proposed spectrophotometric method was compared with the high performance liquid chromatography (HPLC) method by analyzing the content of BPA in milk and water bottle samples and the results were satisfactory.
Experimental
Chemicals and reagents
All reagents and solvents were purchased from commercial suppliers and used without further purification unless otherwise stated. Deionized water was used throughout all experiments. Sulfamethoxazole, BPA were purchased from Sigma (St. Louis, USA). The sodium nitrite, hydrochloric acid, methanol, crystal violet lactone
(CVL), K4Fe(CN)6.3H2O, ZnSO4.7H2O and sodium
hydroxide used were purchased from Aladdin (Shanghai, China). The solution of metal ions were prepared from their nitrate salts or chloride salts of analytical grade. Stock solutions and mobile phases were prepared in ultrapure water and filtered through 0.45 µm nylon membranes.
Measurements
UV-Vis absorption spectra were recorded on a U-4100 spectrophotometer. HPLC was performed with an Agilent 1100 chromatograph (Agilent Technologies, Santa Clara,
CA, USA) equipped with a UV detector operated at 278 nm. All pH measurements were made with a Model PHS-3C meter.
Sample preparation
1 mL sulfamethoxazole of known concentration was
added to a mixture of solutions containing 6.4 × 10⁻² mol L-1
HCl and 28.0 µg mL-1 NaNO
2. Then the solution was shaken
thoroughly for 3 min to allow the diazotization reaction to go to completion and contained in 0 °C for 10 min because it is very exothermic. In the following, the mixture was transferred into another 10 mL volumetric flask, which
contained 9.2 µg mL-1 of BPA. The mixture was shaken
thoroughly for 5 min, then a certain amount of NaOH
(9.4 mg mL-1) was added into the volumetric flask and then
filled to the mark with distilled water. After mixing well, the absorbance was measured in 1.00 cm quartz cells at 445 nm, using distilled water as a reference. The absorbance of the reagent blank must be deducted from the sample. For the parameter optimization experiments, certain amounts of BPA were added to microcentrifuge tubes with different
concentrations of HCl, sulfamethoxazole, NaNO2, a
different pH and reaction time.
Analysis of milk and water bottle samples
The sample solution was prepared according to the
literature.32,33 Fresh liquid milk samples were purchased
from a local Yonghui supermarket. 5.0 mL milk was first mixed with 10 mL anhydrous alcohol and a volume of
0.5 mL Carrez I (15%, m/v, K4Fe(CN)6.3H2O) and 0.5 mL
Carrez II (30%, m/v, ZnSO4.7H2O) were added to eliminate
samples in order to investigate the recoveries of these water and plastic leaching solution samples.
Results and Discussion
Reaction mechanism
Aromatic amino compounds can react with sodium nitrite
to form diazonium salt at low temperature.34 For SMZ, an
embedded sulfo group was introduced to increase water solubility and electron-withdrawing property. BPA, which contained strong electron-donating group of hydroxyl, was chosen as the coupling compound in this study. Considering all of it, the diazo compounds and coupling compounds were preliminarily selected and the aromatic compounds which contained hydroxyl groups were used in the
condition of alkalinity. In molecular structure, delocalized π
conjugated organic molecules was formed and the coplanar and big conjugate system had strong light-absorbing ability. The conjugates shows steady color of yellow and spectrophotometry method is further available to detect BPA content. The possible mechanism of the reaction can be simply described as the following Scheme 1.
Diazo coupling reactions bring to the formation of
colored substances named azo compounds.32 The azo
compounds formed between diazotized sulfanilic acid and indole in aqueous solution have been early described
in a spectrophotometric method.35,36 In our work, the
development of the reaction occurs in two steps: firstly, the reaction of sulfamethoxazole (SMZ) with sodium nitrite occurs in an acid medium (HCl) producing the diazo compound. Secondly, the diazo compound in alkaline medium coupled with the BPA produced a compound that was monitored at 445 nm.
The UV-Vis absorption spectrum
The UV-Vis absorption spectra of BPA-SMZ in the absence and presence of BPA solutions were shown in
Figure 1. As can be seen from Figure 1, BPA has two absorbance peaks between 200 and 600 nm. The first absorption peak at 225 nm is attributed to the influence of solvent absorbance. The second absorption peak at 278 nm was chosen as the detection wavelength for UV with
HPLC detection.15,31 For SMZ, it also has a characteristic
peak at 266 nm (Figure 1). The diazo coupling reaction between SMZ diazonium salt and BPA afforded a colored complex with an absorption maximum at 445 nm. Water and methanol for SMZ and BPA were respectively used for all analyses. These selections were based on the solubility of the standards and the related analytes in the mentioned solvents (SMZ are easily dissolved in acidic or alkaline solution, meanwhile BPA are preferably dissolved in low-medium polar organic solvents). As can be seen, when
4.6 µg mL-1 BPA were present, the peaks intensity increased
about 2.1 times at 445 nm compared to the intensity of BPA
(9.2 µg mL-1) at 278 nm. The significant increase indicated
a reaction occurred. Furthermore, maximum value around 445 nm has a relationship with concentrations of BPA to an extent.
Conditions of optimization for BPA detection
To achieve the best performance of the developed method, the experimental parameters were optimized in terms of reagent’s concentration, reaction time, pH, and temperature. Other conditions were remained constant during each optimization and the concentration
of BPA is 4.6 µg mL-1 for the sensitive detection in the
spectrophotometric system.
Optimization for the diazotization reaction
Effect of pH
Low pH could increase the stability of the diazonium salt. As the sodium nitrite can easily and fully react with the aromatic primary amine because of the fast reaction rate in low pH, pH of the system has a significant influence on
the diazotization of SMZ. Different volumes of 1 mol L-1
HCl were used to evaluate the effect of the concentration of the acid on the reaction medium. As shown in Figure 2, the absorbance vary gradually with the decrease of pH and reaches the maximum when pH is ca 1.2. Moreover, the absorbance was maximum and stable between 1.0 and 2.0.
Therefore, 6.4 × 10⁻² mol L-1 HCl was chosen as the acidic
medium for the diazotization of SMZ. All measurements were carried out as triplicates.
Effect of time on the diazotization reaction
The relation between the diazotization reaction time in the range of 1-25 min and the absorbance of the mixture solution was investigated. As the diazotization reaction time increased, the absorbance was also increasing. When it reacted for above 5 min, the absorbance remained constant. So, 5 min was chosen as the diazotization reaction time (Figure 3).
Effect of sodium nitrite concentration
Sodium nitrite, as the diazotizing reagent in this system,
plays an important role in diazotizing reaction.37 So the
concentration of sodium nitrite solution varying from 10.0
to 40.0 µg mL-1 was investigated. The results demonstrated
that the increase in absorbance tends to have a constant value for the sodium nitrite solution concentration equal
to or higher than 28.0 µg mL-1, so this concentration was
selected in order to ensure an excess of reagent in the reaction chamber to guarantee the reaction development.
Effect of temperature on diazotization
With the rise of temperature, diazotization speeded up. However, in theory, the diazonium salt was usually relatively stable at low temperature while it was easy to decompose at high temperature. This study tested the effect
Figure 1. (a) UV-Vis absorption spectra of SMZ-BPA azo adduct. Insert: comparison of the blank (ultrapure water), diazo SMZ and SMZ-BPA azo adduct (colored complex); (b) UV-Vis absorption spectra of BPA, SMZ and SMZ-BPA azo adduct. BPA: 9.2 µg mL-1, SMZ: 9.2 µg mL-1, SMZ-BPA azo adduct
potency of 4.6 µg mL-1 BPA.
Figure 2. Effect of pH on the diazo reaction (n = 3). Reaction time: 5 min. SMZ: 9.6 µg mL-1.
of temperature on the diazo reaction between 0 and 30 °C. The results showed that the absorbance was stable in the low temperature (0-10 °C). So diazotization was carried out at 0 °C (under the condition of ice bath).
Optimization for the coupling reaction
Effect of reagent concentration
In order to assure quantitative reaction of the analyte, the effect of varying the concentration of SMZ was evaluated
in the range 5.0-40.0 µg mL-1. Steady state was reached
maximum approximately from 19.2 µg mL-1 SMZ solution
to the system. Absorbance of the colored product was not significantly affected by higher SMZ concentration than
19.2 µg mL-1 in both cases. For its part, 19.2 µg mL-1 SMZ
solution was sufficient to the present work for performing adequate analytical methods.
Effect of the coupling reaction temperature
According to the procedure, the mixture solutions
of 19.2 µg mL-1 of SMZ after diazotization were cooled
or heated in water bath at different temperatures. It was found that the temperature had no significant influence on the signal for the coupling reaction in the 0-30 °C range. Higher temperature resulted in a decrease of the intensity of absorbance. Consequently, we chose room temperature (25.0 °C) as the temperature at which the reactions were conducted.
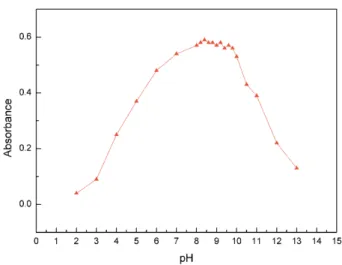
Effect of pH on the coupling reaction
For coupling reaction, the value of pH has great impact on the absorbance intensity according to the experiment method. Coupling in alkaline medium helped to form lively anion of hydroxyl in the BPA. However, when pH was more
than 10.0, diazoate would convert to inert trans-diazoate
and did not couple. As shown in Figure 4, the absorbance increased with the rise of the pH. When the pH increased at the range of 8.0-10.0, the absorbance of azo compound reached the maximum absorbance intensity and kept stable.
Considering this observation, 1.0 × 10⁻⁴ mol L-1 NaOH
solution was selected (pH = 10).
Formation and stability of azo-compound
The results of the coupling reaction of the mixture
solutions of 19.2 µg mL-1 of SMZ occurred for different
times in room temperature were investigated. When the coupling reaction time occurred for above 10 min, the absorbance increased gently. So, 10 min was selected as optimum. The absorbance intensity of the mixture remained stable for at least 24 h under sealed storage at
room temperature. So, this system can satisfy the demand of practical stability primary.
Interference studies
The selectivity of the proposed method was studied by the effect of possible interferents on the determination of
BPA. At the concentration of 4.6 µg mL-1 BPA, changes of
absorption spectra with continuously increasing interferents concentration up to 500 ratio was investigated. As can be seen in Table 1, the concentration of added ion caused less than ± 5% relative error for the determination of BPA in the solution under the optimized conditions. These observations imply that the designed method could be used as a selective and efficient way for the determination of BPA in an aqueous environment.
Linearity, limit of detection, limit of quantification and accuracy
Under the above optimum conditions, plotting the
observed data versus BPA concentration, a graphical
calibration curve was obtained. The calibration curve was a straight line passing through the origin. Figure 5 shows
Figure 4. Effect of pH on the coupling reaction. Results are the average of four consecutive determinations.
Table 1. Tolerance to different substances in the determination of 4.6 µg mL-1 BPA
Species Tolerance ratio (ion / BPA ion)
Methanol, Na+, K+, NO
3-, CN- 500
Ca2+, Mg2+, Cl- 300
Al3+, Zn2+, SO
42- 200
Fe3+, Ag+ 100
that Beer’s law is obeyed over the concentration range
of 0.16-10.4 µg mL-1 for BPA and the linear regression
equation was Y = 0.076 + 0.117X (X: µg mL-1) with a
correlation coefficient of 0.9991. From the slope of the calibration curves, the limit of detection (LOD) and quantification (LOQ) were established. LOD and LOQ
were calculated as follows (ICH Guideline 2005):38
LOD = 3.3S/m, LOQ = 10S/m, where S is the standard deviation of the data and m is the slope of the calibration
curve. The LOD is 0.05 µg mL-1 and LOQ is 0.15 µg mL-1.
Sequentially, the accuracy of the method was determined by means of recovery test. Samples of BPA were spiked with standard solutions at three different concentrations and then analyzed using the proposed method. Good recovery percentages ranged from 99.0 to 102.3% was obtained for BPA quantification methods. Thus, the sensitivity of this method is acceptable for analytical purpose with advantages of quick, simple and sensitivity determination.
Fabrication of test strips for the detection and estimation of BPA
A test strip, similar to pH paper, or a pregnancy test, is widely used and highly desirable for simple and rapid monitoring. In order to facilitate the adoption of our methodology by end users, it would be advantageous to develop a test where the user adds a drop of the reaction mixture to the test strip and determines the presence of BPA by the color of the strip. To develop such a test strip, we
employed a simple method of making test strips.39
A filter paper was first coated with a mixture solution of
SMZ (19.2 µg mL-1), HCl (6.4 × 10⁻² mol L-1), and NaNO
2
(28.0 µg mL-1) in ice-water bath, which was then dried
with freezer dryer. It should be immediately stored to the
refrigerator when not used. Addition of a BPA test solution
(in NaOH-CH3CH2OH) to the strip (pre-moistened with a
mist of water) produces a yellow color within 1 min. This method was able to clearly indicate the presence of BPA since the color change is very discernible from white to yellow (Figure 6). This is a simple and promising method for the semi-quantitative detection and estimation of BPA.
Although this is a powerful ‘yes’ or ‘no’ method for the presence of BPA, a system that produces different colors for a BPA test solution was also designed to present the same characteristics of BPA. A filter paper was first coated with a mixture solution of crystal violet lactone (CVL,
20.0 µg mL-1) which was then dried with freezer dryer.
Addition of a BPA test solution (in pure alcohol) to the strip did not cause any color change to the strip. However, when it was heated by a hair dryer to remove the solvent, it produces a dark blue color within 1 min (Figure 7), which
Figure 5. (a) The absorbance spectra of SMZ-BPA azo adduct in the presence of increasing concentrations of BPA. The concentration of BPA in samples a-q was 0.16, 0.40, 0.64, 1.28, 1.6, 2.4, 3.2, 4.0, 4.8, 5.6, 6.4, 7.2, 8.0, 8.8, 9.6, 10.0 and 10.4 µg mL-1, respectively; (b) the calibration curve of absorbance
intensity versus the concentration of BPA.
further demonstrate the presence of BPA, as well as the reliability of both experimental study and analysis.
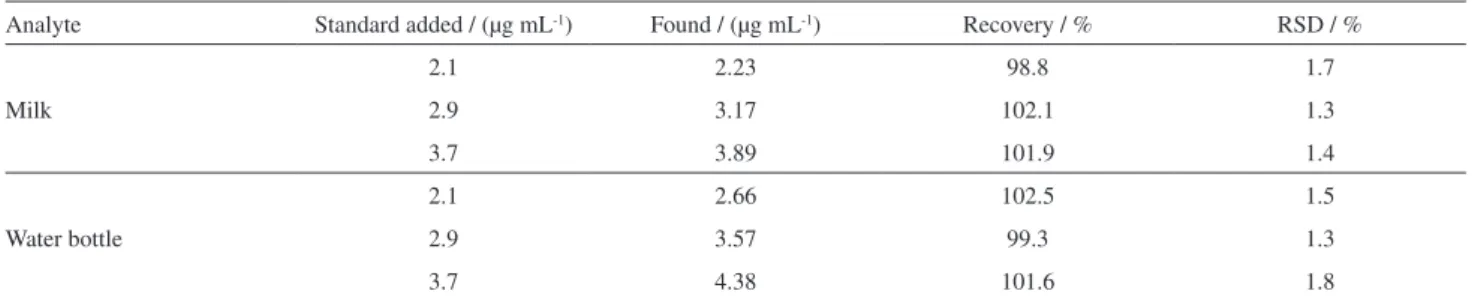
Detection of BPA in milk and water bottle samples
In order to demonstrate the performance of the present method, practical application of the method was assessed by detecting BPA in milk and water bottle samples via standard addition method. Certain known amounts of BPA were added into the treated sample and the recoveries were estimated to be 98.8-102.1% and 99.3-102.5% for milk and water bottle samples, respectively (Table 2). Relative standard deviations (RSDs) for 3 times parallel experiments
ranged from 1.4 to 1.7% and 1.3 to 1.8% for milk and water bottle samples, respectively. These suggest that the developed method possesses potential applicability for BPA analysis in real samples. In sequence, the results were compared with those obtained from conventional HPLC (Table 3). As can be seen, good inter-day precision was established for two analytes utilizing spectrophotometric method, which was in consistency with the results obtained by HPLC method. Nevertheless, the proposed method is easier than the other protocols because it requires less manipulation and it is only necessary that the preparation of the reagent solutions be combined to the reaction. In addition, the results are precise, accurate and rapid.
Conclusions
In this paper, a novel, rapid, and easy method for quantification of BPA based on diazotization-coupling reaction mechanism has been developed. This spectrophotometric method demonstrated to provide reproducible and accurate results using a simple, sensitive and rapid procedure. Good precision and recovery was obtained when the proposed method was applied to milk and water bottle samples. Furthermore, the HPLC method was also applied to the determination of BPA in comparison with the proposed method. The proposed method is satisfied with high sensitivity, accuracy and low detection limit. From a practical point of view, the developed method needs
Figure 7. The tests show a difference in color with and without BPA. (a) Blank; (b) test strip containing crystal violet lactone (CVL) embedded within a filter paper; (c) test strip containing CVL embedded within a filter paper, then added BPA dissolved ethanol solution; (d) then heated to remove the solvent from it.
Table 2. Determination of BPA in milk and water bottle samples by recovery test
Analyte Standard added / (µg mL-1) Found / (µg mL-1) Recovery / % RSD / %
Milk
2.1 2.23 98.8 1.7
2.9 3.17 102.1 1.3
3.7 3.89 101.9 1.4
Water bottle
2.1 2.66 102.5 1.5
2.9 3.57 99.3 1.3
3.7 4.38 101.6 1.8
Average of three determination.
Table 3. Determination of BPA samples combined with HPLC
Analyte Standard added / (µg mL-1) Found / (µg mL-1) Recovery / % RSD / %
Milk
2.1 2.36 104.2 2.4
2.9 3.21 103.7 2.1
3.7 3.83 103.6 1.5
Water bottle
2.1 2.60 101.7 1.9
2.9 3.67 102.2 1.8
3.7 4.44 97.1 2.2
minimum sample treatment, which allowed us to achieve a high analytical productivity. These advantages make the proposed method very suitable for routine analysis of BPA in quality control laboratories.
References
1. Liu, G. L.; Chen, Z.; Jiang, X. Y.; Feng, D. Q.; Zhao, J. Y.; Fan, D. H.; Wang, W.; Sens. Actuators, B 2016, 228, 302.
2. Huang, J. D.; Zhang, X. M.; Lin, Q.; He, X. R.; Xing, X. R.; Huai, H. X.; Lian, W. J.; Zhu, H.; Food Control 2011, 22, 786. 3. Tan, F.; Cong, L.; Li, X.; Zhao, Q.; Zhao, H.; Quan, X.; Chen,
J.; Sens. Actuators, B 2016, 233, 599.
4. Wang, H. Y.; Lee, A. W. M.; Shuang, S. M.; Choi, M. M. F.; Microchem. J. 2008, 89, 90.
5. Vinas, P.; Campillo, N.; Martinez-Castillo, N.; Hernandez-Cordoba, M.; Anal. Bioanal. Chem. 2010, 397, 115.
6. Wetherill, Y. B.; Akingbemi, B. T.; Kanno, J.; McLachlan, J. A.; Nadal, A.; Sonnenscheing, C.; Watson, C. S.; Zoeller, R. T.; Belcher, S. M.; Reprod. Toxicol. 2007, 24, 178.
7. Kamalabadi, M.; Mohammadi, A.; Alizadeh, N.; Talanta 2016, 156, 147.
8. Cao, X. Y.; Shen, F.; Zhang, M. W.; Bie, J. X.; Liu, X.; Luo, Y. L.; Guo, J. J.; Sun, C. Y.; RSC Adv. 2014, 4, 16597.
9. Calafat, A. M.; Kuklenyik, Z.; Reidy, J. A.; Caudill, S. P.; Ekong, J.; Needham, L. L.; Environ. Health Perspect. 2005, 113, 391. 10. Schonfelder, G.; Wittfoht, W.; Hopp, H.; Talsness, C. E.; Paul,
M.; Chahoud, I.; Environ. Health Perspect. 2002, 110, 703. 11. Yan, X. P.; Zhou, C. Q.; Yan, Y.; Zhu, Y.; Electroanalysis 2015,
27, 2718.
12. Hengstler, J. G.; Foth, H.; Gebel, T.; Kramer, P. J.; Lilienblum, W.; Schweinfurth, H.; Volkel, W.; Wollin, K. M.; Gundert-Remy, U.; Crit. Rev. Toxicol. 2011, 41, 263.
13. Hass, U.; Christiansen, S.; Boberg, J.; Rasmussen, M. G.; Mandrup, K.; Axelstad, M.; Andrology 2016, 4, 594.
14. Ballesteros-Gomez, A.; Rubio, S.; Perez-Bendito, D.; J. Chromatogr. A 2009, 1216, 449.
15. Watabe, Y.; Kondo, T.; Morita, M.; Tanaka, N.; Haginaka, J.; Hosoya, K.; J. Chromatogr. A 2004, 1032, 45.
16. Yazdinezhad, S. R.; Ballesteros-Gomez, A.; Lunar, L.; Rubio, S.; Anal. Chim. Acta 2013, 778, 31.
17. Wille, K.; De Brabander, H. F.; De Wulf, E.; Van Caeter, P.; Janssen, C. R.; Vanhaecke, L.; TrAC, Trends Anal. Chem. 2012, 35, 87.
18. Deceuninck, Y.; Bichon, E.; Durand, S.; Bemrah, N.; Zendong, Z.; Morvan, M. L.; Marchand, P.; Dervilly-Pinel, G.; Antignac, J. P.; Leblanc, J. C.; Le Bizec, B.; J. Chromatogr. A 2014, 1362, 241.
19. De Meulenaer, B.; Baert, K.; Lanckriet, H.; Van Hoed, V.; Huyghebaert, A.; J. Agric. Food Chem. 2002, 50, 5273. 20. Ragavan, K. V.; Rastogi, N. K.; Thakur, M. S.; TrAC, Trends
Anal. Chem. 2013, 52, 248.
21. Mita, D. G.; Attanasio, A.; Arduini, F.; Diano, N.; Grano, V.; Bencivenga, U.; Rossi, S.; Amine, A.; Moscone, D.; Biosens. Bioelectron. 2007, 23, 60.
22. Chen, X. L.; Wang, C.; Tan, X. M.; Wang, J. X.; Anal. Chim. Acta 2011, 689, 92.
23. Chung, E.; Jeon, J.; Yu, J.; Lee, C.; Choo, J.; Biosens. Bioelectron. 2015, 64, 560.
24. Mei, Z. L.; Chu, H. Q.; Chen, W.; Xue, F.; Liu, J.; Xu, H. N.; Zhang, R.; Zheng, L.; Biosens. Bioelectron. 2013, 39, 26. 25. Zhu, L. L.; Cao, Y. H.; Cao, G. Q.; Biosens. Bioelectron. 2014,
54, 258.
26. Huang, N.; Liu, M. L.; Li, H. T.; Zhang, Y. Y.; Yao, S. Z.; Anal. Chim. Acta 2015, 853, 249.
27. Darwish, H. W.; Elzanfaly, E. S.; Saad, A. S.; Abdelaleem, A. E. B.; Spectrochim. Acta, Part A 2016, 169, 50.
28. Mirazizi, F.; Bahrami, A.; Haghbeen, K.; Shahbani Zahiri, H.; Bakavoli, M.; Legge, R. L.; J. Enzyme Inhib. Med. Chem. 2016, 31, 1162.
29. Pyrzynska, K.; Microchim. Acta 2005, 149, 159.
30. Cao, G. P.; Zhuang, Y. F.; Liu, B. L.; S. Afr. J. Chem. 2014, 67, 99.
31. Poorahong, S.; Thammakhet, C.; Thavarungkul, P.; Kanatharana, P.; J. Environ. Sci. Health, Part A 2013, 48, 242.
32. Zhang, K.; Hu, Y.; Li, G.; Talanta 2013, 116, 712.
33. Filik, H.; Giray, D.; Ceylan, B.; Apak, R.; Talanta 2011, 85, 1818.
34. Zarchi, M. A. K.; Ebrahimi, N.; J. Appl. Polym. Sci. 2011, 121, 2621.
35. Ahmad, A. K.; Hassan, Y. I.; Bashir, W. A.; Analyst 1986, 111, 243.
36. Yan, Z.; Hu, L.; Nie, L.; Lv, H.; Spectrochim. Acta, Part A 2011, 79, 661.
37. Freitas, S. K. B.; da Silva, V. L.; Araujo, A. N.; Montenegro, M.; Reis, B. F.; Paim, A. P. S.; J. Braz. Chem. Soc. 2011, 22, 279.
38. ICH Guideline; Validation of Analytical Procedures: Text and Methodology Q2 (R1), 2005. Available at http://www.ich.org/ products/guidelines/quality/article/quality-guidelines.html, accessed in December 2016.
39. Joy, A.; Anim-Danso, E.; Kohn, J.; Talanta 2009, 80, 231.
Submitted: October 25, 2016