48 Brazilian Journal of Physics, vol. 37, no. 1, March, 2007
Dark Matter Halos and the Anisotropy of Ultra-High Energy Cosmic Rays
in the Pierre Auger Observatory
Beatriz B. Siffert, B. Lazarotto, J. R. T. de Mello Neto, Instituto de F´ısica, Universidade Federal do Rio de Janeiro,
Caixa Postal 68528, 21941-972, Rio de Janeiro, RJ, Brazil
and Angela Olinto
Department of Astronomy and Astrophysics, Kavli Institute for Cosmological Physics, The University of Chicago, 5640 S. Ellis Ave. Chicago, IL 60637, U.S.A.
Received on 29 September, 2006
We analyze the cosmic ray arrival direction map that would be observed if the source of ultra high energy cosmic rays were the decay of dark matter particles in the halos of our galaxy and of the Andromeda galaxy (M31). To model the dark matter distribution throughout the halos we use two different density profiles, the Moore et al. and the Navarro-Frenk-White profile. The results show what would be seen by the Pierre Auger experiment, since we take into account its exposure. We evaluate the dipole and quadrupole terms for the resulting maps in the two density profiles cases and compare them with the terms expected for an isotropic sky. Keywords: Dark matter; Ultra-high energy cosmic rays; Pierre Auger experiment
I. INTRODUCTION
The origin of ultrahigh energy cosmic rays, that reach us with energy∼1020eV, is still a matter of intense investigation. Until today cosmic ray experiments were not able to collect enough data in order to achieve any conclusions because the flux at these energies is extremely low [1].
The Pierre Auger observatory [2] will consist of two sepa-rate sites, one in Argentina and the other in the US, covering the whole sky with an exposure of about 105km2.sr.yr for the southern instrument and about 106km2.sr.yr for both obser-vatories. Presently the southern instrument is being built in Argentina and should be completed by 2007. It will set new standards for the ultra high energy cosmic rays physics, since it will collect a much bigger amount of data than all previous experiments combined. In particular, it will probably be able to determine if ultra high energy cosmic rays come isotropi-cally from all directios of the sky or if distinct point sources or other patterns exist.
During the propagation of cosmic rays from their source to us, they interact with the cosmic microwave background radi-ation. If the cosmic ray has energy above the threshold energy, 5×10¹⁹eV, this interaction results in the photo-production of pions. The cosmic ray will lose energy through this process and theoretical predictions tell us that if it is detected with an energy higher than the threshold energy, it is likely that it would have come from a source∼102 Mpc distant from us [3], [4]. This is called GZK cutoff and it tells us that poten-tial sources must be close to the Milky Way.
The idea that ultrahigh energy cosmic rays can originate from the decay of super-heavy dark matter particles in the halo of our galaxy and nearby galaxies becomes then very attrac-tive, since potential astrophysical sources are very rare in our neighborhood. There are different candidates for dark matter particles as well as for their possible decay products. If the latter are photons, recent results obtained by the Pierre Auger collaboration [5] show that its data still allows the
possibil-ity that cosmic rays are generated through the decay of dark matter particles.
In this paper, we study the anisotropy patterns that would be observed by the Pierre Auger observatory (North and South sites) if cosmic rays come from the decay of dark matter par-ticles in the halo of the Galaxy and in the halo of the An-dromeda galaxy (M31) [6], [7]. For now, we make no as-sumptions about the nature of these particles.
II. DARK MATTER DENSITY PROFILES
Our analysis strongly depend on how we assume the dark matter particles are distributed throughout the halo. There ex-ist several density profiles derived from high resolution N-body simulations that describe this distribution. We chose to use the Navarro-Frenk-White [8], hereafter NFW, and the Moore et al. [9], [10] profiles, which are believed to be the most accurate ones. They can be parametrized by the follow-ing expression [11]:
ρ(r) = ρ0
(r/r0)γ[1+ (r/r0)α](β−γ)/α
, (1)
wherer is the distance from the center of the galaxy to the halo element, r(0) is the distance from the center of the galaxy to the sun, ρ0=ρ(r0) and the constantsα, β andγ
take the values shown in Table 1.
α β γ
NFW 1.0 3.0 1.0 Moore et al. 1.5 3.0 1.5
Beatriz B. Siffert et al. 49
III. ESTIMATING THE FLUX
Since the Earth is not located in the center of our galaxy, we expect that cosmic rays coming from the decay of dark matter particles would not be isotropic in their arrival direcitons. We defineθas the angle between the galactic plane and the direc-tion connecting the Earth and the dark matter element. The cosmic ray flux due to our galaxy’s halo coming from that di-rection is given by:
ΦGalaxy(θ) =K Z
ρ(r)ds, (2)
whereK depends on the model adopted for the dark matter particle andsis the distance between the Earth and the dark matter element.
If we assume that the dark matter halo of M31 follows the same density profile, the flux of cosmic rays observed on Earth coming from M31 will be [12]:
ΦM31(θ) = ζ D2K
Z
ρ(r)dV, (3)
whereζ∼2 is the ratio between the masses of M31’s halo and our galaxy’s halo andD∼670k pcis the distance to M31.
IV. AUGER’S EXPOSURE
All events detected by the Auger observatory are subjected to its experimental exposure. The exposure gives the probabil-ity that a cosmic ray coming from a given direction of the sky will be detected. For very energetic cosmic rays, this proba-bility actually depends only on the declination coordinate of the cosmic ray direction.
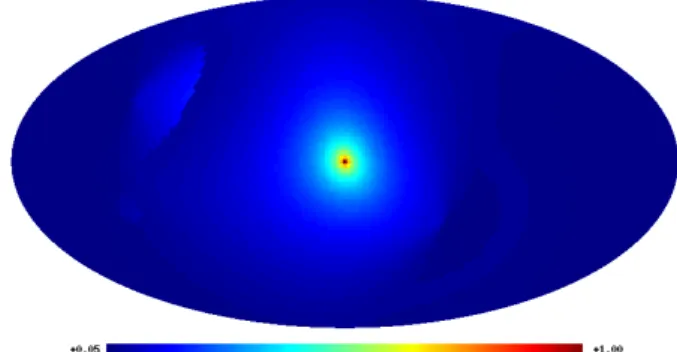
The map that would be observed by the north and the south sites of Auger if sources were distributed isotropically in the sky is shown in Fig 1, in galactic coordinates.
FIG. 1: Auger’s exposure for the southern and the northern sites.
We can see that it is very important that the exposure is de-termined with the highest precision posible, since its paterns could be easily mistaken for an inexistent anisotropy.
V. RESULTS
A. Dark Matter Contribution
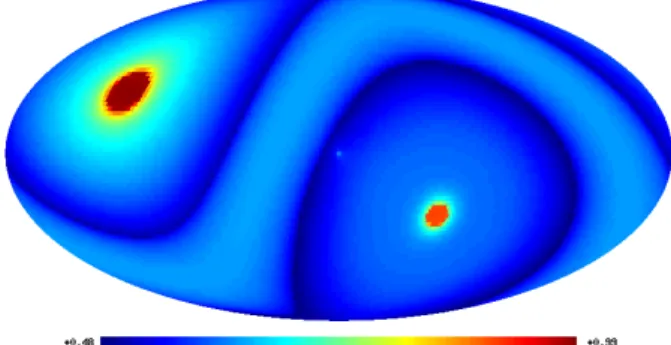
The cosmic ray arrival directions maps that would be ob-served by Auger if we assume that all cosmic rays come from decay of dark matter particles from both our galaxy and M31 can be seen in Fig 2 and Fig 3. We can see what would be detected if both halos follow the NFW or the Moore et al. profile.
FIG. 2: Cosmic rays arrival directions map that would be observed by the Auger observatory if we consider the contributions of both our galaxy’s and M31’s halo, and assume they follow a NFW density profile
FIG. 3: Cosmic rays arrival directions map that would be observed by the Auger observatory if we consider the contributions of both our galaxy’s and M31’s halo, and assume they follow a Moore et al. density profile
We can see that, while both maps show an insignificant con-tribution of M31’s halo, the NFW density profile assumption makes M31 brighter than than it is if we use the Moore et al. profile.
B. Adding an Isotropic Background
50 Brazilian Journal of Physics, vol. 37, no. 1, March, 2007
ΦTotal=η(ΦGalaxy+ΦM31) +ΦIsot. (4) We can then control the intensity of the background in our simulations by changing the value of theηfactor.
Results for the two profiles and two different values ofη
are shown in Figs 4, 5, 6 and 7. We see that the dark matter contribution to all these maps (the bright spot in the center) is very low compared to the exposure effects induced on the background, even for a very high value of η=0.2. Also, for all the maps produced, the contribution of M31 is visually inexistent.
We do not expect however a very high conribution from the galactic center, such as the one being represented by the caseη=0.2. If this contribution really existed, it would have already been seen by other experiments. The contribution we are expecting to see should be much fainter.
FIG. 4: Total flux for NFW density profile andη=0.2
FIG. 5: Total flux for Moore et al. density profile andη=0.2
C. Angular Power Spectrum
In order to quantify the deviation from isotropy of the maps we produced, we chose to measure its angular power spec-trum.
We can expand thecosmic ray intensity functionover the sphere in the base of the spherical harmonics [13]:
FIG. 6: Total flux for NFW density profile andη=0.1
FIG. 7: Total flux for Moore et al. density profile andη=0.1
I(θ,φ) =
∞
∑
l=0l
∑
m=−lalmYlm(θ,φ)
alm= 1 N
N
∑
i=1Ylm(θi,φi),
whereNis the total number of cosmic rays detected. We define then theangular power spectrumas:
C(l) = 1 2l+1
l
∑
m=−la2lm. (5)
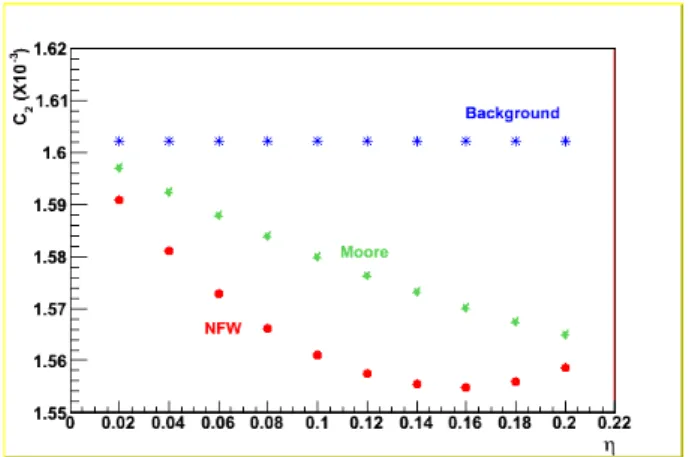
For all the maps obtained we calculated the dipole and quadrupole terms for different values ofη. These results are shown in Figs 8 and 9.
We see that deviation from the isotropic case can be de-tected even for the lowest values ofη. We chose to run the simulations untilη=0.2 because we saw from the previous results that in this case the contribution from our galaxy is already too strong compared to what we expected from the available data.
Beatriz B. Siffert et al. 51
FIG. 8: Dipole term for the background alone (asterisks), the back-ground plus the contribution of the Galaxy and M31 with NFW den-sity profile (dots) and the same with a Moore et al. denden-sity profile (stars)
FIG. 9: Quadrupole term for the background alone (asterisks), the background plus the contribution of the Galaxy and M31 with NFW density profile (dots) and the same with a Moore et al. density profile (stars).
This can be easely understood if we notice that, if those results reflected real dipole or quadrupoles, the points representing the backgroung should be zero throughout the x axis.
VI. DISCUSSION
The results obtained in this work, although very prelimi-nary, indicate that signatures of cosmic rays produced by dark matter decays may be hard to see. Even for cases in which the signal from dark matter origin is big compared with the background, the galactic center is very faint, if exposure sub-traction is not done properly. The contribution of M31’s halo is insignificant when compared to our galaxy’s contribution.
An interesting extension of this study would be the analysis of the case in which not the decay, but the anihilation of dark matter particles in the halos of galaxys were the responsible for the creation of ultra high energy cosmic rays. In this case, our‘s galaxy contribution would have the flux:
ΦGalaxy(θ) =K Z
ρ2(r)ds, (6)
where the only difference from equation 2 is the fact that the density is now squared. The same would apply to M31’s halo and equation 3 would become
ΦM31(θ) = ζ D2K
Z
ρ2(r)dV. (7)
This anihilation scenario may be theoreticaly more plau-sible than the decay one because it doesn’t impose a specfic lifetime for dark matter particles. On the other hand, it would predict a stronger signal from the center of our galaxy that, as aforemenioned, was already not seen by previous experi-ments.
[1] Cosmic rays: the most energetic particles in the universe, J.W. Cronin, Rev. Mod. Phys.71, 165 (1999).
[2] J. Abraham et al., P. Auger Collaboration, Nucl. Instrum. Meth. A523, 50 (2004).
[3] K. Greisen, Phys. Rev. Lett16, 748 (1966).
[4] G.T. Zatsepin and V. A. Kuzmin, JETP Lett.4, 78 (1966). [5] Lecture given at the International School of Cosmic Ray
Astro-physics - 15th Course: ”AstroAstro-physics at Ultra-high Energies”, Erice, Italy, 20-27 June 2006.
[6] G. Medina Tanco, A.A. Watson, Astropart. Phys.12, 25 (1999). [7] W. Evans, F. Ferrer, and S. Sarkar, Astropart. Phys.17, 319
(2002).
[8] J.F. Navarro, C.S. Frenk, and S.D.M. White, ApJ, 490, 493 (1997).
[9] B. Moore, Nature,370, 629 (1994).
[10] R. Flores, J.R. Primack, ApJ,427, L1 (1994).
[11] A.V. Kravtsov, A.A. Klypin, J.S. Bullock, and J.S. Primack, The Astrophysical Journal,502, 48 (1998).