What are the High Energy Cosmic Rays Telling Us?
Ronald Cintra Shellard for the Pierre Auger Collaboration Centro Brasileiro de Pesquisas F´ısicas
Rua Dr. Xavier Sigaud 150, Rio de Janeiro, RJ, 22290-180, Brazil
(Received on 15 August, 2008)
We review in these notes the recent results of the Pierre Auger Observatory related to ultra high energy cosmic rays. We describe the components of the observatory and the status of its operation. The observations related here cover the correlation with astrophysical sources and its implications, as well as the determination of the spectrum at the higher end of energy, and the detemination of the primary cosmic rays being photons. We also report on the limit of the neutrino flux. It is described the next steps in the layout of the Observatory, which includes extending the capabilities of the Southern observatory to lower energies and, in the Northen Hemisphere the construction of a new observatory in Colorado, USA.
Keywords: Cosmic Rays, Galactic Center, Auger Observatory
I. INTRODUCTION
On November 2007, the Pierre Auger Observatory an-nounced the discovery of strong evidence for the correlation between the highest energy cosmic rays recorded and galax-ies with active nuclei (AGN)[1, 2]. This was the first time that a direct link between high energy cosmic rays and possible sources for them was demonstrated. That discovery implied, as well, that the distribution of very high energy cosmic rays do not have an isotropic distribution on the sky. We will de-scribe, in this review, the tools that were used to establish this claim, as well as other results derived from the data collected by Auger. Data collection at the Auger Observatory started at January 2004, when the count of the array detectors was around one hundred and fifty Cherenkov stations. At the mo-ment of this writing the construction of the observatory is al-ready completed, with the four fluorescence eyes and the full array of surface detectors installed and taking data.
The cosmic ray spectrum spans a huge range in energy, starting with a few MeV all the way up to 1020 eV. It can be described by a power law,N(E)dE=K E−xdE, although
with different values for the spectral indexx, for each piece of the energy span. Up to 4×10¹⁵eV, the indexxis ≃ 2.7 and the cosmic rays most likely are produced at supernova explo-sions and their remnants [3]. Between thiskneeand theankle at 5×10¹⁸eV the power law index steepens to 3.2 and its ori-gin is very much open to discussion. The spectrum above this region will be discussed below.
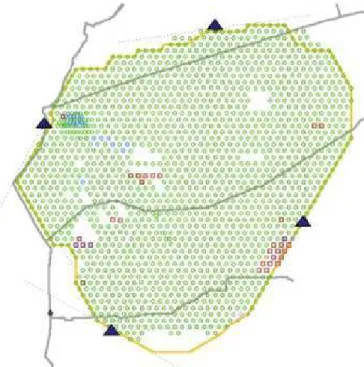
The Pierre Auger Observatory was already described in many reviews [4, 5]. Here we summarize its main char-acteristics. The observatory is a hybrid system with 1 600 Cherenkov stations [6] set in a triangular pattern, with a sepa-ration of 1 500 m between them. This array fill an area of over 3 000 km2, in the Province of Mendoza, Argentina, and has an average height of 1 470 m a.s.l. The area is overlooked by four fluorescence eyes, each of which have six telescopes designed to measure the fluorescence light which trails the atmospheric shower.
The Observatory [7, 8] was designed to study the higher end – above 1018 eV – of the cosmic ray spectrum, with
high statistics, over the whole sky. The detectors are opti-mized to measure the energy spectrum, the direction of ar-rival and the chemical composition of the cosmic rays, using two complementary techniques, surface detectors (SD) based on Cherenkov radiators and fluorescence light detectors (FD). The layout of the southern site, located at the latitude 35◦ South and longitude 69◦West, is shown in Fig. 1, indicating the distribution of surface detectors stations and the position of the fluorescence buildings.
FIG. 1: Layout of the Pierre Auger Observatory southern site show-ing the four FD telescopes (eyes, represented by blue triangles), all in operation. The dots represent the deployement location of the SD stations. There are 1660 tanks deployed and 1605 with the electron-ics installed, taking data. Some holes remain in the distribution of stations due to difficult conditions at those sites. Later, some stations which sit at the edge of the array will be moved to those positions.
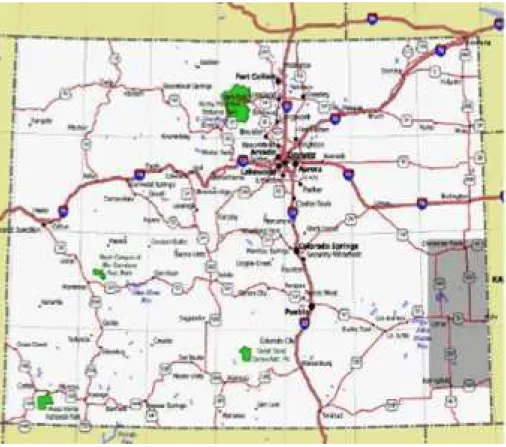
hemisphere, just completed, and another at a northern site, already chosen to be in the southeast corner of the state of Colorado, in the USA. The construction of this observatory should start soon, in order to map all the possible sources of ultra high energy cosmic rays, and it is planned to be seven times as large as the southern observatory.
The surface detector station the SD system is a cylindrical tank, filled with 12 000 liters of purified water, operating as a Cherenkov light detector. The internal walls of the stations have a high reflectivity to ultraviolet light, diffusing the UV Cherenkov light generated by the passage of particles through the volume of water. This light is collected by three photo-multiplier tubes facing downwards to avoid the direct hit of the light. The collected signal is proportional to the length of the charged tracks crossing the water. The stations are pow-ered by batteries fed by solar panels and communicate with a base station through a radio link. The time synchronization of the tanks, capable of a time alignment precision of about 10 ns [9] is based on aGPSsystem.
Each detector station has a two level trigger, a hardware im-plemented T1 and a software T2, set with a threshold defined in terms of a vertical equivalent muon (VEM) crossing a tank. The event trigger (T3) is set at the central station, combining the triggers of contiguous individual stations. The calibration of the surface stations is done continuously, by taking an his-togram of the low energy particles at every six minutes, in parallel to the data taking process. The incoming angle of a shower is reconstructed from the difference on the arrival time of the signals in each of the the tanks registring an event.
The Fluorescence Detector (FD) is formed by four eyes, lo-cated at the periphery of the surface array, with all the ground stations contained in the field of view (FOV) of the FD scopes [10] (see Fig. 1). Each eye has six independent tele-scopes, each with a field of view of 30◦in azimuth and 28.6◦ in elevation, adding to a 180◦ view of the array. The fluo-rescence light is collected by a mirror with a radius of 3.4 m and reflected into a camera, located at the focal surface of the mirror. The telescopes use a Schmidt optics design to avoid coma aberration, with a diaphragm at the center of curvature of the mirror, with an external radius of 0.85 m. The light col-lecting area of the diaphragm is doubled by the use of correc-tor rings [11]. The light is collected by 440 photomultipliers, each of which survey a solid angle of(1.75◦)2projected into the sky. The pixels are sampled and the signal is digitilized at every 100 ns [12]. Although the FD system can give a much more accurate measurement of a atmospheric shower it has the drawback of operating only during moonless nights amount-ing to duty cicle which is roughly 12% of that of the SD array. But the advantage of using this hybrid system is that the frac-tion of showers measured simultaneously by both techniques are used for the cross calibration of the detectors increasing the accuracy of the energy determination of the events regis-tered by the surface array.
An accurate estimate of the light attenuation by the atmo-sphere is essential for the reconstruction of the energy of the atmospheric shower. There is a complex set of instruments measuring the properties of the atmosphere: the Horizon-tal Attenuation Monitor (HAM), the Aerosol Phase Function
monitors (APF) and the Lidar systems [13, 14] mounted at each eye. This system is complemented by the Central Laser Facility (CLF) [15] that simulates an artificial cosmic ray, at regular intervals, by flashing an UV beam into the sky and at the same time feeding a signal into a nearby tank through a fiber optics cable [16].
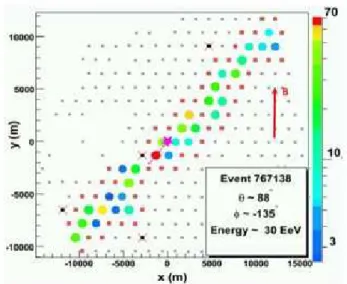
The Auger ground stations are sensitive to very inclined showers once it offers a sizeable cross-section to them due to the 1.2 m column of water. The very inclined showers will have traversed a larger amount of atmospheric matter be-fore hitting the station and a large part of the electromagnetic shower will have been dissipated, remaining essentially the muonic component. An example of this class of event is dis-played in Fig. 2 with a shower hitting 31 stations, coming with a zenith inclination of 88◦. However, if an horizontal shower shows a large electromagnetic component, that would be a possible signal of a neutrino induced shower.
FIG. 2: Event with a large zenith angle, 88◦in this case. The signal is carried by the surviving muons, with a very sharp risetime. The electromagnetic component of the shower has been dissipated.
A. The angular resolution
The angular resolution of the events recorded by the surface detector is determined on an event by event basis using the zenith and azimuth uncertainties in the relation
F(η) =1/2(V[θ] +sin2(θ)V[φ],
well as reasonable decription of the front geometry. Bonifazi et al.[18] have developed an empirical model to determine the uncertainty on the time measurements the shower front time. The variance is defined by
V[Ts] =a2
µ
2T50
n
¶2
n−1 n+1+b
2,
whereT50is the time it takes to reach 50% of the total inte-grated signal on a tank,nis related to a model for the number of equivalent muons crossing the tank and the parametersa andb are determined from the data, using pairs of adjacent stations which were set at some points in the array.
The angular resolution for each event is then calculated, ap-plying the model or the time uncertainty and using another one for the shape of the shower front. The angular resolution for various station multiplicities, as a function of of zenith angle is shown at Fig. 3.
FIG. 3: Angular resolution for the Surface Detector as a function of the zenith angleθ, plotted for different station multiplicities.
This estimate for the angular resolution was checked using a subset of the array where the stations come in pairs 11 m apart. From Fig. 3 one can infer that the angular resolution is better than 1.2◦for 4 and 5 folds events, corresponding to energies in the range of 3<E<10 EeV and better than 0.9◦ for higher multiplicities, where the energies are in excess of 10 EeV.
B. The energy determination
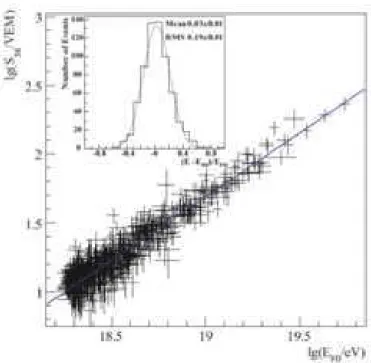
To measure the energy of the cosmic rays Auger relies on the hybrid nature of the experiment using the data itself in
FIG. 4: Correlation between the surface detector signal and the FD energy. The data involve 661 high quality hybrid events. The full line is the best fit to the data. The inset shows the dispersion of the data around the best fit.
place of simulations. Although the FD detector has a duty cicle of roughly 12% of the operation of Auger, it measures directly the energy deposited by a shower in the atmosphere. The fluorescence light is emitted by the de-excitation of the N2molecules, activated by the charged particles crossing the air. It is directly proportional to the number of charged parti-cles in the shower. For showers registered only by the surface detector the energy estimator used isS(1000), the size of the signal at 1000 m from the core of the shower. Actually there is a correction needed to a proper estimation of the energy which is dependent on the zenith angle. We assume that true cosmic ray intensity at a certain energy is the same for all di-rections. This method, theconstant intensity cutmethod [19], prescribe that the value of S(1000) corresponding to the me-dian zenith angle of 38◦is used as a reference. That quantity, S38, is then used to correlate with the energy determined by the fluorescence detector. For the results reported here, 661 hybrid events were used to set an absolute calibration for all the SD events. We show in Fig. 4 the correlation for the hybrid events betweenS38andEFD, and where a power law,
EFD=1.49×10¹⁷eV×S1.0838
[21] 9.5%.
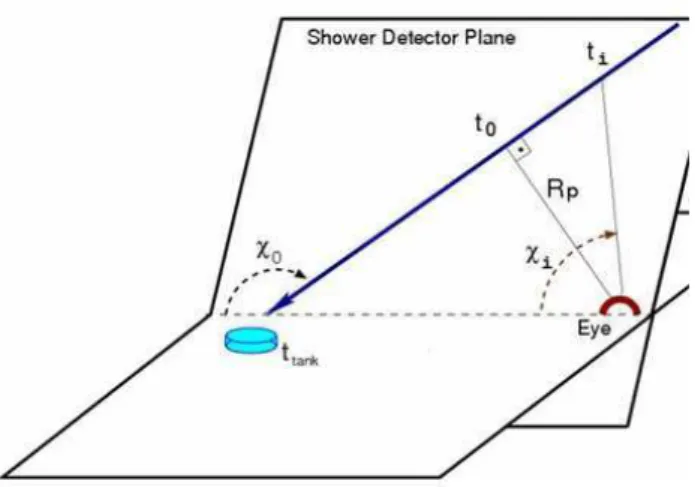
The geometry of the shower is reconstructed by determin-ing first the shower detector plane (SDP, see the Fig. 5) op-timizing the fitting of the line of light crossing the camera, where the signals act as weight. The best estimate of the nor-mal vector to theSDP,~nSDP, is obtained by minimizing
χ2=
∑
i
wi[~nSDP·~ri]2
where the signal measured in pixeliis used with the weightwi
and the~ricorresponds to the direction pointing to the source
in the sky. The three dimensional geometry is recovered using the angular velocity of the signal. For each shower pixelithe average time of the arrival of the light at that pixel field of view,ti, is determined from the FADC traces. The expression
[22],
ti=t0+
Rp
c tan
·
(χ0−χi)
2
¸
,
allows for a fitting of the shower parameters,Rp,χ0andt0. Here, c is the velocity of light, Rp the shower distance of
closest approach to the detector andt0the time at which the shower point reaches the position of closest approach. χi,
in-dicated on Fig. 5, is the direction of the pixeliprojected onto theSDPandχ0is the angle between the shower axis and the direction from the detector to the shower landing point. How-ever, this procedure is not free of ambiguities, which can be resolved with the input from the SD system. The timing in-formation and location from a station closest to the shower landing point can be related to the timet0,
t0=ttank−
~
Rtank·~Sshw
c ,
where~Rtankis the vector connecting the fluorescence detector
to the ground station and~Sshwis the unit vector associated to
the shower propagation.
To measure the energy, the light emitted by the source is reconstructed making the corrections for the atmosphere at-tenuation and than subtracting the Cherenkov component of the signal, identifying the fluorescence component. The line fitting the longitudinal profile represents the Gaisser-Hillas function [23].
Although there is much work to do to improve the quality of the measurements done with the SD and FD components, there are some preliminary tests that points to overall quality of the data. In particular, the correlation in the estimation of the energy of hybrid events, measured by the SD and the FD, is quite consistent.
II. CORRELATION
Active Galactic Nuclei (AGN) has been always on the front list of possible sources for the acceleration of cosmic rays to ultra high energies [24–26]. So it is natural to search for corre-lation between nearby AGNs and the highest energies cosmic
FIG. 5: Shower detector plane.
rays [1, 2]. To search for this correlation we used a data set of all events collected from January 1, 2004 when the surface array had 154 active stations, up to August 31, by the time the array had expanded to 1388 active stations. A set of quality cuts were imposed on the data to assure that only well defined showers were used in the sample. The first requirement is that at least five stations surrounding the station with highest sig-nal, were active. The reconstructed core of the shower was required to be within a tringle where all stations where active. Only events with reconstructed energies in excess of 40 EeV and zenith angle smaller than 60◦were considered, adding to a total of 81 events surviving these conditions.
The list of AGN was taken from the 12th edition of the V´eron-Cetty and V´eron (VCV) catalog [27].
We search for correlation such that any pair of an event and an object from the catalog have an angular separation smaller than a pre-defined valueψ. The probability P thatkor more events, out of a total sample of N events, are correlated by chance with the selected objects in the catalog, at a defined angular scale, is given by the cumulative binomial distribution
P=
N
∑
j=k
=
µN
j
pj(1−p)N−j, (1)
wherepis the probability that an individual event taken from an isotropic flux has an arrival direction with angular distance smaller thanψto any of the selected sources from the catalog. This value is the exposure-weighted fraction of the sky, which is roughly the integrated area over the sphere, generated by the circles with aψradius around all sources. This value depends on the number of sources as well, the larger their number the largest the value ofp. The number of sources is associated to the maximum redshift value defined,zmax, which is a different
other hand, the value ofNrepresent the total number of events, where the larger the energy, the smaller the value ofN.
Indications for the correlation between the highest energy cosmic rays and the AGNs where found on the sample of events collected prior to the 26th of May, 2006, by searching the minimum of the probabilityP, defined by the Equation 1, by scanning the three dimensional space defined by the pa-rameters Eth,ψandz. The set of parameters minimizing P
was found to have as energy thresholdEth equal to 56 EeV,
a correlation circle of 3.1◦and, a maximum distance charac-terized byzmaxless or equal to 0.018. There where 15 events
with energies aboveEthand from those, 12 correlated which AGNs. Having this indication we decided to build a statistical test based on these parameters over a completely independent data set. We established a search protocol requiring a rejec-tion of the hypothesis of isotropy of the arrival direcrejec-tions of the highest energy cosmic rays with a confidence level in ex-cess of 99%. The protocol was applied on the data collected after the date of 26 of May, 2006 and had the prescription fullfilled less than one year later. We collected 13 events with energies above 56 EeV of which 8 had arrival directions closer than 3.1◦from AGNs contained in a radius ofz
max less than
0.018, or equivalently, 75 Mpc. If the arrival directions were random, we would have expected only 2.7 events to corre-late. The probability defined at Equation 1 for this arrange-ments of events to happen by chance, if the flux is isotropic, isP = 1.7 ×10⁻³.
We run again over the full data set and then do a new scan to obtain the best estimate for the correlation parameter, search-ing the range forEth ≥40 EeV starting event by event at those
of higher energies and then adding to the sample a single event at a time. The range forψis scanned in steps of 0.1◦within the range 1◦ ≤ ψ ≤ 8◦. The range inzmaxis scanned in steps
of 0.001 within the bounds 0 ≤ zmax ≤ 0.024. The minimum
probability for the hypothesis of isotropic arrival directions is found for the parameter setzmax = 0.017, corresponding to a
distance of 71 Mpc,ψ = 3.2◦andE
th = 57 EeV, consistent
with the initial exploratory scan.
We show in Fig. 6 a sky map of the events with energy above 57 EeV, with a circle of 3.2◦attached to each event and 442 selected AGNs withzless than 0.017 in the VCV catalog, of which 292 are in the field of view of the observatory. Of the 27 cosmic rays events selected, 20 are correlated to AGNs, while 5.6 are expected on average, if the flux were isotropic, corresponding top =0.21. Were we exclude the region of the disk of the galactic plane, by taking into account only events that are at least 12◦out of the galactic plane, we would be left with 21 events, of which 19 correlate. The argument one could use for excluding this region is that it would avoid the much larger magnetic fields associated to our galaxy and, also, a re-gion of the sky where the catalogs are notoriously incomplete.
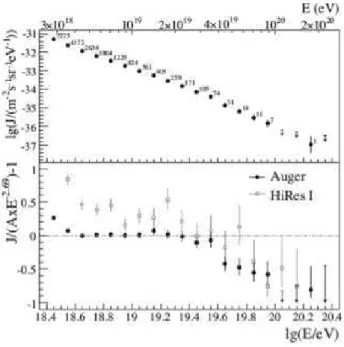
III. THE SPECTRUM
The measurement of the high energy spectrum of the cos-mic rays was based on 20 000 surface detector events with the energy scale set by the correlation ofS38 andEFD shown in
FIG. 6: The Aitoff projection on galactic coordinates of the VCV [27] catalog of 472 AGNs which are at a distance of less thanz< 0.018 (marked by red crosses) and the 27 events in the Auger data set with energies in excess of 57 EeV, with a circle of 3.1◦around their arrival direction. Darker colours indicate larger relative exposure. Our closest AGN, Centaurus A is marked in white.
Fig. 4. Only data with energies above 2.5×10¹⁸eV and zenith angle less than 60◦were considered for this analysis. The re-quirement that the core of the shower be located within the array was also imposed. The event acceptance criteria and the exposure calculation are described in a separate paper [28].
The energy spectrum [29] is shown in Fig. 7, with the en-ergy scale described above. The total systematic enen-ergy scale uncertainty is 22%, where a large contribution comes from the determination of the fluorescence light yield in the atmo-sphere. Also shown in Fig. 7 is the residuals relative to a spec-trum with a spectral index of 2.69, as well as the same data from the HiRes experiment [30].
IV. OTHER RESULTS
A. Primary composition
One of the most important measurements in the aim of Auger is the determination of the nature of the primary par-ticle or the cosmic ray mass composition. Most cosmic rays are assumed to be hadronic in nature, however, there could be a significant component of photons or even neutrinos in their mixture. One of the more sensitive estimator for the mass composition of a shower is the depth at which a shower reaches its maximum development, Xmax. The FD system
measures the longitudinal development of the shower through the atmosphere and so, it measures directlyXmax. This
quan-tity grows logarithmically with the energy of the primary par-ticle, defining the elongation rate of the cosmic rays. Fig. 8 shows the reconstructed meanXmax as a function of energy,
measured with the Auger data [31]. The blue and red lines are the expected meanXmaxvalues for iron and proton
FIG. 7: Top: The measured spectrum. The numbers of events that contributed to each point is annotated. Lower: Deviation of the be-haviour of the spectrum, in relation to a power law (see text).
protons and heavier nuclei that evolves to a more lighter com-position. However, the inflection at 2 EeV could be the result of a change of behaviour of hadronic interactions at higher energies. This happens in the same region where the spec-trum changes its spectral index (see Fig. 7). Although the plot in Fig. 8 must be taken as preliminary, its behaviour is quite striking. The point at the highest energy, where there are strong indications that the cosmic rays should be dominated by protons, inferred from the results shown in the section on the correlation, seems to indicate a heavier composition. If this result resists a larger sample of collected data it could well be an indication of changes on the properties of hadronic interactions.
B. The photon limit
We reported in a previous review [5] the limits imposed on the probability of the primary being a photon based on data from the FD system. This result [32] take advantage of the much deeper penetration on the atmosphere of a photon in-duced shower, as compared to a hadronic shower. We show in Fig. 9 the difference in the shower penetration as measured by theXmaxof FD showers with energies above 16 EeV,
com-pared with the simulated values one would expect had those showers being generated by primary photons. The statistical method for deriving an upper limit follows that introduced in [33]. We set the upper limit on the photon fraction of 26% at a confidence level of 95% from this set of data. More details of this analysis can be found in [32] and references therein.
This analysis was repeated using the data from the SD
de-FIG. 8: Elongation rate.
FIG. 9: Example ofXmax measured in an individual shower of 16 EeV (point with error bar) compared to theXmax distribution ex-pected for photon showers (solid line).
tectors with a much higher statistics [34]. The method devel-oped to search for photon induced showers using the Surface Detector is based on observables sensitive to the longitudinal development of the showers, the signal risetime and the cur-vature of the shower front. Applying this method to the data collected between January 1, 2004 and December 31, 2006, upper limits on the flux of photons of 3.8×10−3,2.5
×10−3 and 2.2 ×10⁻³km−2sr−1yr−1above 1019eV, 2 ×10¹⁹eV, and 4 × 10¹⁹ eV, respectively, are derived, with the corre-sponding limits on the fraction of photons being 2.0%, 5.1%, and 31%, all at the 95% C.L. These limits are a significant im-provement on the bounds set by previous experiments and put severe constraints on models for the origin of cosmic rays, in particular, on top-down models such as the super-heavy dark matter scenario [35, 36].
FIG. 10: The upper limits on cosmic-ray photon fraction derived by Auger [32, 34] (black arrows) along with previous experiments and estimates based on non-acceleration models (see main text for references).
C. The neutrino limit
Neutrinos interact weakly with matter, even at energies to which Auger is sensitive. However, Auger is sensitive to neu-trinos which come from a direction nearly horizontal. A reg-ular shower nearly horizontal will have dissipated most of its electromagnetic component, remaining only energetic muons and a small electromagnetic halo, generated by those parti-cles. So one of their main characteristics is its sharp peak generated by a thin front of muons. Nearly horizontal show-ers that have the characteristics of a regular shower are natural candidates to be originated from a neutrino interaction deep in the atmosphere or, inside the Earth and moving upwards, the ”Earth-skimming” neutrinos. The tau neutrino in particular can undergo charged-current interactions and produceτ lep-tons, which can travel tens of kilometers in the Earth at EeV energies and emerge in the atmosphere and decay, producing a nearly horizontal air shower [41–43]. In this respect, Auger offers a target volume for neutrinos quite large. So, we de-veloped an identification criteria to find atmospheric showers that are generated by tau leptons emerging from the Earth. We found no candidate in the sample collected from January 1, 2004 up to August 31, 2007. From this negative result we are able to set an upper limit on the diffuse neutrino flux as [44]
Eν2/dNντ/dEν<1.3×10−
7
GeV cm−2s−1sr−1,
in the energy range 2×10¹⁷eV<Eν<2×10¹⁹eV. This re-sult, exhibited in Fig. 11, is the most sensitive bound on
neutri-nos in the EeV energy range. The existence of the GZK cutoff implies that there is a neutrino background, which is shown in Fig. 11, to which our sensitivity will be able to detect in about five years of collected data.
FIG. 11: Limit at the 90% C.L. for a diffuse flux ofντ. Limits from
other experiments are converted to a single flavour assuming a 1:1:1 ratio of the 3 neutrino flavours and scaled to 90% C.L. where needed. The shaded curve shows the range of expected fluxes of GZK neutri-nos. See [44] for references.
V. THE NEXT STEP
Since the original plan to build Auger, the requirement of a Northern site was always present due to the necessity of mea-suring the whole sky, for sources could be very different in each Hemisphere. The actual existence of the GZK cut-off, on the other hand, expose the fact the the current size of the ob-servatory is actually small. originally it was designed having in mind the evidences for the existence of trans-GZK events. They did not materialize. So the challenge now is to set, in the Northern Hemisphere an observatory with a much larger aperture, so as measure the very high energy end of the cos-mic ray spectrum with higher statistics. Auger North will fo-cus on achieving higher statistics above 6 × 10¹⁹eV, where the GZK effect filter close sources from the universe isotropic background. The plans for Auger North calls for the same ba-sic elements from Auger South, a surface array and a set of fluorescence telescopes. Due to the structure of the country roads in Colorado, the array will be set on a square one mile grid, with a surface station at every other corner of the grid with a spacing of√2 mile. There will be 4 000 surface sta-tions over an area of 20 000 km2. The projection of this are in the map of Colorado is shown in the Fig. 12.
FIG. 12: Map of the state of Colorado with the shade being the area where Auger North will be build. When build, the array will be almost seven times as big as that of the South.
the same region where Auger Sur is set.
VI. CONCLUSION
The construction of the southern part of the Pierre Auger Observatory was just concluded. But before its completion Auger had already an exposure larger than all the previous experiments sensitive to the highest energy part of the cos-mic ray spectrum. The data collected by the observatory al-lowed already for setting important bounds on the probability of photons being the primary cosmic rays. This result by it-self imposes very strong constraints on models which rely on new physics to explain the presence of very high energy cos-mic rays in the spectrum. The observatory is sensitive to the
presence of tau neutrinos in the cosmic flux. We have already set limits to this flux wich are stronger than those of dedicated experiments.
The most important result was the proof of the anisotropic nature of the highest energy cosmic rays, which strongly im-plies that their sources are extra-galactic. This result com-bined with the mesurement of the spectrum up to the high-est energies confirm the prediction, almost half century old, on the limit of the cosmic ray flux, proving the presence of the GZK cut-off. The conclusion we derive from this is that Auger south although gigantic by any measure was shown to be too small. Thus the plans of Auger of building the northern version of the observatory with an acceptance that is almost a factor of seven larger than the south. The expansion of the southern site is a must as well. But this is still in the future
[1] J. Abraham et al. [The Pierre Auger Collaboration]. Science 318, 939 (2007).
[2] J. Abraham et al. [The Pierre Auger Collaboration]. Astropart. Phys.29, 188 (2008).
[3] F. A. Aharonian et al. Nature432, 75 (2004).
[4] J. Abraham et al. [The Pierre Auger Collaboration]. Nucl. Instr. Meth. A523, 50 (2004).
[5] R. C. Shellard. Braz. J. Phys.36, 1184 (2006).
[6] I. Allekotte, A. F. Barbosa, P. Bauleo, C. Bonifazi, andet al.
Nucl. Instr. Meth. A586, 409 (2008).
[7] The Pierre Auger Collaboration. The Pierre Auger Observatory Design Report. FERMILAB-PUB-96-024, 1996).
[8] The Pierre Auger Collaboration. The Pierre Auger Observa-tory Technical Design Report. (http://www.auger.org/admin) (2001).
[9] C. Pryke. Nucl. Instr. Meth. A354, 354 (1995).
[11] R. Sato and C. O. Escobar. Proceedings of the 29th Interna-tional Cosmic Ray Conference (Pune, India)8, 13 (2005). [12] H. Kleifges [The Pierre Auger Collaboration], Nucl. Instr.
Meth. A518, 180 (2004).
[13] R. Mussaet al. Nucl. Instr. Meth. A518, 183 (2004). [14] R. Cester et al. Proceedings of the 29th International Cosmic
Ray Conference (Pune, India)8, 347 (2005).
[15] F. Arqueros et al.Proceedings of the 29th International Cosmic Ray Conference (Pune, India)8, 335 (2005).
[16] P. Allison et al., Proceedings of the 29th International Cosmic Ray Conference (Pune, India)8, 307 (2005).
[17] Maximo Ave [for the Pierre Auger Collaboration], Proceed-ings of the 30th International Cosmic Ray Conference (M´erida, Yucatan, Mexico)(2007).
[18] A. Letessier-Selvon, C. Bonifazi and E. M. Santos, Astropart. Phys.28, 523 (2008).
[19] J. Hersil, Phys. Rev. Lett.6, 22 (1961).
[20] B. Dawson [for the Pierre Auger Collaboration], Proceedings of the 30th International Cosmic Ray Conference (M´erida, Yu-catan, Mexico)(2007).
[21] R. Knapiket al.[for the Pierre Auger Collaboration]. Proceed-ings of the 30th International Cosmic Ray Conference (M´erida, Yucatan, Mexico)(2007).
[22] P. Sommers. Astropart. Phys.3, 349 (1995).
[23] T. K. Gaisser and A. Hillas. Proccedings of the 15th Inter-national Cosmic Ray Conference (Plovdiv, Bulgaria)8, 353 (1977).
[24] P. L. Biermann and P. Strittmatter. Astrophys. J.322, 643 (1987).
[25] S. E. Perez Bergliaffa G. E. Romero, J. A. Combi and L. A. Anchordoqui. Astropart. Phys.5, 279 (1996).
[26] M. Lyutikov and R. Ouyed. Astropart. Phys.27, 473 (2007). [27] M. P. V´eron-Cetty and P. V´eron. Astron. Astrophys.455, 773
(2006).
[28] D. Allard et al. [arXiv:astro-ph/0511104] (2005).
[29] J. Abraham et al. [The Pierre Auger Collaboration]. Phys. Rev. Lett.101, 061101 (2008).
[30] R. U. Abbasiet all. Phys. Rev. Lett.100, 101101 (2008). [31] M. Unger [for the Pierre Auger Collaboration]. Proceedings
of the 30th International Cosmic Ray Conference (M´erida, Yu-catan, Mexico)(2007).
[32] J. Abraham et al. [The Pierre Auger Collaboration]. Astropart. Phys.27, 155 (2007).
[33] Markus Risse et al. Phys. Rev. Lett.95, 171102 (2005). [34] J. Abraham et al. [The Pierre Auger Collaboration]. Astropart.
Phys.29, 243 (2008).
[35] G. Sigl P. Bhattacharjee. Phys. Rep.327, 109 (2000). [36] S. Sarkar. Acta Phys. Polon. B35, 351 (2004). [37] K. Shinozaki et al. Astrophys. J.571, L117 (2002).
[38] M. Ave, J. A. Hinton, R. A. Vazquez, A. Watson, and E. Zas. Phys. Rev. Lett.85, 2244 (2000).
[39] G. Gelmini, O. Kalashev, and D. V. Semikoz. [arXiv:astro-ph/0506128[ (2005).
[40] John R. Ellis, V. E. Mayes, and D. V. Nanopoulos. [arXiv:astro-ph/0512303[ (2005).
[41] J. L. Fenget al. Phys. Rev. Lett.88, 161102 (2002). [42] D. Fargion. Astrophys. J.570, 909 (2002).
[43] A. Letessier-Selvon. AIP Conf. Proc.566, 157 (2001). [44] J. Abraham et al. [The Pierre Auger Collaboration]. Phys. Rev.
![FIG. 6: The Aitoff projection on galactic coordinates of the VCV [27] catalog of 472 AGNs which are at a distance of less than z <](https://thumb-eu.123doks.com/thumbv2/123dok_br/18982907.457714/5.892.474.838.85.300/fig-aitoff-projection-galactic-coordinates-catalog-agns-distance.webp)
![FIG. 10: The upper limits on cosmic-ray photon fraction derived by Auger [32, 34] (black arrows) along with previous experiments and estimates based on non-acceleration models (see main text for references).](https://thumb-eu.123doks.com/thumbv2/123dok_br/18982907.457714/7.892.78.447.110.437/limits-fraction-derived-previous-experiments-estimates-acceleration-references.webp)