Article
CHANGE DETECTION IN FORESTS AND SAVANNAS USING
STATISTICAL ANALYSIS BASED ON GEOGRAPHICAL OBJECTS
Detecção de mudanças em florestas e savanas utilizando análise estatística
baseada em objetos geográficos
Lucilia Rezende Leite 1
Luis Marcelo Tavares de Carvalho 1
Fortunato Menezes da Silva 2
Federal University of Lavras, Forestry Sciences Department, Zip Code 37200‑000 Lavras, MG, Brazil. e-mail address: [email protected], [email protected] 1
Federal University of Lavras, Physics Department, Zip Code 37200‑000 Lavras, MG, Brazil. e-mail address: [email protected] 2
Abstract:
The aim of this work was to assess techniques of land cover change detection in areas of Brazilian Forest and Savanna, using Landsat 5/TM images, and two iterative statistical methodologies based on geographical objects. The sensitivity of the methodologies was assessed in relation to the heterogeneity of the input data, the use of reflectance data and vegetation indices, and the use of different levels of confidence. The periods analyzed were from 2000 to 2006, and from 2006 to 2010. After the segmentation of images, the descriptive statistics average and standard deviation of each object were extracted. The determination of change objects was realized in an iterative way based on the Mahalanobis Distance and the chi-square distribution. The results were validated with an early visual detection and analyzed according to Receiver Operating Characteristic (ROC) Curve. Significant gains were obtained by using vegetation masks and bands 3 and 4 for both areas tested with 94,67% and 95,02% of the objects correctly detected as changes, respectively for the areas of Forest and Savanna. The use of the NDVI and different images were not satisfactory in this study.
Keywords: Brazilian Savanna, Amazon Forest, remote sense, segmentation of images, Distance of Mahalanobis.
Resumo:
foram extraídas as grandezas estatísticas descritivas média e desvio padrão de cada objeto. A determinação dos objetos de mudança foi realizada de forma iterativa com base na Distância de Mahalanobis e na distribuição qui-quadrado. Os resultados foram validados com uma prévia detecção visual e analisados de acordo com a curva ROC. Foram obtidos ganhos significativos na utilização de máscara e das bandas 3 e 4 para ambas as áreas testadas com 94,67% e 95,02% dos objetos corretamente detectados como mudança, respectivamente para as áreas de Floresta e Savana. O uso do NDVI e de imagens diferentes se mostraram insatisfatórios para a detecção de mudanças nas áreas testadas.
Palavras-chave: Savana brasileira, floresta amazônica, sensoriamento remoto, segmentação de imagens, distância de Mahalanobis
1. Introduction
Changes in land use and land cover are observed in several regions around the world, and in different spatial and temporal scales. The causes derive from anthropogenic activities and natural phenomena. The causes of anthropogenic origin result from socio-economical, political and cultural activities (Lambin et al., 2001) and provoke impacts on the diversity and climate of natural systems (Hussain et al., 2013; Nagendra et al., 2013).
Conversion of native vegetation in anthropogenic areas is considered the most important aspect for preserving the sustainability of ecosystems, affecting the carbon cycle, landscape fragmentation and causing the loss of biodiversity (Klink and Machado, 2005; Carvalho et al., 2009).
Inherent to the challenge of understanding the dynamics of changes in terrestrial coverage is the challenge of generating mechanisms that enable monitoring in an automated way and with satisfactory results, once monitoring large territorial areas is still a costly process due to the vast amount of data and the lack of appropriate methods to deal with natural and anthropogenic peculiarities of the areas.
The analysis of remote sensing data provides information about the dynamics of land cover changes, resulting in gains for territorial planning, and giving support to initiatives of biodiversity conservation and monitoring programs in areas with anthropogenic pressure (Coppin et al., 2004).
Moreover, in order to improve the existing techniques and expand the application for other areas, researchers have been focusing their work on developing new methodologies, such as those based on geographic objects (Hay et al., 2005; Concheda et al., 2008; Blaschke, 2010), and more recently, those that put together the advantages of using the information at segment level with stochastic processes (Desclée et al., 2006 and Bontemps et al., 2008). However, there is a lack of studies to identify and improve the most robust techniques for change detection in areas with different levels of vegetation heterogeneity and intensive anthropogenic activities, as in Brazil, with vast territorial extensions, diversity of phytophysiognomies and recurrent anthropogenic and natural land cover changes.
2. Material and Methods
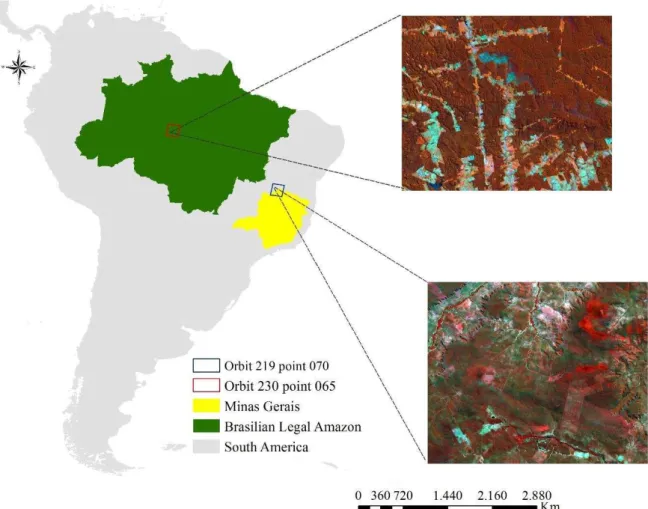
Figure 1 shows two study areas. The first one includes an area of Brazilian Savanna located in the Northwest of Minas Gerais State, subject to recurrent changes in land cover due to anthropogenic and natural causes. The predominant vegetation physiognomies are “Cerrado Senso Restrito”,
“Campo Cerrado”, and “Veredas” (Scolforo and Carvalho, 2008). The climate is classified as rainy
tropical - Awiq, with temperatures higher than 18ºC all year round, average annual precipitation of 1000 mm, and severe droughts in the winter (Sparovek, 2007).
Figure 1: Location of the areas studied and dated 2000 RGB images
The second study area is located in the margins of BR 230 Transamazon, in the South of Amazonas State in the county of Apuí, region characterized by intensive exploratory activity and dominance of livestock. The predominant vegetation is the Amazon Forest. The climate of the region is Amw, with high incidence of rain from December to May, and temperatures varying between 20 and 38°C throughout the year (Sparovek, 2007).
bands 1, 2, 3, 4, 5 and 7, as well as the NDVI, the vegetation index that is most used for vegetation studies (Cohen et al., 2003).
In order to ensure that information referring to the changes in the three dates was captured, multidate segmentation was performed using the algorithm Multiresolution Segmentation. In this algorithm, similar adjacent pixels are grouped according to their shape and homogeneity. Each segmented part of the image is called an object and has size, shape and spatial location (Hay et al., 2005).
The Multiresolution Segmentation algorithm is based on four different criteria: scale (determines the maximum heterogeneity contained in objects), color (defines the contribution of spectral values to determine the homogeneity), softness (used to define objects that have softer edges) and compactness (used to target objects with well-defined edges) (Woodcock et al., 1994).
Equal weights were used for bands 1, 2, 3, 4, 5 and 7 of Landsat 5 / TM for the years 2000, 2006 and 2010 in each area. This methodology ensures that the information concerning the changes in different dates are contemplated, for example, if in 2000 there was an area of native vegetation, and in 2006 part of this vegetation is removed, segmentation will provide two objects: the first with the information of the native vegetation and the second with deforestation information.
As the two study areas have different vegetation features and background, tests were conducted to determine the best parameters to segment each area. The scale of values, shape and compactness adopted for the Forest area were respectively 50, 0.3 and 0.6. For the Savannah area, the best results was obtained by creating multiple levels of objects, where the segmentation uses image objects of the next lower level to form larger objects. This is used to maintain the outline of the previous level objects. The shape and compactness values adopted at all levels was 0.3 and 0.6 respectively. The scale values were 60, 80, 90, 100, 120, 140, 160, 180 and 190, used for the 9 levels, respectively.
The quality of segmentation was evaluated through visual analyses considering the form and size of the objects and their correspondence with the real surface features.
As the considered study areas have distinct vegetational characteristics, where in the Amazon Forest the trees form a uniform coverage, and in the Brazilian Savanna the heterogeneous formations cover from “Cerrado Típico” to “Campo Limpo”, tests were realized with and without applying masks in anthropic areas in the first date considered in order to evaluate the effect of variability influence of data in change detection by the methods tested.
For this, an automatic image classification of the images from 2000 and 2006 was realized in two types of land cover: (1) areas covered by remaining native vegetation, and (2) anthropogenic areas, which include farming, bare soil and water bodies. After the classification, a visual correction of the images classified was realized.
Besides, in order to obtain the temporary spectral signatures, the mean (M) and standard deviation (S) of each object that make the images in each study were extracted, and the calculation for Distance of Mahalanobis was done to determine the position of the object, and quantify the distance to the center of object cluster (Bontemps et al., 2008; Desclée et al., 2006).
The Distance of Mahalanobis is a measure of the distance between points used for classification problems, pattern recognition or discriminant analysis (Krishnaswamy et al., 2009). Differently from the Euclidian distance, it takes into consideration the position of the object, see Equation1.
Where, DM is the Distance of Mahalanobis; Xij is the vector of temporal spectral signature for each object; mj is the mean vector Xij; Σj-1is the inverse of the covariance matrix.
Assuming an homogeneous distribution of the objects, those that are more distant from the center of the objects cluster can probably be of interest to change detection. For identifying these objects, a threshold T was used, see Equation 2.
Where, P is the probability; DM is the Distance of Mahalanobis; T is the threshold considering the value of chi-square distribution with 2n degrees of freedom and confidence level of (1-α).
When determining the confidence level of 1-α, it is possible to obtain the T threshold associated with P probability. The values that exceeded the threshold were considered as change objects and removed. In order to obtain finer adjustments, the cutting process was realized in an iterative way, which each time that change objects were identified, a new DM was calculated and a new cutting realized. This process was iterated until new change objects were not found anymore.
Two statistical approaches were tested, despite having followed the same processing flow, there are two main points that differ them. The first one is in the data used. While the first one used as input data the bands differences between dates and NDVI difference (Desclée et al., 2006), the second approach uses its own reflectance values of the bands and NDVI (Bontemps et al., 2008).
The second point of differentiation between both approaches refers to the construction of temporal signature. In the first approach the mean pixels values in the objects (M), and standard deviation (S) form the vector (Desclée et al., 2006), where i represents the objects; j the images difference, and b the number of bands used, see Equation 3.
On the other hand, the second approach, the vector of temporal signature is composed by the average pixels values in the objects (Bontemps et al., 2008), where i represents the objects; j the dates considered, and b the number of bands used, see Equation 4.
In order to validate the objects identified as change by the approaches of Bontemps et al., 2008
and Desclée et al., 2006, a visual identification of change objects was performed.
In the validation of the change detection by the approaches tested, the objects were classified in four types for constructing the Receiver Operating Characteristic (ROC) Curve (Hand and Till, 2001; Fawcett, 2006; Pietraszek, 2007), and determination of the efficiency of the change detection approaches: - True positive (TP): objects identified by the analyst and by the algorithm as change; - False positive (FP): objects identified as change by the algorithm, but they were not identified as such by the analyst; - False negative (FN): objects identified by the analyst as change, but not by the algorithm; - True negative (TN): objects were not identified as change by both, the analyst and the algorithm.
The ROC curve was used in order to register the answers of both approaches through sets of bands and confidence levels tested for each area. Its composition considers the sensitivity (S), calculated based on the true positive object values (TP) and false negative (FN): S=TP/(TP+FN), and specificity (E), obtained from equation E = 1-(FP/(FP+TN)), where FP refers to false positive objects and TN to true negative objects (Hajian-Tilaki, 2013).
T) P(DM (2 )) 1
P(DM X12 n (2)
) ,..., , ,...,
( ij1 ijb ij1 ijb
ij M M S S
X (3)
) ,..., ( ij1 ijb
ij M M
Thus, in this study 64 different tests were performed for each study area: (1) two approaches based on stochastic analysis (Desclée; Bogaert, Defourny, 2006) and (Bontemps et al, 2008), (2) the efficiencies of these approaches when applied to all image objects and when applied only to objects classified as remaining native vegetation, (3) the influences of different combinations of bands and spectral indices and (4) the influence of different levels of statistical confidence as illustrated in Figure 2.
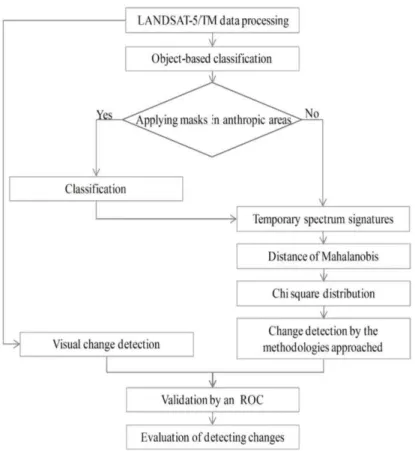
Figure 2:Simplified histogram of analysis performed in this study.
The whole process adopted for identifying changes in both study areas is illustrated in the flowchart of Figure 3.
3. Results
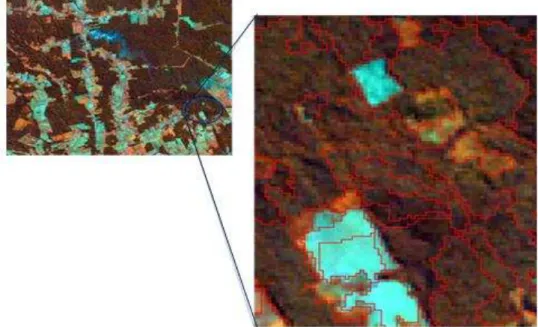
There were 2736 objects segmented for the study area of the Amazon rainforest and 7902 objects for the Savannah. Figures 4 and 5 show the segmentation was assessed qualitatively by visual analysis.
Figure 4: Example deforestation objects (light blue) obtained by multidate segmentation in the Amazon area of study.
Figure 5: Example of burning objects (navy blue) and scar burned (light pink) obtained by
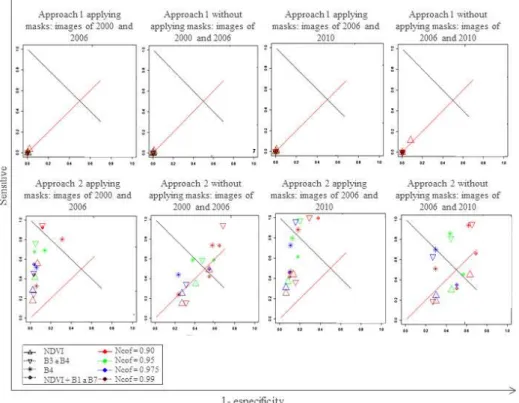
Figures 6 and 7 show the results obtained when applying methodology 1 (input data = image difference and Xij (Mij1,...,Mijb,Sij1,...,Sijb) were insensitive for all the tests done. A low percentage of true positive objects and false positive objects for the area of Forest and Savanna were found, diverging from the result obtained by Desclée et al. (2006) in the application of similar methodology for change detection in a temperate forest in Western European.
Figure 6: Receiver Operating Characteristic (ROC) Curve referring to the Amazon Forest area
On the other hand, approach 2 (input data = image and Xij (Mij1,...,Mijb)was sensitive to change detection in land cover in the areas of Amazon Forest, corroborating with the result obtained by Bontemps et al (2008), and in areas of Brazilian Savanna.
The methods were affected by the heterogeneity of the input data. The use of masks to focus the analysison land cover classes of interest, is a good practice for change detection not only for areas with higher variability, such as the Savanna area, but also for areas with more homogeneous land cover pattern, such as the Amazon area.
Corroborating with Bontemps’s et al. (2008) work, the application of approach 2 showed gains in
the use of different confidence levels for selecting change objects. Sensitivity was also observed in relation to the use of different reflectance data and vegetation indices, once the spectral behavior of the targets is different bands.
In Figures 6 and 7, the most satisfactory results are located in the extreme left of the ROC Curve space, above the bisector, where higher percentage of true positive and lower percentage of false positive is identified.
The most satisfactory results for the area of Forest, which are those with higher sensitive and lower (1- specificity) of data were found with the use of Bands 3 and 4, and confidence level of 0.90. 94,67% of true positive objects and 5,33% of false negative objects were obtained. Of the total objects obtained, 6,46% was false positive.
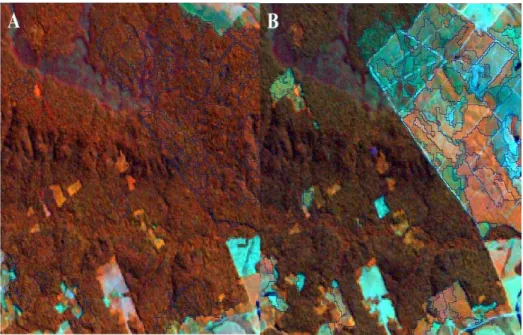
The Figure 8 shows a subset of the study area regarding the Forest area to detect changes through the application of the approach 2, where the blue lines are the true positive and the red lines are the false negative objects.
Figure 8: Detail of changes occurred between 2006 (A) and 2010 (B) identified by applying the approach 2 with Band 3 and 4, and a confidence level of 0.90.
due to the vast natural variability of vegetation, which is intensified by deciduousness, and the anthropogenic action in the area caused by recurrent focal points of deforestation and fires.
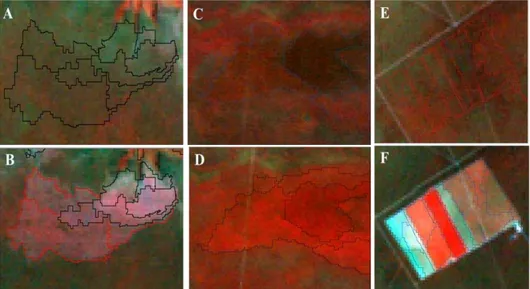
Figure 9 illustrates three examples in the detection of change by applying the second approach to bands 3 and 4 and 0.975 confidence level for the Savannah study area. The first row shows images before change events and the second row shows images after change occurrence. In subset B, black objects represent true positive changes and red objects represent false negative changes. In subset D it is illustrated the deciduousness of the vegetation detected as changes that have not been focus of study in this work. In subset F, it is illustrated the true positive objects.
Figure 9:Detail of changes occurred between 2000 (A) and 2010 (B) identified by applying the
approach 2 with Band 3 and 4 with input and confidence level 0.975.
Despite the intention of creating vegetation indices, such as the NDVI, highlighting the spectral vegetation behavior in relation to the soil and the other targets, depending on the objective of study, the operation of data normalization for the creation of the index can interfere negatively in the results. In this study, it was observed that bands 3 and 4 had a better result when compared to the use of the NDVI as input data.
4. Conclusions
1. The application of the approach 2 was satisfactory for change detection in areas of Forest and Savanna. Sensitivity was identified in relation to the input bands tested, where the best results were obtained using Landsat 5/TM bands 3 and 4, and the confidence levels 0.90 and 0.975 for the areas of Forest and Savanna, respectively.
2. The use of masks in the objects of non-vegetation of the first date provided better change detection results in both study areas.
3. The tests performed with the approach 1 were insensitive to change detection in the tested areas.
ACKNOWLEDGEMENT
To the Coordination of Improvement of Personal Higher Education (Capes) for granting the scholarship.
REFERENCES
Blaschke, T. Object based image analysis for remote sensing. Journal of Photogrammetry and Remote Sensing, Falls Church, v. 65, n. 1, p. 2–16, 2010.
Bontemps, S.; Bogaerta, P.; Titeuxb, N.; Defourny, P. An object-based change detection method accounting for temporal dependences in time series with medium to coarse spatial resolution. Remote Sensing of Environment, New York, v. 112, n. 6, p. 3181–3191, 2008.
Pietraszek, T. On the use of ROC analysis for the optimization of abstaining classifiers. Mach Learn, v. 68, n. 2, p. 137–169, 2007.
Carvalho, F.; Marco Júnior, P.; Ferreira, L. The Cerrado into-pieces: habitat fragmentation as a function of landscape use in the savannas of central Brazil. Biological Conservation, Essex, v. 142, n. 7, p. 1392–1403, 2009.
Cohen, W. B.; Maierspergerb, K. T.; Gowerc, S. T.; Turnerb, D. P. An improved strategy for regression of biophysical variables and Landsat ETM+ data. Remote Sensing of Environment, New York, v. 84, p. 561–571, 2003.
Concheda, G.; Durieux, L.; Mayaux, P. An object-based method for mapping and change analysis in mangrove ecosystems. ISPRS Journal of Photogrammetry & Remote Sensing, Amsterdam, v. 63, p. 578–589, 2008.
Coppin, P.; Jonckheere, I.; Nackaert, K.; Muys, B.; Lambin, E. Digital change detection methods in ecosystem monitoring: a review. International Journal of Remote Sensing, Basingstoke, n. 25, n. 9, p. 1565–1596, 2004.
Desclée, B.; Bogaert, P.; Defourny, P. Forest change detection by statistical object-based method. Remote Sensing of Environment, New York, v. 102, n. 1/2, p. 1–11, 2006.
Fawcett, T. An introduction to {ROC} analysis. Pattern Recognition Letters, Amsterdam, v. 27, n. 8, p. 861–874, 2006.
Hajian-tilaki, K. Receiver Operating Characteristic (ROC) curve analysis for medical diagnostic test evaluation. Caspian Journal of Internal Medicine, Babol, v. 4, n. 2, p. 627-635, 2013.
Hand, D. J.; Till, R. J. A simple generalization of the area under the ROC curve to multiple class classification problems. Machine Learning, Boston, v. 45, p. 171–186, 2001.
Hay, G. J.; Gastilha, G.; Wulder, M. A.; Ruiz, J. R. An automated object-based approach for the multiscale image segmentation of forest scenes. International Journal of Applied Earth Observation and Geoinformation, Enschede, v. 7, n. 4, p. 339–359, 2005.
Hussain, M.; Chen, D.; Cheng, A.; Wei, H.; Stanley, D. Change detection from remotely sensed
images : from pixel-based to object-based approaches. ISPRS International Journal of Remote
Sensing, Basingstoke, v. 80, p. 91–106, 2013.
Klink, C.; Machado, R. A conservação do cerrado brasileiro. Megadiversidade, Belo Horizonte, v. 1, n. 1, p. 147-155, 2005.
Krishnaswamy, J; Bawa, K. S.; Ganeshaiah, K, N.; Kiran, M. C. Quantifying and mapping biodiversity and ecosystem services: Utility of a multi-season NDVI based Mahalanobis distance surrogate. Remote Sensing of Environment, New York, v. 113, n. 4, p. 857–867, 2009.
Nagendra, H.; Lucas, R.; Honrado, J. Remote sensing for conservation monitoring: Assessing protected areas, habitat extent, habitat condition, species diversity, and threats. Ecological Indicators, Kiel, v. 33, p. 45–59, 2013.
Scolforo, J.; Carvalho, L. M. T. Mapeamento e inventário da flora nativa e dos Reflorestamentos de Minas Gerais. Lavras: UFLA, 2008.
Sparovek, Q.; Lier, Q. J. V.; Dourado Neto, D. Computer assisted Koeppen climate classification: a case study for Brazil. International Journal of Climatology, Malden, v. 27, p. 257-266, 2007.
Woodcock, C. E.; Collins, J. B.; Gopal, S.; Jakabhazy, V. D.; LI, X.; Macomber, S.; Ryherd, S.; Harward, V. J.; Levitan, J.; Wu, Y.; Warbington, R. Mapping forest vegetation using Landsat TM imagery and a canopy reflectance model. Remote Sensing of Environment, v. 50, n. 3, p. 240–254, 1994.
Recebido em 13 de março de 2016.