Efficiency of LH+EC Current Drive in Tokamaks
Featuring an Internal Transport Barrier
P. R. da S. Rosa1, L. F. Ziebell2, C. I. de Oliveira2, G. N. Jardim1, and A. K. Bonfim1 1Departamento de F´ısica, UFMS, Caixa Postal 549, 79070-900, Campo Grande, MS, Brazil
2Instituto de F´ısica, UFRGS, Caixa Postal 15051, 91501-970, Porto Alegre, RS, Brazil
Received on 27 May, 2005
In the present paper we study the effects due to the occurrence of radial transport of particles in a tokamak on the efficiency of current drive due to combined action of lower hybrid waves and electron cyclotron waves, in the presence of an internal transport barrier. The results are obtained by numerical solution of the Fokker-Planck equation which rules the evolution of the electron distribution function. We assume that the radial transport of particles can be due to magnetic or to electrostatic fluctuations, and compare the two situations. In both cases the efficiency of current drive is shown to increase with the increase of the fluctuations which originate the transport. The current drive efficiency is shown to depend weakly on the radial position of the barrier, with a slightly more pronounced dependence in the case of magnetic fluctuations.
I. INTRODUCTION
It is nowadays well established that plasmas in tokamaks may feature regions of reduced transport known as transport barriers (TB). These TB may occur either near the plasma edge, when they are denoted as ETB, from edge transport bar-rier, or in more internal regions, when they are denoted as ITB, from internal transport barriers (ITB’s). In both cases, the TB’s are characterized by localized and significant reduc-tion of the transport coefficients for particles, heat and mo-mentum. Due to the presence of the barrier, accumulation of particles and energy is expected to occur in the region inter-nal to the barrier, with the corresponding increase in confine-ment time. The detailed mechanisms leading to the formation of TB’s, particularly to the formation of ITB’s, are not com-pletely understood, but for the purposes of the present paper it is sufficient to know that they appear in plasmas subject to a variety of heating schemes: ohmic, lower hybrid, ion cy-clotron, electron cycy-clotron, and neutral beam injection [1–3].
In this paper we intend to discuss the effect of radial par-ticle transport, in the presence of an ITB, on the efficiency of current drive generated by the combined effect of lower hybrid (LH) and electron cyclotron (EC) waves in tokamaks. The investigation utilizes quasilinear theory in order to fol-low the time evolution of the electron distribution function, using a slab geometry to describe the tokamak. Density and temperature modifications which may occur due to the radial transport are taken into account. Two different mechanisms causing radial transport will be considered, the electrostatic transport, which is expected to be more effective on low ve-locity particles, and the transport of magnetic origin, which is expected to be more active on high velocity particles. Al-though taking into account radial particle transport, we will be interested in the study of situations in which the loss of par-ticles at the plasma edge can be considered negligible, moti-vated by the existence of experiments such those performed at the DIII-D tokamak [4], and such those with double transport barrier performed at the Alcator C-Mod tokamak [2]. Other current drive experiments featuring negligible loss of fast par-ticles have also been realized in JT60U, under conditions very similar to those assumed in the present paper, with
extrapo-lation to ITER conditions indicating even smaller fast particle losses [5]. In order to implement such conditions of good con-finement, we assume Neumann boundary conditions in our numerical calculations, which guarantee zero particle flux at the edge. In experiments where such conditions of good con-finement typical of H-mode concon-finement are not satisfied, the loss of particles at the plasma edge may play significant and deleterious role on the current drive efficiency [6].
The present paper is related to two previous investigations which have been published as Ref. [7] and Ref. [8]. Ref. [7] had objectives similar to those of the present paper, both investigating the effect of radial transport and of the occur-rence of ITB’s on the combined current drive efficiency due to LH and EC waves. However, in Ref. [7] the propagation of LH waves was described by a cruder model, if compared with the model employed in the present investigation and also employed in Ref. [8], which considered the case of current generation by LH waves alone. According to the present more detailed model of LH propagation, the LH waves do not arrive to regions of the tokamak in which they could be present with the previous model. Significant differences occur in the pro-files of LH power absorption and generated current, and there-fore the effects of transport and of the presence of the ITB may be significantly modified, as demonstrated in the case of cur-rent drive with LH waves [8]. Another difference between the approach of Ref. [7] and that of the present paper is that in Ref. [7] the only kind of transport considered was of mag-netic origin, while in the present paper we compare transport of magnetic and of electrostatic origin. The effects of trans-port, either magnetic or electrostatic, and of the ITB on the current drive by combined effects of LH and EC waves, under the conditions prescribed by an improved model describing LH waves, constitutes the main motivation for the present in-vestigation.
II. THE FOKKER-PLANCK EQUATION AND THE NUMERICAL SCHEME
We start with a Maxwellian distribution function and solve the Fokker-Planck equation obtained from quasilinear theory. If we take into account LH and EC waves, collisions, and par-ticle transport, the Fokker-Planck equation is written symbol-ically as follows
∂τf = (∂τf)LH+ (∂τf)EC+ (∂τf)col+ (∂τf)t (1) where the subscripts in the right-hand side denote, from the left to the right, the effect of LH and EC waves, collisions and particle transport. f = f(u,µ,s,τ)is the electron distribution function,τis the time normalized to the collision time at the center of the slab,uis the electron momentum normalized to the central thermal momentum atτ=0,µ=cosθis the cosine of the pitch angleθ, ands=x/ais the radial coordinate along the direction perpendicular to the ambient magnetic fieldB0= B0ez, normalized to the minor radiusa.
The term related to LH waves may be given as follows, (∂τf)LH=∂u||
³
DLH∂u||f´ (2)
whereDLH is the diffusion coefficient in momentum space, and parallel means the direction parallel to the equilibrium magnetic field. The explicit expression for the coefficientDLH can be found in the literature and will not be repeated here, for the sake of economy of space [8–10]. The important point is that the LH diffusion coefficient depends on the quantity S(s,τ,Nk), which represents the spectrum of the energy flux for LH waves. It is evaluated as follows. We assume
S(s,τ,Nk) = ½
S0 N1≤Nk≤N2
0 Nk<N1,Nk>N2, (3) whereS0is the intensity of LH waves at positionsat timeτ, andN1, N2 are the limits of the LH spectrum at each point in the slab. N1 is the maximum between the lower caustic and the value ofNkobtained from the accessibility condition defined by the coupling point between fast and slow modes. N2is the minimum between the upper caustic andNkL, which is a limitation due to Landau damping, approximately given bynL/√Te, wherenL≃6−7. Due to the Landau resonance condition, there is a corresponding range of parallel velocities where the particles are in resonance with the waves. In order to avoid discontinuities which can be deleterious to the numer-ical solution, at the edges of the resonant region the diffusion coefficient connects to the adjacent non-resonant region in ve-locity space by means of Gaussian ramps whose half-width is the local thermal velocity [11].
These limits of the LH spectrum inNk-space are obtained from a well known propagation model which assumes sev-eral back and forth trips of the LH waves before complete absorption due to Landau damping [8, 11, 12]. The use of this propagation model is one of the main differences between the investigation developed in the present paper and the approach adopted in Ref. [7].
The quantity S0 appearing in Eq. (3) can be obtained considering that, due to the fast movement of the electrons
on the magnetic surface, the energy acquired by the elec-trons when passing through the region affected by the wave is rapidly spread to all the magnetic surface, and the aver-age LH intensity at each magnetic surface can be given by PLH(s,τ)/(4π2|s|aR), and where
PLH(s,τ) =PLH(a) µ
1−4π2Ra2 Z s
1
ds′s′ρLH(s′,τ) 
, (4)
with
ρLH(s,τ) =1.5×10⁻¹⁶Te0νe0
Z d3uu
2
2 (∂τf)LH , being the density of absorbed LH power at each position in the slab, and whereνe0is the collision frequency at the plasma center. The numerical constants are such that the units ofρLH are W/cm3. A similar quantity,ρEC(s,τ), can be defined for the density of absorbed EC power at each position, depending on the term(∂τf)EC.
The EC term, calculated for each slab position, can be writ-ten as
(∂τf)EC = 1 u⊥
µ
yl∂u⊥+√u⊥ µe0
∂ukn|| 
×
· u⊥DEC
µ
yl∂u⊥+n||√u⊥ µe0∂uk
¶ f
¸
. (5)
In this equationn||=n||(s)is the parallel wave number cor-rected for refraction effects along propagation,
n||(x) =n0 R0+a R0+sa
,
The spectrum is assumed to be Gaussian at the edge, and takes into account absorption self-consistently evaluated along the trajectory,
PEC(s,τ,Nk) =√PECπ∆n(a)
k
e− (nk−n¯k)2
(∆nk)2
×exp µ
−2ωECa
2
c Z s
1
ds′n′′⊥(s′) 
, (6)
wherePEC(a)is the EC power delivered by the antennas at the plasma edge, ¯nkis the parallel refraction index of the cen-tral ray of the wave packet, andn′′⊥ is the imaginary part of the perpendicular wave number, obtained from the dispersion relation for EC waves. Details upon the procedures for calcu-lation of the components of the dielectric tensor and for the numerical solution of the dispersion relation can be found in the literature [14, 15].
The effect of collisions is introduced by the third term in the right-hand side of equation (1). We have used a linearized form which describes the interaction of fast electrons with body electrons and ions, for each slab position, which is also well-known and therefore will not be repeated here [7].
The last term in the right-hand side of equation (1) de-scribes the transport of particles and has the following general form
(∂τf)t=∂s(D∂sf), (7) Dbeing the particle diffusion coefficient, which can be given as follows [16–20],
D=Dm+De=2πqRνe 0c 0
Ã
|uk|
γµ1/2 e0
eb2+γµ 1/2 e0
|uk| ee
2 !
(8)
whereDmis the contribution to transport due to magnetic fluc-tuations, andDeis the contribution to transport when electro-static fluctuations are present. For the numerical solution, we have assumed that the term due to electrostatic fluctuations goes smoothly to zero for|uk|well below the lower limit of the range of parallel velocities resonant with the LH and EC waves, therefore avoiding the divergence at|uk|=0 which ap-pears in Eq. (8). The quantitieseb≡(B/B0)andee≡(E/cB0) give, respectively, the magnetic and electrostatic perturbation level of turbulence, normalized to the magnitude of the lo-cal ambient magnetic field,B0(s). γis the relativistic factor, and the quantityqis the safety factor, assumed to be constant along the time evolution. This hypothesis is justified since the evolution occurs in the kinetic time scale, while experimental data show that the changes in theqprofile occurs in a longer time scale, of order of seconds [1, 21].
The safety factor q is simulated in the present study by a parabolic profile which has its minimum value at position s=0.5, half-way between the center of the plasma and the plasma edge, as shown in Fig. 1b of Ref. [7]. It simulates the reversedq profiles typically found in situations where there is ITB formation, since it has been found that these barriers
form close to the position of the minimum of theq profile [1, 22, 23]. In fact, recent studies indicate that the ITB usually occurs at the position of minimumq or closer to the plasma center, but this is not an absolute restriction [3]. Therefore we consider in the numerical solution the canonical case in which the center of the ITB occurs at the position of the minimum q, but we also consider some cases where the barrier is dis-placed either toward the plasma center or toward the plasma edge, when investigating the effect of barrier position on the current drive efficiency.
The ITB is simulated by assuming that the level of mag-netic (or electrostatic) turbulence is uniformly equal toeb0(or e
e0) everywhere except in the barrier region, where it is re-duced down to a minimum value αeb0 (or αee0). The bar-rier is centered at s=sb, with nondimensional half-width β=0.15. Specifically, we assume a parabolic reduction of the magnetic turbulence level at the barrier position (for sb−β<s<sb+β), such thateb=eb0
¡
a1+a2s+a3s2 ¢
and e
e=ee0¡a1+a2s+a3s2¢, where the ai are constants [7]. As boundary conditions of the barrier region in the case of mag-netic fluctuations we assumeeb=eb0ats=sb±βandeb=αeb0 ats=sb. In the case of electrostatic fluctuations, similarly, we assumeee=ee0ats=sb±βandee=αee0ats=sb. The resulting profile of magnetic and electrostatic turbulence is the same as the profile of magnetic turbulence which can be seen in Fig-ure 1a of Ref. [7], for several values ofαandβ=0.15. The model describes a situation where an ITB is already formed when RF waves are injected in the plasma in order to generate current. Modifications on the barrier profile due to RF waves are not taken into account in this scenario.
For the magnetic field, initial density and temperature pro-files we make use of the following expressions
B0(s) = B0(0)³1+sa R
´−1 ;
ne(s,τ = 0) = (ne0−nea)(1−s2) +nea; Te(s,τ = 0) = (Te0−Tea)
¡
1−s2¢2+Tea,
where the indexes 0 andaindicate, respectively, values taken at the plasma center and plasma edge. Along the time evolu-tion the density and the temperature are updated at each col-lision time, to take into account modifications in the profiles caused by radial transport.
III. NUMERICAL RESULTS
For the numerical analysis, we assume the following para-meters, typical of medium-size tokamaks, chosen in order to guarantee total LH power absorption, for the assumed profiles: ne0=6.0×10¹⁹m−3,Te0=3.0 keV,B0(0) =2.65 T,a=0.2 m,R=1.0 m. For the LH waves, we considerPLH(a,t) =0.5 MW, and chooseNk0=2.3 and fLH =3.37 GHz. For most of the applications, unless explicitly stated, we usesb=0.5, α=0.125 andβ=0.15.
As we have already discussed, at each point in the slab there is a range of values of the parallel refraction index which is available to the LH waves, limited byN1andN2. There is a corresponding range of resonant velocities, which can be seen, for instance, in Fig. 1 of Ref. [8], for the parameters listed in the previous paragraph, as a function of position inside the slab. The range of resonant velocities is position-dependent, although nearly uniform in a significant part of the slab. For instance, for the parameters listed in the previous paragraph, the resonant velocities nearly span the range betweenuk≃3.3 anduk≃6.0, in the region of the slab where most of the LH wave power is deposed, arounds≃0.5 [8].
For the EC waves, we consider the extraordinary mode, with frequency fEC=140 GHz, injected at an angleψ=20◦ relative to the perpendicular to the ambient magnetic field, with∆ψ=3◦as the half-width of the spectrum. As a con-sequence, ¯nk=sinψ≃0.342, and ∆nk≃0.052 . For most of the applications, unless explicitly stated, we usePEC=0.5 MW.
Fig. 1(a) shows the density ofLHandECpower absorbed as a function of position in the plasma slab, atτ=80, for the case of magnetic transport witheb0=3.0×10⁻⁵andee0=0.0, and barrier depth given byα=0.125. It is also shown the density of LH power atτ=50 and atτ=0, for the same case. The curve forτ=50 shows that at the end of the LH phase the LH power is mainly deposed near the positions=0.4, slightly displaced toward the plasma edge as compared to the initial profile of deposition. Atτ=80, the deposition of LH waves has moved further outward, toward the positions=0.5, with the profile slightly broadened when compared to the situation atτ=50. The EC absorption occurs in a region narrower than the LH absorption, around positions≃0.45.
Fig. 1(b) shows curves corresponding to those of Fig. 1(a), but obtained considering the absence of the ITB. The results displayed in panel (b) of the figure are very similar to those of panel (a), with the only difference that the profiles of LH ab-sorption atτ=50 and atτ=80 are very slightly more broad-ened in the case of absence of barrier than in the case with the barrier.
Fig. 1(c) shows curves corresponding to those of Figs. 1(a) and 1(b), but obtained ignoring the effect of transport. We observe that the peak of LH absorption is moved outward be-tweenτ=0 andτ=50, even in the absence of transport. This occurs due to the formation of the electron tail in the electron distribution and the consequent modification of the absorption of the wave. This process has already attained steady state atτ=50, and is not affected by EC waves, since the curves for LH absorption atτ=50 andτ=80 are nearly the same.
However, when comparing the case without transport shown in Fig. 1(c) with the cases with transport shown in Figs. 1(a) and 1(b), we observe that the effect of transport is revealed in the broadening of the LH profile. The presence of transport also allows for synergy effects between LH and EC waves, re-vealed by the slight modification in the LH absorption profile which occurs betweenτ=50 andτ=80, appearing in Figs. 1(a) and 1(b).
0 1 2 3 4 5 6
-1 -0.5 0 0.5 1
ρ
(MW/m
3 )
s (a)
LH,0.0 LH,50 LH,80 EC,80
0 1 2 3 4 5 6
-1 -0.5 0 0.5 1
ρ
(MW/m
3)
s (b)
LH,0.0 LH,50 LH,80 EC,80
0 1 2 3 4 5 6
-1 -0.5 0 0.5 1
ρ
(MW/m
3)
s (c)
LH,0.0 LH,50 LH,80 EC,80
FIG. 1:ρLH andρECvss, forPLH(a,t) =0.5 MW andPEC(a,t) =
0.5 MW. (a) The case of magnetic transport,eb0=3.0×10⁻⁵ and
e
e0=0.0. The ITB is located atsb=0.5, withα=0.125, andβ=
0.15. (b) The case of magnetic transport,eb0=3.0×10⁻⁵andee0=
0.0, without the presence of the ITB. (c) The case without effects of
transport. The curves shown in each panel are:ρLH atτ=0.0 (thin
dashed line);ρLHatτ=50.0 (thin line);ρLHatτ=80.0 (thick line);
ρECatτ=80.0 (thick dotted line). The parameters are characteristic
of a medium size tokamak. ne0=6.0×10¹⁹ m−3,Te0=3.0 keV, B0(0) =2.65 T,a=0.2 m,R=1.0 m. For the LH waves,Nk0=2.3,
Fig. 2 shows the current densityJvs position in the plasma slab s, for several values ofτ. Panel (a) shows the case of magnetic transport witheb0=3.0×10⁻⁵andee0=0.0, panel (b) shows the case of electrostatic transport with eb0=0.0 andee0=0.5×10⁻⁵, and panel (c) the case without transport. Other parameters are the same as in Fig. 1. It is noticeable the fast increase of current density after the onset of EC waves, which occurs atτ=50. It is also noticeable in panels (a) and (b) the spread of the profile of current density due to the radial transport, when compared with the case without transport in panel (c).
The spread is slightly more pronounced in the case of mag-netic transport, panel (a), than in the case of electrostatic trans-port, panel (b). In both cases, magnetic transport and electro-static transport, the position of the peak of current density is not noticeable moved by the introduction of EC waves, and is not moved by the effect of transport. A rough quantitative analysis can be as follows. In the case without transport, de-picted in panel (c), the peak of current density at τ=80 is nearly 6.1/3.7≃1.65, or 65 % higher than the peak at the end of the LH only phase, atτ=50. Taking into account the ef-fect of transport of magnetic origin, as in panel (a), significant spread occurs, but the ratio between the peaks of current den-sity atτ=80 and atτ=50 remain nearly the same, given by 4.5/2.8≃1.61. In the case of electrostatic transport, shown in Fig. 2(b), the peak of current density atτ=80 is nearly 4.9/3.1≃1.58, or 58 % higher than the peak at the end of the LH only phase, atτ=50. The peaks are higher than the corresponding peaks in panel (a), obtained in the case of mag-netic transport, and one notices less spread toward the plasma edge. It appears that the electrostatic transport at this turbu-lence level is less efficient in spreading the profile of LH cur-rent density than the magnetic transport. The reason is that the magnetic transport is more effective for high-energy particles than the electrostatic transport, according to the model uti-lized. The magnitudes of the electrostatic and magnetic fluc-tuation levels assumed for Figs. 2(a) and 2(b) are within the range of experimental values [20, 24, 25], and have already been utilized in a previous analysis on transport effects on LH current generation [8].
Fig. 3(a) shows the current generated as a function of time, displaying the case without transport and the cases of mag-netic transport, witheb0=3.0×10⁻⁵andee0=0.0, and elec-trostatic transport, witheb0=0.0 andee0=0.5×10⁻⁵. It is seen that the presence of transport contributes to the increase of the generated current. It is also seen that the effect of elec-trostatic transport on the generated current is remarkably sim-ilar to the effect of magnetic transport. In Fig. 3(a) and in many of the following figures, the case of magnetic transport is indicated by MG, and the case of electrostatic transport is indicated by ES.
The efficiency of current drive may be measured by the nondimensional parameter
η=33 |I|Rnave
(PLH+PEC)Tave , (9) wherenave is the electron density expressed in units of 1020 m−3, averaged along the radial coordinate, andTave is the
0 1 2 3 4 5 6 7
-1 -0.5 0 0.5 1
J
(A/m
2 )
s (a)
50 80
0 1 2 3 4 5 6 7
-1 -0.5 0 0.5 1
J
(A/m
2 )
s (b)
50 80
0 1 2 3 4 5 6 7
-1 -0.5 0 0.5 1
J
(A/m
2 )
s (c)
50 80
FIG. 2:Jvssfor several values ofτ. The lines show the values of
Jatτ= 10, 20, 30, 40, 50, 60, 70, and 80. (a) The case of
mag-netic transport witheb0=3.0×10⁻⁵; (b) The case of electrostatic
transport withee0=0.5×10⁻⁵; (c) the case without transport. Other
parameters are the same as in Fig. 1.
electron temperature expressed in keV, also averaged along the radial coordinate [26].
with--140 -120 -100 -80 -60 -40 -20 0
0 10 20 30 40 50 60 70 80
I
(A)
τ (a)
0.0,0.0 MG,3.0e-5,0.0 ES,0.0,0.5e-5
0 0.2 0.4 0.6 0.8 1 1.2 1.4 1.6
0 10 20 30 40 50 60 70 80
η
τ (b)
0.0,0.0 MG,3.0e-5,0.0 ES,0.0,0.5e-5
FIG. 3: (a) CurrentI vs. normalized timeτ. (b) Current drive
ef-ficiencyηvs. normalized timeτ. The curves shown in each panel
are: the case without transport (thin line); magnetic transport, with
e
b0=3.0×10⁻⁵andee0=0.0 (thick line); electrostatic transport, with
e
b0=0.0 andee0=0.5×10⁻⁵(thick dotted line). Other parameters
are the same as in Fig. 1.
out transport. It is also seen that the effect of electrostatic transport on the efficiency of current drive is remarkably sim-ilar to the effect of magnetic transport. Although the current generated immediately increases after the start of EC waves, the overall efficiency decreases with the introduction of EC waves, comparing with the efficiency of the LH waves alone. After the sudden decrease which occurs at the onset of EC waves, the efficiency slowly increases again, but for the para-meters utilized do not attain the same level attained with the LH waves alone.
Fig. 4(a) shows the current drive efficiency η vs mag-netic fluctuation leveleb0 ranging fromeb0=0.0 up toeb0= 5.0×10⁻⁵, foree0=0.0, atτ=50 and atτ=80. Fig. 4(b) shows the current drive efficiencyηvs electrostatic fluctua-tion levelee0ranging fromee0=0.0 up toee0=1.0×10⁻⁵, for e
b0=0.0, atτ=50 and atτ=80. Other parameters are the same as in Fig. 1. Figs. 4(a) and (b) show that the electro-static turbulence withee0=1.0×10⁻⁵produces similar effect on the current drive efficiency as the magnetic turbulence with e
b0=5.0×10⁻⁵. Both in the cases of electrostatic and
mag-0.9 1 1.1 1.2 1.3 1.4 1.5 1.6 1.7
0 1e-05 2e-05 3e-05 4e-05 5e-05
η
b0
(a)
80,MG 50,MG
0.9 1 1.1 1.2 1.3 1.4 1.5 1.6 1.7
0 2e-06 4e-06 6e-06 8e-06 1e-05
η
e0
(b)
80,ES 50,ES
FIG. 4: (a) Current drive efficiencyηvs magnetic fluctuation level
eb0, foree0=0.0, atτ=50 (thin line) and atτ=80 (thick line). (b)
Current drive efficiencyηvs electrostatic fluctuation level ee0, for
eb0=0.0, atτ=50 (thin dotted line) and atτ=80 (thick dotted line).
Other parameters are the same as in Fig. 1.
netic transport, the efficiency atτ=80 is nearly 70% of the efficiency at the end of the LH phase, atτ=50. It is also seen that the dependence of the current drive efficiency on the tur-bulence level, in the range considered, is nearly the same in the cases of magnetic and electrostatic transport.
The increase of the current drive efficiency with the in-crease of the turbulence level may be explained by the follow-ing mechanism. Fast particles are radially moved towards less dense regions of the tokamak by effect of the transport. In these regions the slow-down time due to collisions is larger, therefore the level of generated current is increased.
In Ref. [8] we have verified the consistency of this explana-tion by considering a situaexplana-tion with different plasma densities, keeping the same profiles and all other parameters. The argu-ment can be illustrated with the results shown in Fig. 7 of Ref. [8], which shows that for increasing electron density the cur-rent drive efficiency is reduced. It also shows that the positive contribution of the transport to the current drive efficiency is more significant for smaller electron densities. Both findings are in accordance with the explanation given in the previous paragraph.
1 1.1 1.2 1.3 1.4 1.5 1.6
0.3 0.4 0.5 0.6 0.7 0.8
η
sb
80,MG 80,ES 50,MG 50,ES
FIG. 5: Current drive efficiencyηvs position of the transport barrier,
atτ=50 andτ=80; the two upper curves are foreb0=3.0×10⁻⁵
andee0=0.0 (thin line) and foreb=0.0 andee=0.5×10⁻⁵ (thin
dotted line), respectively, atτ=50. The lower curves are foreb0=
3.0×10⁻⁵andee
0=0.0 (thick line) and foreb=0.0 andee=0.5×
10−5(thick dotted line), respectively, atτ=80. Other parameters
are the same as in Fig. 1.
seen in Fig. 5, which shows the current drive efficiencyηvs position of the ITB, at τ=50 and τ=80. The two upper curves are foreb0=3.0×10⁻⁵andee0=0.0 and foreb=0.0 andee=0.5×10⁻⁵, respectively, atτ=50. The lower curves are for the same parameters, atτ=80. Other parameters are the same as in Fig. 1. It is seen that, both at the end of the LH phase and at the end of the phase with combined effect of LH and EC waves, the efficiency is a minimum forsb=0.6, in-creasing when the barrier is closer to the center of the slab and when the barrier is closer to the plasma edge. The explanation can be as follows. As seen in Fig. 2, the LH waves gener-ate current aroundsb=0.5. The radial diffusion toward the plasma edge tends to produce increase of the current. If the ITB is localized atsb≤0.5, it does not hinder very much the diffusion toward the edge, and the current indeed increases. If the ITB is localized nearsb=0.6, it stands in the way of the radial diffusion between the region of energy deposition of LH waves and more external regions, and consequently the efficiency of current generation is decreased. However, if the ITB is closer to the edge, its effect on the particle diffusion starts becoming less important, since significant diffusion al-ready occurred up to the position of the barrier. The efficiency of current generation may therefore increase by effect of the diffusion of particles froms≃0.5 toward the position of the barrier. Fig. 5 indicates that this effect of the position of the barrier is more pronounced in the case of magnetic fluctua-tions than in the case of electrostatic fluctuation, both atτ=50 and atτ=80. Regarding the effect of the position of the bar-rier, the combined action of LH+EC waves does not change appreciably the behavior observed with LH waves alone [8].
The effect of the barrier depth is investigated in Fig. 6, which shows the current drive efficiency ηvs α, parameter related to the depth of the ITB, atτ=50 andτ=80 (α=1
1 1.1 1.2 1.3 1.4 1.5 1.6
0 0.2 0.4 0.6 0.8 1
η
α
80,MG 80,ES 50,MG 50,ES
FIG. 6: Current drive efficiencyηvs depth of the transport barrier,
atτ=50 andτ=80 (the barrier depth decreases toward the right);
the two upper curves are foreb0=3.0×10⁻⁵andee0=0.0 (thin line)
and foreb=0.0 andee=0.5×10⁻⁵(thin dotted line), respectively, at
τ=50. The two lower curves are foreb0=3.0×10⁻⁵andee0=0.0
(thick line) and foreb=0.0 andee=0.5×10⁻⁵(thick dotted line),
respectively, atτ=80. Other parameters are the same as in Fig. 1.
represents the case without barrier). The two upper curves are foreb0=3.0×10⁻⁵ andee0=0.0 and foreb=0.0 and ee= 0.5×10⁻⁵, respectively, atτ=50. The lower curves are for the same parameters, atτ=80. Other parameters are the same as in Fig. 1. It is seen that the current drive efficiency is almost independent of the barrier depth, featuring a very slight increase when the barrier depth is reduced until vanishing.
Fig. 7 shows the current drive efficiencyηvs EC power in MW, at τ=50 and τ=80. The lower curves are for eb0=3.0×10⁻⁵ and ee0=0, and foree0=0.50×10⁻⁵ and eb0=0, at τ=80. The curve in the upper part of the plot shows the value ofηatτ=50, before the onset of EC waves. Other parameters are the same as in Fig. 1. It is seen that the efficiency of the current drive atτ=80 decreases with the in-crease of the EC power, with the same rate of dein-crease in the cases of magnetic and electrostatic transport. The time evolu-tion of the efficiency, which leads to the outcome appearing in Fig. 7, appear in Fig. 8, forτranging between 0 and 80, for several values of the EC power.
Although the efficiency of the current drive decreases with the increase of the EC power, the combined efficiency of LH and EC power is larger than the summation of the separated efficiencies due to LH and EC waves, as shown in Fig. 9, which displays the relative efficiency,
ηrelat=
ηLH+EC ηLH+ηEC
≃ ILH+EC
ILH+IEC , (10)
0.8 0.9 1 1.1 1.2 1.3 1.4 1.5 1.6
0.2 0.3 0.4 0.5 0.6 0.7 0.8 0.9 1
η
PE (MW)
80,MG 80,ES 50,MG 50,ES
FIG. 7: Current drive efficiencyηvs EC power in MW, atτ=50 and
τ=80; the two upper curves are foreb0=3.0×10⁻⁵andee0=0.0
(thin line) and foreb=0.0 andee=0.5×10⁻⁵ (thin dotted line), respectively, atτ=50. The two lower curves are foreb0=3.0×10⁻⁵
andee0=0.0 (thick line) and foreb=0.0 andee=0.5×10⁻⁵(thick
dotted line), respectively, atτ=80. Other parameters are the same
as in Fig. 1.
0 0.2 0.4 0.6 0.8 1 1.2 1.4 1.6
0 10 20 30 40 50 60 70 80
η
τ
0.25 0.50 0.75 1.00
FIG. 8: Current drive efficiencyη vsτ, for several values of EC
power, in the case of magnetic transport, witheb0=3.0×10⁻⁵and
e
e0=0.PEC=0.25 MW (thin dashed line), 0.50 MW (thin line), 0.75
MW (thick dashed line), and 1.00 MW (thick line). Other parameters are the same as in Fig. 1.
greater EC power considered, which is twice the LH power, the combined efficiency is tending to an asymptotic increase of approximately 12 %, similar to the increase obtained in the case ofPEC=2PLH, in Ref. [7]. Although in Ref. [7] the model utilized for the propagation of LH waves was differ-ent from the model utilized here, in both case some spatial superposition between the absorption profiles of LH and EC waves was obtained. The magnitude of the synergistic effect obtained is relatively small. The reason is the following. Al-though the spatial regions of EC and LH absorption are nearly coincident, the superposition of effects in momentum space is not very large, for the parameters utilized. At the position of
0.96 0.98 1 1.02 1.04 1.06 1.08 1.1 1.12 1.14
50 55 60 65 70 75 80
ηrelat
τ
0.25 0.50 0.75 1.00
FIG. 9: Time evolution of the relative efficiency of current genera-tion,ηrelat, in the case of magnetic transport, witheb0=3.0×10⁻⁵
andee0=0. The curves are obtained withPLH=0.50 MW, andPEC=
0.25 MW (thin dashed line), 0.50 MW (thin line), 0.75 MW (thick dashed line), and 1.00 MW (thick line). Other parameters are the same as in Fig. 1.
0.98 1 1.02 1.04 1.06 1.08
50 55 60 65 70 75 80
ηrelat
τ
a=1.000 a=0.125
FIG. 10: Time evolution of the relative efficiency of current genera-tion,ηrelat, in the case of magnetic transport, witheb0=3.0×10⁻⁵
andee0=0. The curves are obtained withPLH=0.50 MW, and show
the casesα=0.125 (thin line) andα=1.0 (thick line). Other
para-meters are the same as in Fig. 1.
maximum EC absorption, nears=0.5, the extremity of the resonant ellipses for EC waves, where most of EC power is deposed, occurs foruk≃2, while the LH-produced tail ap-pears foruk≥3.
0 1e+19 2e+19 3e+19 4e+19 5e+19 6e+19
-1 -0.5 0 0.5 1
ne
(m
-3
)
s (a)
3e-5,0.0,80 3e-5,0.0,50 0.0,0.5e-5,80 0.0,0.5e-5,50 0.0
0 0.5 1 1.5 2 2.5 3
-1 -0.5 0 0.5 1
Te
(keV)
s (b)
3e-5,0.0,80 3e-5,0.0,50 0.0,0.5e-5,80 0.0,0.5e-5,50 0.0
FIG. 11: (a) Electron density as function of position in the plasma
slab, atτ=50 andτ=80. (b) Electron temperature as function of
position in the plasma slab, atτ=50 andτ=80. The curves show
e
b0=3.0×10⁻⁵andee0=0.0 atτ=50 (thin line),eb0=3.0×10⁻⁵
andee0=0.0 atτ=80 (thick line),ee0=0.50×10⁻⁵andeb0=0.0
atτ=50 (thin dotted line),ee0=0.50×10⁻⁵andeb0=0.0 atτ=80
(thick dotted line). The initial profile is also shown in both panels (thin dashed lines). Other parameters are the same as in Fig. 1.
and allows longer time of interaction between the particle and the waves, therefore increasing the efficiency.
Fig. 11(a) shows the electron density as function of posi-tion in the plasma slab, atτ=50 andτ=80, for the cases e
b0=3.0×10⁻⁵ and ee0=0.0, and ee0=0.50×10⁻⁵ and e
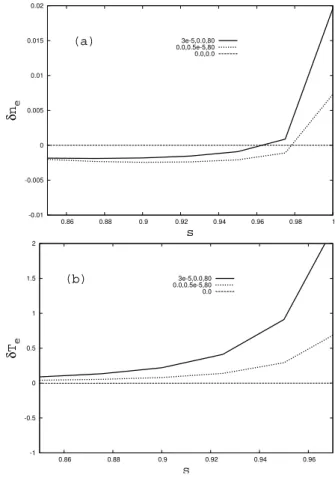
b0=0.0. Fig. 11(b) shows the electron temperature as func-tion of posifunc-tion in the plasma slab, atτ=50 andτ=80, for the caseeb0=3.0×10⁻⁵andee0=0.0, andee0=0.50×10⁻⁵ andeb0=0.0. The initial profile is also shown in both panels. Other parameters are the same as in Fig. 1. In the scale of the figure it is not possible to distinguish in Fig. 11(a) any sig-nificant modification of the density profile, which is atτ=80 nearly the same as atτ=0, both for magnetic and for electro-static transport. On the other hand, in Fig. 11(b) it is possible to notice a small decrease of the electron temperature at the plasma center, along with a small increase of the temperature ats≃0.5, where both LH and EC wave energy is absorbed, and a more significant increase near the plasma edge, in the cases with transport.
-0.01 -0.005 0 0.005 0.01 0.015 0.02
0.86 0.88 0.9 0.92 0.94 0.96 0.98 1
δ
ne
s
(a) 3e-5,0.0,80
0.0,0.5e-5,80 0.0,0.0
-1 -0.5 0 0.5 1 1.5 2
0.86 0.88 0.9 0.92 0.94 0.96
δ
Te
s
(b) 3e-5,0.0,80
0.0,0.5e-5,80 0.0
FIG. 12: (a) Amplified vision of the relative variation of the electron density,δne= (ne(τ)−ne(τ=0))/ne(τ=0), for positions near the
plasma edge, atτ=80. (b) Amplified vision of the relative variation
of the electron temperature,δte= (te(τ)−te(τ=0))/te(τ=0), for
positions near the plasma edge, atτ=80. In both panels the curves
show the caseseb0=3.0×10⁻⁵andee0=0.0 (thick line),ee0=0.50×
10−5andeb0=0.0 (thick dotted line). Other parameters are the same
as in Fig. 1.
IV. CONCLUSIONS
In this work we have investigated how the occurrence of radial transport and the presence of an Internal Transport Bar-rier affect the efficiency of current drive by LH and EC waves. We have considered two possible mechanisms for radial trans-port, either due to magnetic fluctuations or due to electrosta-tic fluctuations, and studied the influence of the barrier depth and position and of the level of magnetic or electrostatic per-turbation, considering parameters of a medium size tokamak. In our model of the plasma we have used boundary condi-tions appropriated for regimes where the loss of particles at the plasma edge is very small. Therefore the model is not suitable to describe situations with poor particle confinement. The description of the LH waves assumes a multipass regime, not valid for high-temperature plasmas where single-pass ab-sorption may occur.
Our results have shown some growth of the electron tem-perature near the plasma edge, more significant in the case of magnetic transport than in the case of transport due to electro-static fluctuations. Nevertheless, the results show only mar-ginal difference between the effects of the two types of trans-port mechanism, on the current drive efficiency. The effi-ciency of the LH+EC current drive has been shown to grow
with the level of fluctuations, both in the case of magnetic and electrostatic turbulence, with approximately the same rate of increase. This result can be understood as a consequence of the diffusion of fast particles toward more external regions of the tokamak, where they find smaller density, and conse-quently longer collisional slowing-down time. The efficiency has been shown to depend weakly on the depth and on the po-sition of the ITB. The minimum of the current drive efficiency has been shown to occur when the barrier is placed close to the position of LH power absorption, but somewhat displaced toward the external edge of the tokamak.
Acknowledgments
This work has been partially supported by Universidade Federal de Mato Grosso do Sul (UFMS), Conselho Na-cional de Desenvolvimento Cient´ıfico e Tecnol´ogico (CNPq), Fundac¸˜ao de Apoio ao Desenvolvimento do Ensino, Ciˆencia e Tecnologia do Estado de Mato Grosso do Sul (FUNDECT) and Fundac¸˜ao para o Amparo da Pesquisa no Estado do Rio Grande do Sul (FAPERGS). We thank the group of Complex Fluids at UFRGS for granting the use of their cluster of com-puters for a significant part of the numerical calculations.
[1] C. D. Challiset al., Plasma Phys. Contr. Fusion43, 861 (2001).
[2] S. J. Wukitchet al., Physics of Plasmas9, 2149 (2002).
[3] Y. Sakamotoet al., Plasma Phys. Contr. Fusion44, 876 (2004).
[4] E. J. Doyleet al., Plasma Physics Controlled Fusion43, A95
(2001).
[5] K. Ushigusaet al., Nuclear Fusion32, 1977 (1992).
[6] R. W. Harvey, O. Sauter, R. Prater, and P. Nikkola, Phys. Rev.
Lett.88, 205001, 4 pages (2002).
[7] P. R. da S. Rosa and L. F. Ziebell, Plasma Phys. Contr. Fusion
44, 2065 (2002).
[8] C. I. d. Oliveira, L. F. Ziebell, and P. R. da S. Rosa, Plasma
Physics Controlled Fusion47, 249 (2005).
[9] I. Fidone, G. Giruzzi, G. Granata, and R. L. Meyer, Phys. Fluids
27, 2468 (1984).
[10] P. R. da S. Rosa and L. F. Ziebell, Plasma Phys. Contr. Fusion
41, 525 (1999).
[11] R. Dumont, G. Giruzzi, and E. Barbato, Phys. Plasmas7, 4972
(2000).
[12] E. Barbato, Plasma Phys. Contr. Fusion40, A63 (1998).
[13] I. Fidone, G. Granata, and R. L. Meyer, Phys. Fluids25, 2249
(1982).
[14] P. R. da S. Rosa and L. F. Ziebell, Plasma Phys. Contr. Fusion
35, 511 (1993).
[15] P. R. da S. Rosa and L. F. Ziebell, Plasma Phys. Contr. Fusion
38, 375 (1996).
[16] G. Giruzzi, I. Fidone, and X. Garbet, Nuclear Fusion32, 1011
(1992), report EUR-CEA-FC-1440, DRFC, CEN, Cadarache, France, Nov. 1991.
[17] G. Giruzzi, Plasma Phys. Contr. Fusion35, A123 (1993).
[18] G. Giruzziet al., Plasma Phys. Contr. Fusion38, 1593 (1996).
[19] A. J. Wootton, H. Y. W. Tsui, and S. Prager, Plasma Phys. Contr.
Fusion34, 2023 (1992).
[20] G. G. Castle and A. J. Wootton, IEEE Transactions on Plasma
Science22, 369 (1994).
[21] X. Litaudonet al., Plasma Phys. Contr. Fusion43, 677 (2001).
[22] C. D. Challis et al., Plasma Phys. Contr. Fusion 44, 1031
(2002).
[23] Y. F. Baranov et al., Plasma Phys. Contr. Fusion 46, 1181
(2004).
[24] P. C. Liewer, Nuclear Fusion25, 543 (1985).
[25] Y. J. Kimet al., Physics of Fluids B3, 674 (1991).
[26] T. C. Luceet al., Physical Review Letters83, 4550 (1999).
[27] M. Shoucriet al., Computer Phys. Communications55, 253
(1989).
[28] R. J. Dumont and G. Giruzzi, Physics of Plasmas11, 3449
(2004).
[29] G. Giruzzi et al., Physical Review Letters 93, 255002, 4p.