Sci. Agric. (Piracicaba, Braz.), v.67, n.1, p.102-116, January/February 2010
Review
Greenhouse gas mitigation options in Brazil for land-use change,
livestock and agriculture
Carlos Clemente Cerri
1; Martial Bernoux
2; Stoecio Malta Ferreira Maia
1; Carlos Eduardo
Pellegrino Cerri
3*; Ciniro Costa Junior
1; Brigitte Josefine Feigl
1; Leidivan Almeida Frazão
4;
Francisco Fujita de Castro Mello
5; Marcelo Valadares Galdos
1; Cindy Silva Moreira
5;
João Luis Nunes Carvalho
41
USP/CENA - Lab. de Biogeoquímica Ambiental, Av. Centenário, 303 - 13400-970 - Piracicaba, SP - Brasil. 2
Institut de Recherche pour le Développement - IRD, UMR Eco&Sols “Functional Ecology & Soil Biogeochemistry” (INRA-IRD-SupAgro), Bat. 12, 2 Place Viala, 34060 - Montpellier Cedex 1 - France.
3
USP/ESALQ - Depto. de Ciência do Solo, C.P. 09 - 13418-900 - Piracicaba, SP - Brasil. 4
USP/ESALQ - Programa de Pós-Graduação em Solos e Nutrição de Plantas. 5
USP/CENA - Programa de Pós-Graduação em Ciências. *Corresponding author <cepcerri@esalq.usp.br>
ABSTRACT: National inventories of anthropogenic greenhouse gas (GHG) emissions (implementation of the National Communications) are organized according to five main sectors, namely: Energy, Industrial Processes, Agriculture, Land-Use Change and Forestry (LUCF) and Waste. The objective of this study was to review and calculate the potential of greenhouse gas mitigation strategies in Brazil for the Agricultural and LUCF. The first step consisted in an analysis of Brazilian official and unofficial documents related to climate change and mitigation policies. Secondly, business as usual (BAU) and mitigation scenarios were elaborated for the 2010-2020 timeframe, and calculations of the corresponding associated GHG emissions and removals were performed. Additionally, two complementary approaches were used to point out and quantify the main mitigation options: a) following the IPCC 1996 guidelines and b) based on EX-ACT. Brazilian authorities announced that the country will target a reduction in its GHG between 36.1 and 38.9% from projected 2020 levels. This is a positive stand that should also be adopted by other developing countries. To reach this government goal, agriculture and livestock sectors must contribute with an emission reduction of 133 to 166 Mt CO2-eq. This seems to be reachable when confronted to our mitigation option values, which are in between the range of 178.3 to 445 Mt CO2-eq. Government investments on agriculture are necessary to minimize the efforts from the sectors to reach their targets.
Key words: IPCC, EX-ACT, emission reduction, carbon fixation
Opções de mitigação de gases do efeito estufa na mudança do uso da terra,
pecuária e agricultura no Brasil
RESUMO: Inventários nacionais acerca de emissões de gases do efeito estufa (GEE) (refinamentos das Comunicações Nacionais) são organizadas de acordo com cinco principais setores, a saber: Energia, Processos Industriais, Agropecuária, Mudanças do Uso da Terra e Florestas e Tratamento de Resíduos. O objetivo dessa revisão foi calcular o potencial das estratégias de mitigação de GEE no Brasil para agropecuária e mudança de uso da terra e florestas. A primeira etapa consistiu na análise de documentos oficiais e não-oficiais do Brasil relacionados a mudanças climáticas e políticas de mitigação. O cenário atual, sem adoção de ações mitigadoras (BAU), e os cenários de mitigação foram elaborados para o período 2010-2020. Efetuaram-se os cálculos associados às emissões e remoções de GEE. Adicionalmente, duas estratégias foram utilizadas para destacar e quantificar as principais opções de mitigação: a) seguindo metodologia do IPCC 1996 e b) baseando-se no EX-ACT. Autoridades brasileiras anunciaram que o país buscará reduzir sua taxa de emissão de GEE em 36.1 a 38.9% em relação a 2020. Este é um posicionamento positivo que deve ser adotado por outros países em desenvolvimento. Para alcançar essa meta governamental, os setores agricultura e pecuária devem contribuir reduzindo a emissão em 133 a 166 Mt CO2-eq. Tal redução parece ser atingível quando confrontada com os valores do presente trabalho sobre opções de mitigação os quais estão entre 178,3 e 445 Mt CO2-eq. Investimentos governamentais nos setores agrícola, pecuária e silvicultura são necessários para minimizar os esforços para atingir as metas de redução de emissão pelos outros setores do país.
Introduction
The United Nations Framework Convention on Cli-mate Change (UNFCCC) requires countries to develop, update and publish their national inventories of anthro-pogenic greenhouse gas (GHG) emissions (implementa-tion of the Na(implementa-tional Communica(implementa-tions). Those invento-ries are organized according to five main sectors, namely: Energy, Industrial Processes, Agriculture, Land-Use Change and Forestry (LUCF) and Waste.
The Intergovernmental Panel on Climate Change (IPCC) detailed methodologies, good practice guidance and guidelines were followed. Data for the 1990-1994 pe-riod were reported in Brazil’s Initial National Commu-nication and were recently updated for 2000 and 2005 by Cerri et al. (2009). The authors calculated that the top four contributors in Brazil in 2005 were responsible for 90% of the total emitted in CO2-equivalent (CO2-eq)
from all sectors considering CO2, N2O and CH4. The
largest contributor was the “Forest and Grassland
Con-version” subsector of the LUCF Sector (1,074.2 Mt CO2
-eq) followed by the “Fossil Fuel Combustion” subsector
(374.0 Mt CO2-eq) of the Energy sector. The third and
fourth largest contributors belong to the Agriculture sec-tor, being respectively the “Enteric Fermentation” (248.4 Mt CO2-eq) and the “Agricultural Soils” subsectors (192.9
Mt CO2-eq). Major individual emitting sectors or
subsectors offer the largest mitigation potentials (IPCC, 2007). Therefore, the LUCF and Agriculture sectors are of great importance to mitigate GHG emissions.
Furthermore, they emit both CO2 and non-CO2 GHG
(N2O and CH4), which also have large implications at
the global scale. For instance, Brazil and India are among
the five largest emitters of non-CO2 GHG. Globally,
CH4 and N2O emissions from agricultural activities are projected to increase in the range of 20-40%, mainly for agricultural soil N2O emissions, enteric emissions, paddy rice, and manure management (USEPA, 2006). All those considerations highlight that mitigating GHG emissions is a great challenge for Brazil itself, but with worldwide importance. Concomitantly with the emissions,
Agricul-ture and LUCF are also able to remove CO2 from the
atmosphere depending on the land conversion (e.g., aban-donment of managed lands) and management (Bernoux et al., 2001, 2006; Cerri et al., 2004, 2007). Thus, the ob-jective of this study is to review and calculate the po-tential of mitigation strategies (decreasing emissions and enhancing sinks) in Brazil for the Agricultural and LUCF sectors, both considering already foreseen strat-egies and proposing new options.
Methodology
The first step consisted in an analysis of official and unofficial documents dealing with proposed climate change and mitigation specific policies for Brazil or con-cerning land-use and management options largely adopted in Brazil. In a second step, business as usual (BAU) and mitigation scenarios were elaborated for the
2010-2020 timeframe, and calculations of the correspond-ing associated GHG emissions were performed.
Secondly, two complementary approaches were used to review and quantify mitigation options. Under the first approach, calculations followed the proposal of the re-vised 1996 Guidelines for National Greenhouse Gas In-ventories (IPCC, 1997). The estimates were done sepa-rately for each option (BAU or mitigation scenarios) us-ing detailed calculation steps. For this purpose, we also used specific methodologies or an adaptation for Brazil of the IPCC Guidelines provided in the background re-ports established for Brazil’s Initial National Communi-cation (BINC) purpose (the reports are available at http:/ /www.mct.gov.br/index.php/content/view/20233.html). Five of those reports concerned the Agriculture and Live-stock sector, and four others were related to the LUCF sectors. Each report provides in detail the data sources and the steps followed in the calculation, thus enabling the use of exactly the same methodology.
The second approach was based on EX-ante Appraisal Carbon-balance Tools (EX-ACT, Bernoux et al., 2010). EX-ACT is a tool developed by the Food and Agricul-ture Organization of the United Nations (FAO) to pro-vide ex-ante measurements of the impact of agriculture and forestry development projects on GHG emissions and Carbon (C) sequestration, indicating their effects on the C balance. EX-ACT is a land-based accounting system, measuring C stocks, stock changes per unit of land, and CH4 and N2O emissions expressed in Mt CO2-eq ha–1 yr–1.
The main output of the tool consists of the C-balance re-sulting from the difference between two scenarios, gener-ally a newly proposed option and the BAU option.
EX-ACT was designed to work at the project level, but it can easily be up-scaled to the program/sector or national levels. EX-ACT has been developed using mostly the 2006 Guidelines for National Greenhouse Gas Inventories (IPCC, 2006) complemented with other ex-isting methodologies or default coefficients. Default val-ues for mitigation options in the agriculture sector are mostly from IPCC (2007). Therefore, EX-ACT does not use quite the same coefficients and methodology as those described in the Revised 1996 Guidelines for Na-tional Greenhouse Gas inventories. For instance, the C changes due to land management in EX-ACT are based on a coefficient relating C variation per year, whereas the 1996 guidelines considered a C stock change over a period of 20 years based on C stocks before and after the adoption of new practices. Besides, in EX-ACT the land accounting must be identical with and without the mitigation options; this is obtained through the construc-tion of a matrix of changes.
Mitigation potentials for the LUCF sector
Avoided Deforestation
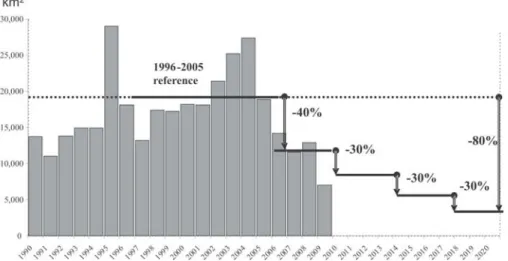
Sci. Agric. (Piracicaba, Braz.), v.67, n.1, p.102-116, January/February 2010 other national and international stakeholders. In
Novem-ber 2007, the Brazilian Federal government adopted a regulation (Decree n° 6263 of November 21, 2007) estab-lishing the Inter-Ministerial Committee on Climate Change and the elaboration of the National Plan on Cli-mate Change (NPCC). This document (Brasil, 2008a) proposes a scenario (named here as “Committed Miti-gation”) of consistent reduction in the deforestation rate for the Amazon region over quadrennial periods: Reduc-tion of 40% on average in the first quadrennial (2006-2009) in relation to the 1996-2005 average rate (19,533 km2
yr–1, named here BAU scenario NPCC option), i.e. a
mean deforestation rate of 11,720 km2 yr–1 for the
2006-2009 period. This is followed by subsequent reduction of 30% on average, i.e., a mean deforestation rate of 8,204 km2 yr–1 for the 2010-2013 period, and again a subsequent
reduction of 30% in 2014-2017 reaching a mean defores-tation rate of 5,743 km2 yr–1. More recently (1st of June
2009) the Brazilian President Luiz Inácio Lula da Silva declared that the reduction should reach 80% in 2020, i.e. establishing the new deforestation rate to 3,907 km2
yr–1. This will correspond roughly to the Scenario from
the NPCC with one more quadrennial reduction of 30%, i.e. 4,020 km yr–1(Figure 1).
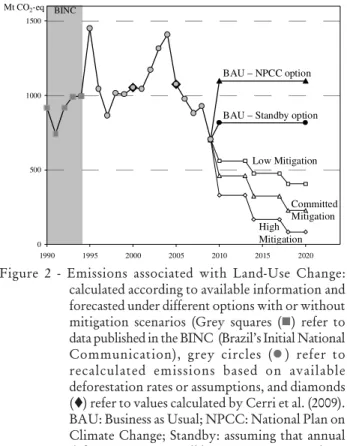
In addition to the “BAU - NPCC option” scenario, we considered an alternative BAU scenario, “BAU -Standby option”, assuming that annual deforestation rates will be on average 10,000 km2, roughly
correspond-ing to the average of the last two years. The latest defor-estation rate for 2009 was estimated at 7,009 km2 yr–1.
Therefore, the average rate for the 2006-2009 period would be below 12,185 km2 yr–1, i.e. very close to the rate
forecasted in the NPCC. In addition to this scenario, two other scenarios were considered starting from 2010, one with higher reduction (High Mitigation) rate of nearly 50% each quadrennial, with 5,884 km2 yr–1 in 2010-2013,
2,942 km2 yr–1 in 2014-2017 and 1,471 in 2018-2021, and another less intensive one with only a 15% of reduction (Low Mitigation) in each quadrennial.
The same scenarios (Committed, High and Low Miti-gation) were considered for the other Brazilian biomes: Cerrado, Caatinga, Pantanal and Atlantic forest (as in the BINC, Pampas areas were not considered in this cal-culation). However, due to difficulties in having good estimates of the deforestation rates for the 1995-2005 pe-riod, the BAU scenarios considered the last available rates and assumed they are also valid until 2009. The “BAU Standby option” includes rates of 21,260; 1,521;
1,633 and 341 km2 yr–1 for the Cerrado, Caatinga,
Pantanal and Atlantic forest, respectively.
Figure 2 illustrates the observed emissions till 2009 and the patterns of the two different BAU options and the mitigation scenarios. EX-ACT (Bernoux et al., 2010) calculations were performed on the BAU-NPCC option compared to Mitigation Committed scenario. In first step, default values and categories proposed by EX-ACT were used according to the ecological zones. The Ama-zon was considered as tropical rain forest, the Caatinga as tropical dry forest and all the other forest biomes (Cerrado, Atlantic Forest and Pantanal) were pooled to-gether as tropical deciduous forest.
The dominant soil type was set as a low activity clay soil as this category describes most of the Brazilian soils (Bernoux et al., 2002). EX-ACT estimated the total
emis-sion for the 2010-2020 period in 26,666 Mt CO2-eq and
8,420 Mt CO2-eq respectively for the BAU and
Mitiga-tion-committed scenarios. In a second step, EX-ACT was used with C stocks considered in the BINC for
above-ground vegetation within each biome (e.g. 98.8 Mg C ha–
1 in the Amazon). This approach produced lower
esti-mates with respectively 11,998 and 3,789 Mt CO2-eq, very close to the results based on BINC methodology (Table 1). The difference is mainly due to three factors: EX-ACT considers higher above-ground biomass, BINC does not take below-ground biomass and litter variations into account, and EX-ACT also considers soil C stocks variation. Regarding this last point, this compartment is
included in the “emissions and removals of CO2 by
Figure 1 - Reported deforestation rates (bars), in the Amazon and levels of reduction (lines) by quadrennials proposed by the National Plan on Climate Change (Brasil, 2008a) in reference to the 1996-2005 baseline.
soils” sub-sector in the BINC. Therefore, between 2010 and 2020, the avoided GHG emissions due to avoided deforestation in the Brazilian biomes can range from
8,240 Mt CO2-eq when only the above-ground biomass
derived from the BINC defaults are considered, to 18,246
Mt CO2-eq when considering the EX-ACT defaults. In
this case, this figure included the avoided emissions from below-ground biomass and litter.
Afforestation/reforestation
The planted forests in Brazil were evaluated to cover circa 6.6 Million hectares (Mha) in 2008 (ABRAF, 2009). Eucalyptus species represent alone nearly two thirds of the total with 4.2 Mha, followed by pine (Pinus spp) cov-ering 1.9 Mha. The difference, about 456,700 ha, is
dis-tributed among other species, mainly wattle (Accacia spp), Rubber trees (Hevea brasiliensis), Paricá (Schizolobium amazonicum) and Teak (Tectona grandis). Pine plantations are concentrated in the South Region (77% of the total in 2008), while Southeast Re-gion has 57% of the eucalyptus area in the country. The State of Minas Gerais has the largest combined eucalyp-tus and pine planted area in Brazil in 2008, with 1,423,212 ha, followed by São Paulo state with 1,142,199 ha (ABRAF, 2009).
Since 2004, the planted area with eucalyptus showed a mean annual increase of 7.4%, an average of 265,000 additional ha per year. In the same period, the pine area increased by 1.4% per year, an average of 26,000 ha per year. The area occupied by other species was rather stable between 2007 and 2008 (ABRAF 2009), while it increased 2.9% in 2007 (ABRAF, 2008) and 1.4% in 2006 (ABRAF, 2007) in comparison to the previous year. Thus, a Plantation-BAU scenario was set up using these annual increments.
An additional scenario (NPCC-scenario) was made considering the Brazilian government proposition (Brasil, 2008b) of doubling the area of planted forests (apparently considering 2005 values), implanting another 5.5 million ha until 2020 (including 2 Mha of native species); that proposition follows the pattern of 75% with eucalyptus and 20% with pine (ABRAF, 2009). These new plantations are expected to be located on degraded pastures.
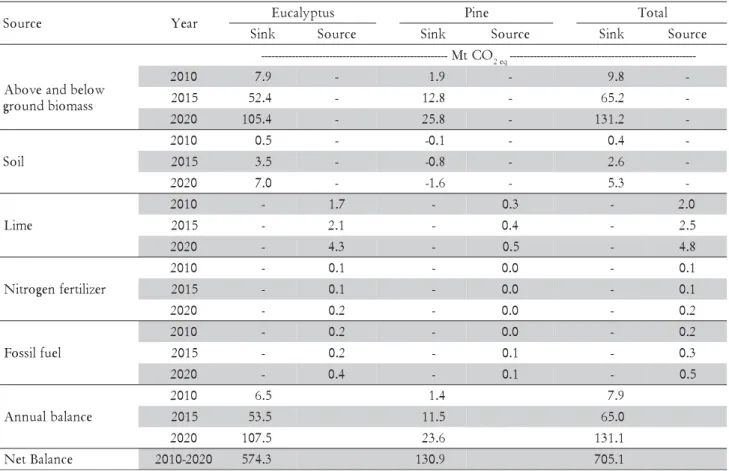
In addition to biomass and soil C stock changes (BINC), emissions associated with plantation manage-ment were computed, including N fertilizer application, liming and fossil fuel use in machinery operations, based on scientific and technical reports (Gonçalves, 1995; Mafra et al., 2008; VPC, 2008; unpublished data from C.S. Moreira). Table 2 detailed the different contributions in the final balance for the Plantation-NPCC scenario.
The eucalyptus and pine participation on the miti-gation scenarios were around 75% and 25%, respec-tively. And the above and below ground biomass is the component evaluated with the highest potential for C input, while lime and fossil fuel are the major C out-puts. When comparing the corresponding areas under
*2008-2012 and 2013-2017 correspond respectively to the 1st and 2nd commitment periods under the Kyoto Protocol (even though Brazil is not subject to Quantified Emission Reductions, it is a useful comparison parameter). BAU: Business as Usual. NPCC: National Plan on Climate Change. Standby: assuming that annual deforestation rates will be on average 10,000 km2.
Table 1 - Total and average GHG emissions under the different avoided deforestation scenarios for different periods of time*
o i r a n e c
S Totalover theperiod(MtCO2-eq) Yearly average(MtCO2-eqyr 1 –)
0 2 0 2 -0 1 0
2 2008-2012 2013-2017 2010 2020 2010-2020 2008-2012 2013-2017 U
A B
C C P
N 12,048 4,918 5,476 1,095 1,095 1,095 984 1,095 y
b d n a t
S 7,749 3,746 4,088 704 704 704 749 818 n
o i t a g i t i M
w o
L 5,349 3,309 2,460 559 404 486 662 492 d
e t t i m m o
C 3,808 3,013 1,750 460 226 346 603 350 h
g i
H 2,220 2,619 987 329 82 202 524 197
Figure 2 - Emissions associated with Land-Use Change: calculated according to available information and forecasted under different options with or without mitigation scenarios (Grey squares () refer to data published in the BINC (Brazil’s Initial National Communication), grey circles (z) refer to recalculated emissions based on available deforestation rates or assumptions, and diamonds () refer to values calculated by Cerri et al. (2009). BAU: Business as Usual; NPCC: National Plan on Climate Change; Standby: assuming that annual deforestation rates will be on average 10,000 km2.
BINC Mt CO2-eq
BAU – NPCC option
BAU – Standby option
Committed Mitigation Low Mitigation
High Mitigation
0 500 1000 1500
Sci. Agric. (Piracicaba, Braz.), v.67, n.1, p.102-116, January/February 2010 BAU and NPCC in the 2010-2020 period, the potential
for mitigation of global warming by eucalyptus and pine
was, respectively, 652.7 Mt CO2-eq (BAU) and 705.1 Mt
CO2-eq (NPCC). It appeared that the final areas are simi-lar, and therefore the Brazilian proposition is rather con-servative, representing a modest mitigation effort of 52.4
Mt CO2-eq. Thus, a more ambitious scenario was built,
named Plantation-High. That scenario considers that in 2020 the planted area will reach 16.5 Mha, tripling the 2005 area. The results showed that the Plantation high
scenario would almost be 1,000 Mt CO2-eq higher than
BAU and NPCC scenarios in the period considered. In terms of mean annual additional mitigation when in comparison to BAU, the Plantation-High scenario cor-responds to a potential of 100 Mt CO2-eq yr–1, whereas
the scenario proposed by the Brazilian government only
5.2 Mt CO2-eq yr–1, becoming obviously more effective
to C sequestration. EX-ACT (Bernoux et al., 2010) calcu-lations were performed on the Plantation-High and Plan-tation-NPCC options and compared to the Plantation-BAU scenario. Eucalyptus and pine plantations were both considered as “subtropical dry forest” plantation type implemented on degraded land. EX-ACT estimated that Plantation-High and Plantation-NPCC increase sink by, respectively, 1,322 Mt CO2-eq and 187 Mt CO2-eq in rela-tion to BAU, i.e. results of the same order to the estimates
above, but clearly using specific default values for euca-lyptus and pine would improve the estimates.
Mitigation potential for the livestock sector
Globally, livestock enteric CH4 accounted for one
third of global agricultural non-CO2 emissions in 2000
(USEPA, 2006). In Brazil, the Enteric Fermentation subsector was the third contributor to Brazilian GHG emissions in terms of CO2-eq (Cerri et al., 2009). It is also by far the first contributor for CH4 emission. Among the components, the non-dairy cattle were responsible for 82.2% of total enteric fermentation for the year 1994. Cattle were also responsible for Agricultural soil
sub-sec-tor emissions, regarding N2O emissions from direct
ma-nure deposition on field by grazing animals. Grazing ani-mals’ contribution is 46% of the sub-sector, 34% of which is from non-dairy cattle. Cerri et al. (2009) showed that the emission due to enteric fermentation increased by 26.1% in 2005 in relation to 1994, and represented 12% of the total Brazilian GHG emissions. At the global level, Brazilian cattle are also of prime importance. Brazil ac-counts for 20% of the meat production and 23.5% of the milk production in developing countries (FAO, 2006). Therefore, this section will focus only on cattle, although mitigation actions are certainly possible for other animals such as swine and poultry.
1BRAZIL (2004); 2Mafra et al. (2008) and Unpublished data from C.S. Moreira; 3Gonçalves, (1995); 4VCP (2007). NPCC: National Plan on Climate Change.
Table 2 - Sinks and sources in Mt CO2-eq associated with the eucalyptus and pine plantations according to the Plantation-NPCC scenario.
e c r u o
S Year Eucalyptus Pine Total
k n i
S Source Sink Source Sink Source
O C t M
--- 2eq---
--w o l e b d n a e v o b A
s s a m o i b d n u o r g
0 1 0
2 7.9 - 1.9 - 9.8
-5 1 0
2 52.4 - 12.8 - 65.2
-0 2 0
2 105.4 - 25.8 - 131.2
-l i o S
0 1 0
2 0.5 - -0.1 - 0.4
-5 1 0
2 3.5 - -0.8 - 2.6
-0 2 0
2 7.0 - -1.6 - 5.3
-e m i L
0 1 0
2 - 1.7 - 0.3 - 2.0
5 1 0
2 - 2.1 - 0.4 - 2.5
0 2 0
2 - 4.3 - 0.5 - 4.8
r e z i l i t r e f n e g o r t i N
0 1 0
2 - 0.1 - 0.0 - 0.1
5 1 0
2 - 0.1 - 0.0 - 0.1
0 2 0
2 - 0.2 - 0.0 - 0.2
l e u f l i s s o F
0 1 0
2 - 0.2 - 0.0 - 0.2
5 1 0
2 - 0.2 - 0.1 - 0.3
0 2 0
2 - 0.4 - 0.1 - 0.5
e c n a l a b l a u n n A
0 1 0
2 6.5 1.4 7.9
5 1 0
2 53.5 11.5 65.0
0 2 0
2 107.5 23.6 131.1
e c n a l a B t e
The NPCC (Brasil, 2008a) did not detail mitigation strategies concerning livestock in general and cattle, spe-cifically. It only stated that increasing the quality of
pas-tures may reduce CH4 emission from cattle. Methane is
produced during anaerobic fermentation of carbohy-drates, mainly from grass forage. Anaerobic fermentation is the result from the digestive process of herbivore ru-minants in the rumen. Methane emissions are impacted by a number of factors including the animal traits (e.g. age, bodyweight, and genetics), feed quality and environ-mental parameters (e.g. temperature). Therefore, mitiga-tion opmitiga-tions would have to address those drivers. IPCC (2007) reviewed the mitigation potentials linked mostly with animal and feed factors and reported that they could be categorized more precisely into improved feeding prac-tices, use of specific agents or dietary additives, and longer term management changes and animal breeding.
Concerning feeding practices, IPCC (2007) showed that the use of more concentrates commonly increases
CH4 emission on an animal basis, but since it also
in-creases performance (milk and meat), the end result is
an overall reduction of CH4 emissions per unit of
prod-uct (litter of milk or kg of meat). Moreover, the enrich-ment of the diet with concentrates is more efficient with complementary practices related to management (e.g. younger age at slaughter for beef animals) or feeding (oil seeds’ addition). Another alternative consists in the use of additives (ionophores, propionate precursors, con-densed tannins) that directly affect methanogenesis in-side the rumen, but these options may be limited due to existing barriers regarding their use (for instance, iono-phores are banned in Europe market), their cost, or ad-verse effects in meat conversion rates. Choice of the ani-mal might be of prime importance. Pedreira et al. (2009) showed that with the same diet and conditions, emis-sions per animal from lactating cows were higher for black and white Holstein than for Brazilian dairy Zebu crossbred, but concluded that Holstein cows may dilute
CH4 emission per kg of milk due to their greater milk
production. Demarchi et al. (2003) stated that a decrease in the average slaughter age of steers of Brazilian Nelore would decrease total methane emissions by 10% for the Brazilian beef cattle production system.
Manure management also emits CH4 and N2O. These
emissions are the result of microbial activities from
nitrifiers and denitrifiers for N2O and methanogens for
CH4. Thus emissions can be related with the
tempera-ture, more or less according to the type and form (liq-uid or solid) of manure management. Animal manure can be stored either wet (e.g. slurry) or dry (e.g. farm yard manure). Methane emissions occur mainly when the manure is managed in liquid forms (lagoon or hold-ing tanks) or remain wet. Worldwide, intensive livestock systems commonly use liquid manure management due to the large quantity of manure produced and easier han-dling and collection with pipelines (Reid et al., 2004). In Brazil, most intensive livestock systems adopt the dry lot based systems.
The manure management is important in deriving emissions’ coefficient. IPCC methodologies (IPCC, 2006) proposed coefficient of methane emission factors by temperature. For Latin America the coefficients are
small and rather stable with temperature: 1 kg CH4
head–1 yr–1 for cattle, buffalo and swine for mean annual
temperature, except for dairy cattle where the value in-creases to 2 kg CH4 head–1 yr–1 above 25°C. But this is
the result of hypothesis regarding the manure manage-ment. IPCC assumes that for Latin America almost all (99%) manure is left on pastures and rangeland for non-dairy cattle. For non-dairy cattle, this management accounts for only 36%, while 62% is managed as daily spread (i.e. removed from confinement facilities and applied to crop-land or pasture within 24 hours of excretion). The re-maining 2% is managed as half liquid/slurry (i.e. stored as excreted or with a minimal addition of water) or solid storage (i.e. storage for a period of several months in un-confined piles or stacks). The manure coefficient emis-sion for lagoon and liquid/slurry are calculated based on the van’t Hoff-Arrhenius equation linking tempera-ture to biological activities (Mangino et al., 2001). A di-rect consequence is that any change towards more
liq-uid/slurry of lagoon will sharply increase CH4
emis-sions, even more in warm regions. Thus, in any process of intensification or confinement of cattle, it will be
im-portant to promote the capture and use of CH4 through
anaerobic digesters.
The calculation of emissions from enteric fermenta-tion and manure management used the number of cattle head. Emissions from manure management calculated here correspond to the total of emissions reported un-der the categories “Manure management” and “Agricul-tural soils” subcategories (under the item “Grazing Ani-mals”) used in the BINC and Cerri et al. (2009). Con-cerning the forecasted evolution of the number of ani-mals in Brazil, the NPCC (Brasil, 2008a) did not pro-pose or review scenarios. Therefore, the BAU scenario was elaborated considering the statistics of the 1996-2005 timeframe, which corresponds to the last 10-year period available. Over this 10-year period the average number of dairy cattle increased from 16.3 to 20.6 million head
in a nearly linear shape (r2 = 0.97) with a mean
incre-ment of 450.7 thousand head per year. At the same time, the beef cattle herd also increased linearly (r2 = 0.94)
from 142 to 186 million head, but with a high rate of nearly 5.44 million heads per year. Those mean annual rates were used as the BAU scenario to estimate the size
of cattle herd and associated CH4 emissions. Total herd
size was estimated in 236.2; 266.1 and 295.5 million heads for the years 2010, 2015 and 2020, respectively. The as-sociated emissions using the same methodology and fac-tors as in the BINC were respectively 273.3; 307.3 and
341.3 Mt CO2-eq. Mitigation scenarios were built
in-Sci. Agric. (Piracicaba, Braz.), v.67, n.1, p.102-116, January/February 2010 creases, thus reaching 247.7 million head in 2020, and a
high mitigation scenario assumed a 50% reduction in the rates (thus reaching 227.4 million head in 2020). These scenarios are named thereafter Low-25 and High-50. The High-50 scenario is not overly optimistic if deforesta-tion of the Amazon is reduced as forecasted, because there is an evident synergy in slowing down deforesta-tion rates and slowing down the annual increase of herd size.
In 2020, emissions from enteric fermentation of cattle would be respectively for the Low-25 and High-50 sce-narios 315.8 and 295.4 Mt CO2-eq, i.e. a reduction in
rela-tion to BAU of 25.5 and 45.9 Mt CO2-eq. The cumulative
emissions for the 2010-2020 period would be 3,380.5 Mt
CO2-eq under the BAU baseline, and the amount of
avoided emissions would be 187.1 Mt CO2-eq (Low-25)
and 336.9 Mt CO2-eq (High-50). Default EX-ACT
calcu-lations were performed (Table 3) to recalculate emissions from enteric fermentation and manure management for different periods using the herd numbers under the BAU option and under the different mitigation scenarios.
Concerning the adoption of technical mitigation strategies, the three alternatives considered in EX-ACT (Bernoux et al., 2010) were compared (named respec-tively options A, B and C), i.e. improved feeding prac-tices, use of specific agents or dietary additives, and longer term management changes and animal breeding. Two different dynamics of adoption by ranchers were considered: in dynamic–1c, adoption of the practices (in % of animal concerned) is linear between 0% in 2010 and 100% in 2020, whereas for the dynamic-2 scenario,
the adoption is faster, reaching 100% in 2015. The amount of GHG mitigated under all scenarios for the different dynamics are summarized in Table 4. Some measures might not be additive when applied simulta-neously, such as the option A and option B, but this is probably not the case with option C. However, options were not combined in order to avoid overestimation of the reduction potential.
Mitigation potential for Agriculture sector
No-tillage and cover-cropping
The goal of the Brazilian Environment Ministry is to increase the area under no-tillage (NT) from 28 mil-lion ha to 40 milmil-lion ha until 2020, which represents a conversion of 12 million ha from full tillage (FT) sys-tems to conservationist syssys-tems. However, the annual rates of such an increase have not been specified, nei-ther have the regions in which it will take place. There-fore, to estimate the potential of GHG mitigation from NT adoption in Brazil, the following assumptions were taken into account:
i) A linear increase in the adoption of NT systems from 2010 to 2020, which means an annual increase of 1.1 mil-lion ha;
ii) A mean rate of soil organic carbon (SOC) storage de-rived from the studies of Bernoux et al. (2006) and Bayer et al. (2006), which represent the rate in the top 20cm of the soil profile for the South and Central (Cerrado) re-gions of Brazil; iii) The adoption of NT implies in changes in farming practices (Snyder et al., 2009) such
*2008-2012 and 2013-2017 correspond respectively to the 1st and 2nd commitment periods under the Kyoto Protocol (even though Brazil is not subject to Quantified Emission Reductions, it is a useful comparison parameter). BAU: Business as Usual. Low-25 scenario: low mitigation scenario considers a 25% reduction of the annual increases, thus reaching 247.7 million head in 2020. High-50 scenario: high mitigation scenario assumes a High-50% reduction in the rates, thus reaching 227.4 million head in 2020.
Table 3 - Total and average GHG emissions over different periods associated with enteric fermentation and manure management under the BAU, Low-25 and High-50 scenarios.
o i r a n e c
S Totalovertheperiod(MtCO2-eq) Yearlyaverage(MtCO2-eqyr
1 –)
0 2 0 2 -0 1 0
2 2008-2012 2013-2017 2005 2010 2020 2010-2020 2008-2012 2013-2017 U
A B
c i r e t n E
n o i t a t n e m r e
f 3,482.6 1,408.1 1,583.0 246.6 281.6 351.6 316.6 281.6 316.6
e r u n a M
t n e m e g a n a
M 673.3 272.5 306.0 47.8 54.5 67.9 61.2 54.5 61.2
n o i t a g i t i M w o L
c i r e t n E
n o i t a t n e m r e
f 3,290.2 1,364.4 1,495.6 246.6 272.9 325.3 299.1 272.9 299.1
e r u n a M
t n e m e g a n a
M 636.4 264.2 289.3 47.8 52.8 62.9 57.9 52.8 57.9
l a t o
T 3,926.7 1,628.6 1,784.8 294.5 325.7 388.2 357.0 325.7 357.0
n o i t a g i t i M h g i H
c i r e t n E
n o i t a t n e m r e
f 3,097.9 1,320.7 1,408.1 246.6 264.1 299.1 281.6 264.1 281.6
e r u n a M
t n e m e g a n a
M 599.6 255.8 272.5 47.8 51.2 57.9 54.5 51.2 54.5
l a t o
as the use of machinery, lime, N fertilizer, and can also
modify the fluxes of the other GHG such as N2O and
CH4 from soils when compared with FT systems.
There-fore, for the fluxes of N2O and CH4 from soils we used the average of results obtained by Siqueira Neto (2006), Gomes (2006) and Carvalho et al. (2009); for the changes related to the use of machinery (i.e. agricultural opera-tions) the values presented by Gomes (2006) were used, and for the emissions related to lime and N fertilizer we assumed there is no difference between the NT and FT.
Considering the assumptions described above, the
amount in CO2-eq that can be sequestered by the
adop-tion of NT until 2020 was estimated. In addiadop-tion to this initial scenario (named here as “Committed
Mitiga-tion”), two other scenarios were considered: one with half of the increase in the area under NT (Low Mitiga-tion), which means that in 2020 only 34 million ha would be under NT; and a second scenario considering dou-bling the increase, i.e., 52 million ha under NT in the year of 2020.
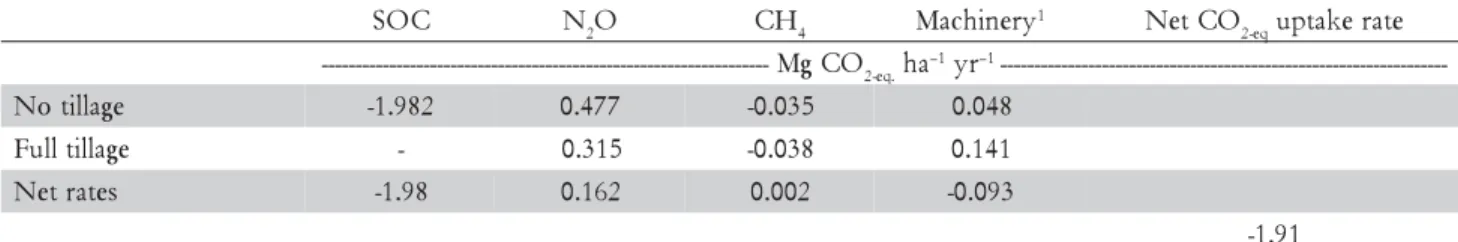
Table 5 shows the rates of GHG emissions or remov-als associated with the soil as well as with the use of ma-chinery in agricultural practices in both tillage systems
(i.e. NT and FT), and presents the net CO2 uptake rate
resulting from the conversion of FT to NT systems in Brazil. The adoption of NT system results in a N2O emis-sion rate 51% higher than in the FT system (Table 5).
Like-wise, CH4 is 8.5% less absorbed in NT than in the FT
*2008-2012 and 2013-2017 correspond respectively to the 1st and 2nd commitment periods under the Kyoto Protocol (even though Brazil is not subject to Quantified Emission Reductions, it is a useful comparison parameter).
Table 4 - Technical reduction potential for enteric methane emissions due to improved feeding practices (option 1), specific agents and dietary additives (option 2) and longer term management change and animal breeding (option 3); considering herd sizes under the BAU (Business as Usual), Low-25 (25% reduction of the annual increase, thus reaching 247.7 million head in 2020), High-50 (50% reduction in the rates, thus reaching 227.4 million head in 2020) scenarios and with two dynamic for adoption of the practices.
o i r a n e c
S Totalovertheperiod(MtCO2-eq) Yearlyaverage(MtCO2-eqyr
1 –)
0 2 0 2 -0 1 0
2 2008-2012 2013-2017 2010 2020 2010-2020 2008-2012 2013-2017
U A B
1 c i m a n y D
A n o i t p
O 60.2 2.9 26.5 0 11.6 5.5 0.6 5.3
B n o i t p
O 38.3 1.9 16.8 0 7.4 3.5 0.4 3.4
C n o i t p
O 52.7 2.5 23.1 0 10.2 4.8 0.5 4.6
2 c i m a n y D
A n o i t p
O 86.5 5.8 46.4 0 11.6 7.9 1.2 9.3
B n o i t p
O 54.9 3.7 29.5 0 7.4 5.0 0.7 5.9
C n o i t p
O 75.6 5.1 40.5 0 10.2 6.9 1.0 8.1
5 2 -w o L
1 c i m a n y D
A n o i t p
O 56.5 2.8 25.0 0 10.8 5.1 0.6 5.0
B n o i t p
O 35.9 1.8 15.9 0 6.8 3.3 0.4 3.2
C n o i t p
O 49.3 2.4 21.8 0 9.4 4.5 0.5 4.4
2 c i m a n y D
A n o i t p
O 81.3 5.6 43.8 0 10.8 7.4 1.1 8.8
B n o i t p
O 51.6 3.6 27.8 0 6.8 4.7 0.7 5.6
C n o i t p
O 70.9 4.9 38.2 0 9.4 6.4 1.0 7.6
0 5 -h g i H
1 c i m a n y D
A n o i t p
O 52.7 2.7 23.5 0 9.9 4.8 0.5 4.7
B n o i t p
O 33.4 1.7 14.9 0 6.3 3.0 0.3 3.0
C n o i t p
O 45.9 2.3 20.5 0 8.7 4.2 0.5 4.1
2 c i m a n y D
A n o i t p
O 76.1 5.4 41.3 0 9.9 6.9 1.1 8.3
B n o i t p
O 48.3 3.4 26.2 0 6.3 4.4 0.7 5.2
C n o i t p
Sci. Agric. (Piracicaba, Braz.), v.67, n.1, p.102-116, January/February 2010 system. Otherwise, the GHG emissions (expressed as
CO2–eq.) from agricultural operations (machinery) in NT
system areas are only 34% of the emissions in FT
sys-tems. Moreover, the SOC is a sink of atmospheric CO2,
at a rate of 1.98 Mg CO2–eq ha–1 yr–1. Consequently, the
conversion from FT to NT systems represents in Brazil a net CO2 uptake rate of 1.91 Mg CO2–eq ha–1 yr–1.
The conversion of 12 million ha into the NT system until 2020 (Committed mitigation scenario) may
repre-sent a removal of 138.5 Mt CO2–eq. from the atmosphere
(Table 6). The other two scenarios can be used to illus-trate the mitigation potential and emphasize the impor-tance of implementing or not the committed mitigation scenario. For example, if the adoption of NT is encour-aged and 24 instead 12 million ha are converted to NT until 2020, the gain can be doubled, which means 277.1
Mt CO2–eq. However, if only 50% of the initial goal is
reached, the CO2 uptake will be about 69 Mt CO2–eq.
(Table 2). Yet, it is important to highlight that SOC stor-age rate, which is the main contributor to the mitiga-tion potential of no tillage system (Table 6) represents only the C storage in the top 20cm soil profile. Thus, it can be suggested that the SOC gain could be greater if the whole soil profile was evaluated.
NT system presents several benefits when compared with FT systems. However, soil C accumulation in NT systems can be higher when associated with integrated management systems, such as the implementation of in-tegrated crop-livestock systems under no tillage (ICLNT). ICLNT includes the diversification of activi-ties by strategic integration of pastures and agriculture in order to benefit both. Associating the increased lev-els of soil fertility in the crop areas under NT system, with the enhanced capacity of well-managed pastures of
storing C into the soil, it is expected that results would generate not only a large increase in soil C stocks but
also a reduction of CO2 emissions to the atmosphere
(Carvalho et al., 2010). Salton (2005) and Carvalho et al. (2010) evaluated the capacity of ICLNT systems in in-creasing soil C stocks and verified that the association of pastures with crops under NT can result in rates of soil C accumulation two to four times larger than those observed in the conversion of FT to NT and systems. In addition to the mentioned increase in soil C stocks, the ICLNT system results in improved land use efficiency, demanding less land for agricultural expansion, and con-sequently, reducing deforestation rates.
Flooded rice
Rice has an important role in methane emissions, caused by organic matter decomposition in anaerobic conditions (IPCC, 2006). In Brazil, emissions from rice
production amounted to 5.4 Mt CO2-eq, 1.2% of the
to-tal emissions of 467 Mt CO2-eq from Agriculture sector
in 2005 (Cerri et al., 2009). Irrigated rice represented 33% of all productions in 1994, out of which 92.2% were per-manently flooded, 7.5% were cropped in naturally flooded areas and 0.3% were managed under intermit-tent irrigation systems (Brasil, 2006). Historically, rice production has increased mainly due to improved tech-nology. From 1997 to 2007, there was an increase of 2.7 Mt in domestic production with a small reduction in the area under production. The projection for 2010 is that 12 Mt will be produced in 2.9 Mha, reaching 13.4 Mt in 2020 (CONAB, 2009; Brasil, 2008b).
Although rice field methane emissions in Brazil are relatively small, the adoption of different water manage-ment systems can result in even lower emissions. Sass
1Machinery in NT systems means sowing + harvest, while that in FT systems means sowing + plowing + 2 harrowing + harvest (Gomes, 2006; Zanatta, 2005). 2Negative values means uptake of CO
2 –eq., while that positive values means emission of CO2 –eq. Table 5 - Net CO2-eq uptake rate due to the conversion of full tillage to no tillage, and soil organic carbon (SOC), N2O,
CH4, and machinery rates of emission or removal comparing the tillage systems in Brazil.
C O
S N2O CH4 Machinery1 NetCO
q e
-2 uptakerate O
C g M
---- 2-eq.ha–1yr–1 ---------------------------------------------------------------- --e
g a l l i t o
N -1.982 0.477 -0.035 0.048
e g a l l i t l l u
F - 0.315 -0.038 0.141
s e t a r t e
N -1.98 0.162 0.002 -0.093
1 9 . 1
-1Machinery in NT systems means sowing + harvest, while that in FT systems means sowing + plowing + 2 harrowing + harvest (Gomes, 2006; Zanatta, 2005). 2Negative values means uptake of CO
2 –eq., while that positive values means emission of CO2 –eq. Table 6 - Net CO2-eq uptake due to the conversion of full tillage to no tillage and the emission or removal associated
with soil organic carbon (SOC), N2O and CH4 from soils and machinery use in no tillage systems in Brazil.
o i r a n e c
S SOC N2O CH4 Machinery1 NetCO
q e
-2 uptakerate
O C g M
--- 2-eq. --- --n
o i t a g i t i M w o
L -71.92 5.9 0.1 -3.4 -69.3
n o i t a g i t i M d e t t i m m o
C -143.7 11.8 0.2 -6.8 -138.5
n o i t a g i t i M h g i
et al. (1992) and Yagi et al. (1996) reported that regular drainage may represent the most efficient method to minimize emissions. The authors found that a single drainage during the rice growth phase reduced methane emissions by 50%. In addition, multiple drains (two to three days) every three weeks throughout the growing season reduced emissions to negligible values. Consid-ering that the area under irrigated rice will remain con-stant until 2020 and that permanently flooded areas would revert to periodically drained systems (Sass et al., 1992; Yagi et al., 1996), emissions could be reduced from
the 5.4 Mt CO2-eq (BAU scenario) reported by Cerri et
al. (2009) to 2.9 Mt CO2-eq annually, totaling the emis-sion reduction of 25 Mt CO2-eq for the 2010-2020 period.
Sugarcane management
The sugarcane production area in Brazil reached 7.4 Mha during the 2008/2009 crop year, producing 570 Mt
of feedstock for 31 Mt of sugar and 27.5 Mm3 of ethanol
(CONAB, 2009). The Central-South region responds for 86% in cropped area, and the state of Sao Paulo has the largest production area with 4.2 Mha which accounted for 58% of total production in 2008/2009 (UNICA, 2009). The area cropped with sugarcane expanded by 2 Mha in the last five years (CONAB, 2009). This is related to the increased consumption of ethanol used in flex-fuel vehicles, which accounted for 90% of all new vehicle sales in 2008 (UNICA, 2009).
Two projections of growth were considered to esti-mate the need for new areas of sugarcane in order to supply the bioethanol and sugar demand for 2020. The National Energy Plan - 2030 (NEP) estimates that there will be an increase of 3.9 Mha by 2020, when annual etha-nol production will reach 52 Mm3 (Table 7) (Brasil, 2007).
NPCC indicates that it will be necessary to produce 73 Mm3 (1st and 2nd generation) to supply the Brazilian
mar-ket in 2020 (Brasil, 2008a). Maintaining a proportion of 55% and 45% of the sugarcane area for bioethanol and sugar respectively (CONAB, 2009), the area needed to supply that amount will be 18.4 Mha, considering a
sug-arcane yield of 80.1 Mg ha–1 and an ethanol yield of 90
litters per ton of biomass (Table 7).
Burning leaves and tops in order to facilitate sugar-cane harvest has been a common practice in Brazil. How-ever, due to environmental and economic reasons,
manu-ally harvested, burned sugarcane has been progressively replaced by mechanically harvested cane with mainte-nance of the crop residues on the field. There exists a positive correlation between the maintenance of sugar-cane trash and the increase in soil organic carbon (SOC) content, influenced by time since adoption of the un-burned harvest, soil texture and soil disturbance (Cerri et al., 2004; Galdos et al., 2009).
Cerri et al. (2009) reviewed published comparisons of soil carbon stocks between burned and unburned ar-eas. The average annual increase in soil carbon stocks
down to 30 cm was 1.5 Mg C ha–1. Assuming that the
sugarcane area harvested mechanically without burning will represent 50% in 2010, 100% in 2020 and that the increase will be linear, we estimated the potential for carbon sequestration in this period. Since soil C seques-tration occurs in the agricultural phase of production, regardless of the final processed product (sugar or etha-nol), thus the total sugarcane areas were considered in the calculation. Considering the 2010-2020 period, the conservation management of sugarcane residues has the
potential to sequester 404 Mt CO2-eq under the NEP
sce-nario, and 619 Mt CO2-eq under the NPCC scenario in
the form of soil carbon in the first 30 cm. Cerri et al (2004) estimated that the burning release about 370 kg
Ceq ha–1 yr–1; therefore, under the NEP and NPCC
sce-narios for the period 2010-2020, the emissions of GHG is equivalent to 29.3 Mt CO2-eq (NEP) and 29.9 Mt CO2 -eq (NPCC). Discounting those emissions the net ben-efice is respectively 375 Mt CO2-eq and 579 Mt CO2-eq.
Mitigation potential from bio-energy
Bioethanol
Sugarcane-derived bioethanol production has in-creased in Brazil since the implementation of the ‘PRO ÁLCOOL’ biofuel program in the 70’s (Coelho, 2000). The program went through a stagnation period between 1990 to1999 but was reactivated soon thereafter. From
its beginning until 2000, 227 Mm3 of bioethanol
(anhy-drous and hydrated) were produced, avoiding the
emis-sion of 630 Mt CO2-eq to the atmosphere (Cerri et al,
2009). Between 2000 and 2005, the production of first gen-eration bioethanol increased at a rate of 9.7% per year, and current projections indicate the annual growth rate will reach 8.7% between 2006 and 2010.
*Estimate value considering production aspects on NEP (National Energy Plan - 2030 ) scenario to reach NPCC (National Plan on Climate Change) bioethanol projections. ** CONAB numbers.
Table 7 Sugarcane production aspects expected for 2010 and 2020 considering the National Energy Plan 2030 (NEP) -and the National Plan on Climate Change (NPCC) scenarios.
s t c e p s a n o i t c u d o r P
0 1 0
2 2020
s o i r a n e c S P
E
N NPCC NEP NPCC
0 1 ( s s a m o i
B 6Mg) 518.4 700.3* 1,002.0 1,474.7*
0 1 ( r a g u
S 6Mg) 36.0 44.1* 52.0 92.9*
0 1 ( l o n a h t e o i
B 6m3) 25.5 31.7 51.5 72.9
0 1 ( a e r
Sci. Agric. (Piracicaba, Braz.), v.67, n.1, p.102-116, January/February 2010 Data from the last five years (2005-2009) indicate that
Brazil consumed about 100 Mm3 of bioethanol, between
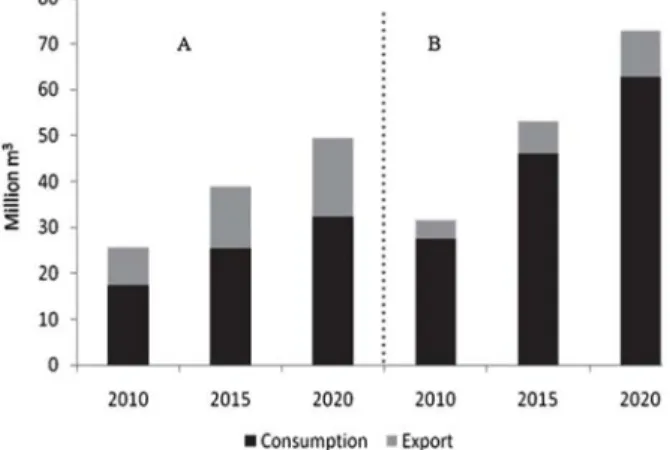
2005 and 2009 (UNICA, 2009). For the next decade, there is a trend for increased bioethanol consumption and ex-ports according to both the NEP (Brasil, 2007) and the NPCC (Brasil, 2008a) - Figure 3. To achieve both sce-narios, two important factors must occur: (i) the
devel-opment of technologies for 2nd generation bioethanol
production and (ii) an expansion in sugarcane produc-tion areas (Brasil, 2007).
The 2nd generation bioethanol production will
ac-count for 20 Mm3 until 2020, increasing the current
pro-ductivity from 0.13 Mm3 yr–1 to 4.53 Mm3 yr–1 in the NEP
scenario. To reach this amount, an increase from 600 to 17,000 Mg of biomass will be needed, which represents a change from 0.6% to 7.3% of total biomass production in 2020 (Brasil, 2007).
The sugarcane expansion will occur differently on both scenarios as shown at Table 8. The NEP scenario
implies an increase of 3.9 Mha to reach the 52 Mm3 of
bioethanol, while an additional area of 11 Mha would be needed to produce 73 Mm3 from 1st and 2nd
genera-tion biofuel in the NPCC scenario (Table 8). Expansion will consider the ‘Sugarcane Agroecological Zoning’, in which areas protected by Brazilian environmental law such as the Amazon and Pantanal biomes will not be used (EMBRAPA, 2009). For offset estimates, both sce-narios were considered. According to NEP, Brazil will
consume around 230 Mm3 of 1st generation bioethanol
and 20 Mm3 of 2nd generation cellulosic bioethanol for
energy proposes over the next decade (Brasil, 2007).
Con-sidering that 1 m3 of anhydrous bioethanol will avoid
2.11 Mg CO2-eq m–3 on 2020 (Macedo et al., 2008), Brazil will offset 527.5 Mt CO2-eq replacing fossil fuel to sug-arcane bioethanol in the next decade on NEP scenario. In the NPCC scenario, bioethanol consumption will in-crease significantly until 2020, reaching 63 Mm3. For the
2010-2020 projection, 501 Mm3 bioethanol (1st and 2nd
gen-eration) will be necessary to supply domestic demand. Considering the same factors applied to the NEP
sce-nario, Brazil will offset 1,057 Mt CO2-eq in the NPCC
Table 8 - Estimates of the expansion area planted with the main oilseeds for biodiesel production in Brazil.
d e e s l i o / l i
O Oilseedyield* Oilyield Biodiesel(Mm
3) Area(1,000ha)
P E
N NPCC NEP NPCC % ---Mgha–1year–1---------
--d e e s l i
O 2010
n a e b y o
S 19 2.2 0.42 1.85 2.12 4,421.1 5,062.2 m
l a
P 27 15.0 4.05 0.14 0.16 33.8 38.8 n
a e b r o t r a
C 46 1.5 0.69 0.09 0.10 126.1 146.4 r
e w o l f n u
S 44 1.6 0.70 0.02 0.03 31.3 35.5 a
e r a l a t o
T 4,612.2 5,282.9
d e e s l i
O 2015
n a e b y o
S 20 2.2 0.44 2.39 2.50 5,440.9 5,670.5 m
l a
P 28 15.0 4.20 0.41 0.43 97.1 101.4 n
a e b r o t r a
C 47 1.5 0.71 0.15 0.16 212.8 221.3 r
e w o l f n u
S 45 1.6 0.72 0.04 0.04 48.6 51.4 a
e r a l a t o
T 5,799.4 6,044.5
d e e s l i
O 2020
n a e b y o
S 21 2.2 0.46 2.64 2.81 5,716.5 6,086.6 m
l a
P 28 15.0 4.20 1.06 1.13 252.9 269.5 n
a e b r o t r a
C 48 1.5 0.72 0.23 0.24 318.1 338.9 r
e w o l f n u
S 46 1.6 0.74 0.05 0.06 73.4 77.4 a
e r a l a t o
T 6,360.7 6,772.4
Source: IBGE, 2008. NEP: National Energy Plan - 2030. NPCC: National Plan on Climate Change. Figure 3 - Estimates of Brazilian domestic consumption and
scenario. Besides future projections, 232 Mt CO2-eq were already avoided in the 2005-2009 period, considering bioethanol for transport, surplus electricity and surplus bagasses. This is a significant amount, considering that all avoided emissions from 1975 to 2000 added up to 630 Mt CO2-eq (Cerri et al., 2009).
In addition to the important role of fossil fuel sub-stitution, other components of bioethanol production help mitigate GHG emissions. Bagasse, a fibrous resi-due remaining from sugarcane crushing, is used to gen-erate electric power and steam for processing ethanol. Ethanol plants, through improvements in boiler effi-ciency, have increasingly exported bagasse-derived sur-plus electricity. This happens especially in periods of the year when hydroelectric dams are at low levels, thus substituting other energy sources such as thermal plants. Therefore, co-generation represents an increasingly sig-nificant role in avoiding GHG emissions from power generation. When current and predicted surplus electric-ity potentials are considered (Macedo and Seabra, 2008),
153 Mt CO2-eq (NEP scenario) and 283 Mt CO2-eq
(NPCC scenario) could be avoided through cogenera-tion.
Biodiesel
The Brazilian federal government has created the National Biodiesel Production and Use Program (PNPB) aiming at the implementation of sustainable pro-duction and use of biodiesel. Focusing on this issue, a federal law was passed in 2005 in order to establish the addition of 2% and 5% biodiesel to the diesel oil in 2008 and 2013, respectively. Thus, a preliminary estimate
showed that there was a need to produce 0.80 Mm3 of
biodiesel in 2008 and 2 Mm3 in 2013 to supply the
de-mand established (Brasil, 2004). Three years after the first estimate, data published in NPCC reported that, con-sidering the addition of 2%, 3% and 5% biodiesel to
fos-sil diesel, the projected demand was 1.08 and 2.81 Mm3
in 2008 and 2013, respectively (Brasil, 2008a).
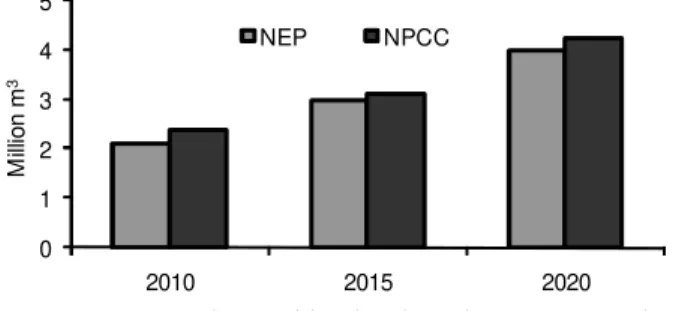
Figure 4 represents an estimate of the requirement for biodiesel production to supply domestic demand by 2020. Estimates for this sector were not so different be-cause the calculations are performed based on projec-tions of the federal government. According to demand
studies prepared by the NEP in Brazil, annual
produc-tion of biodiesel until 2020 was estimated at 3.90 Mm3
(first scenario), whereas the percentage of blending with diesel in 2010 will be 5%, while in 2015 and 2020 it will be 6% (Brasil, 2007). Data of NPCC were slightly higher (second scenario), in which annual production until 2020 was estimated at 4.25 Mm3 (Brasil, 2008a). Brazil is seen
as a future leader in biodiesel production due to its ex-cellent climate and soil conditions, and vast territorial extension appropriate for a variety of oil crops. Within this context, some oilseeds like soybean, palm, castor bean and sunflower have received greater focus by the National Program for Production and Use of Biodiesel (PNPB, 2004).
Besides oil crops, a promising biodiesel feedstock is beef tallow. Tallow is a greasy residue consisting of trig-lycerides, mainly palmitic (30%), stearic (20-25%) and oleic acid (45%) (Graboski and McCormick, 1998). Each animal slaughtered provides an average of 15 kg of tal-low (RBB, 2006). Assuming a yield of 80% in processing tallow to biodiesel and the herd numbers estimated the potential for tallow-derived biodiesel production in the
2010-2020 period was calculated as 9.69 Mm3.
The estimate in NEP and NPCC scenarios (Figure 5) showed the estimation for biodiesel production from five raw materials: beef tallow (27%), soybean (58%), palm (10%), castor bean (4%) and sunflower (1%). This calculation considered the production of each oilseed in the Brazilian territory (Brasil, 2007) and the amount of animals slaughtered until 2020 in Brazil. We assumed a decrease in the use of soybean as feedstock in the long term, and an increase in the participation of other crops, especially palm. The total of biodiesel production in the
2010-2020 period was calculated as 33.33 Mm3 in NEP
scenario and 35.23 Mm3 in NPCC scenario. The baseline
was estimated by considering the differences in combus-tion efficiency between biodiesel and petroleum diesel. Calculation using calorific values and densities of biodiesel and petroleum diesel showed that the energy content of 1 m3 biodiesel is equal to that of 0.889 m3 (0.78
Mg) petroleum diesel. The quantity of biodiesel from
tallow and oil crops would replace 31.31 Mm3 of fossil
diesel. Considering that 1 m3 of biodiesel will avoid 3.14
Figure 5 - Estimated biodiesel production in the National Energy Plan – 2030 (NEP) and in the National Plan on Climate Change (NPCC) scenarios considering the main feedstocks in Brazil.
0 8 16 24 32 40
Beef tallow Soybean Palm Castor bean Sunflower Total Production
NEP NPCC
M
illio
n
m
3
Figure 4 - Estimated annual biodiesel production in Brazil in 2010, 2015 and 2020 considering the National Energy Plan – 2030 (NEP) and the National Plan on Climate Change (NPCC). Adapted from Brasil (2007); Brasil (2008a).
0 1 2 3 4 5
2010 2015 2020
NEP NPCC
M
ill
io
n
m
Sci. Agric. (Piracicaba, Braz.), v.67, n.1, p.102-116, January/February 2010 Mg CO2-eq m-3, Brazil will offset ranging from 93 up to
98 Mt CO2-eq replacing fossil diesel to biodiesel in the next decade.
According to the National Energy Plan (Brasil, 2007), Brazil will need to expand the area planted with oilseeds to meet its domestic demand for biodiesel production. Livestock intensification in currently underutilized pastureland could allow the expansion of grains and oil seeds. Table 8 presents an estimate of the expansion area needed to meet the demand for biodiesel production un-til 2020, considering the capacity of oilseed production (IBGE, 2008). In accordance with earlier projections, the requirements for expansion areas in the NEP and NPCC scenarios will be 6.4 and 6.8 Mha, respectively.
Total mitigation potential for Brazil
On November 13th 2009, Brazilian authorities
an-nounced that the country will target a reduction in its greenhouse gas emissions of between 36.1 and 38.9% from projected levels in 2020; this will be done on a volun-tary basis, and that Brazil will not accept mandatory cuts. Brazilian Environment Minister said that the ma-jority of Brazil’s emission cuts will come from slowing deforestation (20.9% coming from the reduction in the Amazon and 3.9% of the Cerrado), then followed by a cut in the energy sector (from 6.1% to 7.7%), agriculture (from 4.9% to 6.1%) and steel (0.3% to 0.4%). Total cuts would be between 36.1% and 38.9%, assuming a GDP growth between 4% and 6%. However, Brazilian authori-ties did not precise the level of GHG emissions expected for the year 2020 under a BAU option for all sectors, and real emissions reductions will depend on the baseline adopted and on the assumptions used to project the future emissions’ trajectory. Assuming that Brazil-ian authorities also used the BAU-NPCC baseline for deforestation (the average rates from 1996 to 2005, i.e. 19,533 km2 yr–1 for the Amazon region and that they
con-sidered the Mitigation-Committed scenario, i.e. a reduc-tion of 80% in 2020 in relareduc-tion to the BAU-NPCC, the
avoided emission from Amazon deforestation would be
around 510 Mt CO2 eq. This estimate is coherent with
the value announced by the Government: a total
mitiga-tion ranging from 975 to 1062 Mt CO2-eq in 2020 with
20.9% coming from the reduction in the Amazon. Us-ing Government numbers, the Amazonian deforestation
reduction is 669 MtCO2-eq. The reduction target to be
met by other sectors is in the range of 306-383 MtCO2
-eq. The potential reduction in agriculture (4.9 to 6.1%) proposed by the Government corresponds to a
mitiga-tion ranging from 133–166 MtCO2-eq.
We calculated (Table 9) that the potential of reduc-tion in the agriculture sector may vary from 178.3 to 445
Mt CO2-eq in the year of 2020 in relation to a BAU
hy-pothesis. Therefore, our estimates for agriculture and livestock are larger than Government figures, and this difference is because in our understanding, biofuels are directly related to the agriculture rather than the energy sector. Our results represent a reduction of 8.8 to 22.0 % in relation to the total national GHG emissions cal-culated for 2005 by Cerri et al. (2009).
Two types of mitigation actions can be considered: i) increasing C sinks, and ii) reducing emissions. Increas-ing C sinks represents 19 to 39% of the mitigation po-tential, and reducing emissions, 81 to 61%. A large part that corresponds to 106 – 195 Mt CO2-eq of total poten-tial from emission reductions is due to fossil fuel offset from ethanol and biodiesel. These numbers emphasize that bioenergy represents a major opportunity for Bra-zil and would contribute to global warming mitigation.
The potential of sinks is high, but perhaps more dif-ficult to verify, and associated with a large number of agents. Nevertheless, the probability of successful imple-mentation is high, mostly due to co-benefits embedded in those systems, as for instance the erosion control ef-fect of NT systems. In practice, most of those mitiga-tion acmitiga-tions are linked. Slowing down deforestamitiga-tion will decrease new land availability, thus driving the conver-sion from underutilized pastures to cropland or managed
Table 9 - Range of mitigation potential in MtCO2-eq for the 2010-2020 period and for the year 2020.
r o t c e s r o y t i v i t c
A 2010-2020period 2020
O C t M
---- 2-eq ---
--: e r u n a m d n a n o i t a t n e m r e f c i r e t n e k c o t s e v i l e l t t a C t c e f f e e z i s d r e
H 229.2-458.4 31.3-62.5
n o i t a g i t i m l a c i n h c e t l a n o i t i d d
A 33.4-86.5 6.3-11.6
n o i t a t s e r o f e r / n o i t a t s e r o f f
A 52.4-1,000 5.2-100
n o i s n a p x e e g a l l i t -o
N 69.3-277.1 11.5-46.2
e c i
R 25 2.5
) n o i t a r t s e u q e S C ( t s e v r a h d e n r u b n u o t d e n r u b f o n o i s r e v n o C : e n a c r a g u
S 375-579 15.9-27.6
y g r e n e o i B ) t e s f f o ( e n a c r a g u s m o r f l o n a h t
E 527.5-1,057 68.5-132.6
e s s a g a b m o r f n o i t a r e n e g o
C 153-283 26.0-50.5
l e s e i d o i
B 93-98 11.1-11.9
e g n a r l l u
forests. Those patterns will certainly change from state to state according to the dominant practices, but also to commitments taken at the state level. For instance, the state of São Paulo has recently written into law a reduc-tion of 20% of 2005 GHG emissions, by 2020. As defor-estation is not a significant issue in São Paulo, the effort will have to be focused almost exclusively on the remain-ing sectors: Energy, Industries, Waste and Agriculture. According to the State governor, the first estimates of
the effort correspond to a reduction from 122 Mt CO2
-eq (in 2005) to 98 Mt CO2-eq. Agriculture will certainly have an important role in helping reduce emissions. As calculated above for Brazil, the mitigation potential of the agricultural sector and managed forests represent a maximum of 22% at the national scale, showing that such a commitment is not an easy target. Fortunately, São Paulo state has an important share of the mitigation po-tential, mainly concerning sugarcane cropping (and thus bioenergy) and managed forests. This last sector would certainly merit an even more ambitious goal for 2020.
Recommendations for policy makers and future re-search needs
Brazil needs to maintain and even increase actions for GHG emission reduction from deforestation. In this aspect, the Federal Government has announced am-bitious targets to reach this goal. More efforts need to be implemented in already cleared areas, mainly in the livestock sector. There is a need to not only increase productivity, but at the same time decrease GHG emis-sions associated to that activity. In doing so, a more efficient use of pastures could free more land to pro-duce food, fiber and biofuels without increasing defor-estation rates.
The new available land for agricultural production must be managed in a GHG-friendly way, with wide-spread adoption of best management practices. Moreover, the present areas under agriculture also need to increase productivity while not compromising the GHG emis-sions, i.e., more productivity with less GHG emission as-sociated to the agrosystem and food supply chains. Thus, Brazil needs a strategic plan to increase fibber, food and biofuel productivity and at the same time reduce emis-sions associated to these agribusinesses activities. Once this strategic plan is implemented, it would not only pro-mote environment benefits but also aggregate value to the exported bio-products. However, to reach this strategic plan the Government must allocate financial resources and technical support to help producers place Brazil in a better environmental position among other countries. It will be a major challenge, besides promoting those actions, to adequately monitor, report and validate emission re-ductions from the different sectors.
Acknowledgements
Research works that lead to this publication was sup-ported partly by grants and fellowships from CNPq, FAPESP, CAPES/COFECUB.
References
Associação Brasileira de Produtores de Florestas Plantadas [ABRAF]. 2007. ABRAF Statistical Yearbook 2007: Base year 2006. ABRAF, Brasilia, DF, Brazil. 80p. Associação Brasileira de Produtores de Florestas Plantadas [ABRAF]. 2008. ABRAF Statistical Yearbook 2008: Base year 2007. ABRAF, Brasilia, DF, Brazil. 90p. Associação Brasileira de Produtores de Florestas Plantadas [ABRAF]. 2009. ABRAF Statistical Yearbook 2009: Base year 2008. ABRAF, Brasilia, DF, Brazil. 31p.
Bayer, C.; Martin-Neto, L.; Mielniczuk, J.; Pavinato, A.; Dieckow, J. 2006. Carbon sequestration in two Brazilian Cerrado soils under no-till. Soil & Tillage Research86: 237-245.
Bernoux, M.; Carvalho, M.C.S.; Volkoff, B.; Cerri, C.C. 2001. CO2 emission from mineral soils following land-cover change in Brazil. Global Change Biology 7: 779-787.
Bernoux, M.; Carvalho, M.C.S.; Volkoff, B.; Cerri, C.C. 2002. Brazil’s soil carbon stocks. Soil Science Society of America Journal 66: 888-896.
Bernoux, M;, Cerri, C.C.; Cerri, C.E.P.; Siqueira Neto, M.; Metay, A.; Perrin, A.S.; Scopel, E.; Razafimbelo, T.; Blavet, D.; Piccolo, M.C.; Pavei, M.; Milne, E. 2006. Cropping systems, carbon sequestration and erosion in Brazil, a review. Agronomy for Sustainable Development 26: 1-8.
Bernoux, M.; Branca, G.; Carro, A.; Lipper, L.; Smith, G.; Bockel, L. 2010. Proposal for ex-ante greenhouse gas balance of agriculture and forestry development programs: EX-ACT (EX-Ante Carbon-Balance Tool). Scientia Agricola 67: 31-40. Brasil. Lei nº. 11.097, de 13 de janeiro de 2005. Available at: http:/
/www.mct.gov.br/legis/leis/11097_2005.htm [Accessed Jul. 17, 2005].
Brasil. Ministério de Minas e Energia. 2006. Emissões de Metano do Cultivo de Arroz. In: Primeiro Inventário Brasileiro de Emissões Antrópicas de Gases do Efeito Estufa. Relatório de referência. Ministério de Minas e Energia, Brasília, DF, Brazil. Brasil. Ministério de Minas e Energia. 2007. .Plano Nacional de Energia
2030. Ministério de Minas e Energia, Brasília, DF, Brazil. 12v. Brasil. Governo Federal - Comitê Interministerial sobre Mudança
do Clima. Plano Nacional sobre Mudança do Clima (PNMC). 2008a. Governo Federal, Brasília, DF, Brazil. 132p. Available at: http://www.forumclima.org.br/arquivos/plano-nacional-mc.pdf [Accessed Jan. 11, 2009]
Brasil. Ministério da Agricultura e Pecuária. 2008b. Projeções do Agronegócio Mundial e Brasil 2006/2007 - 2017/2018. Relatório de referência. Ministério da Agricultura e Pecuária e Abastecimento, Brasília, DF, Brazil. 58p.
Brasil. Ministry of Science and Technology. General Coordination on Global Climate Change. 2004. Brazil´s Initial National Communication to the United Nations Framework Convention on Climate Change. Ministério da Ciência e Tecnologia, Brasília, DF, Brazil. 271p.
Carvalho, J.L.N.; Cerri, C.E.P.; Feigl, B.J.; Piccolo, M.C.; Godinho, V.P.; Cerri, C.C. 2009. Carbon sequestration in agricultural soils in the Cerrado region of the Brazilian Amazon. Soil & Tillage Research 103: 342-349.
Cerri, C.C.; Bernoux, M.; Cerri, C.E.P.; Feller, C. 2004. Carbon cycling and sequestration opportunities in South America: The case of Brazil. Soil Use and Management 20: 248-254. Cerri, C.C.; Maia, S.M.F.; Galdos, M.V.; Cerri, C.E.P.; Feigl, B.J.;
Bernoux, M. 2009. Brazilian greenhouse gas emissions: the importance of agriculture and livestock. Scientia Agricola 66: 831-843.
Cerri, C.E.P.; Sparovek, G.; Bernoux, M.; Easterling, W.E.; Melillo, J.M.; Cerri, C.C. 2007. Tropical agriculture and global warming: impacts and mitigation options. Scientia Agricola 64: 83-89. Coelho, S.T.; Bolognini, M.F.; Paletta, C.E.M. 2000. Proalcool:
The Brazilian Alcohol Program. Green Times 7: 1-2.