A novel polar-based human face
recognition computational model
Y. Zana
1, J.P. Mena-Chalco
2and R.M. Cesar Jr.
21
Núcleo de Cognição e Sistemas Complexos, Centro de Matemática, Computação e Cognição,
Universidade Federal do ABC, Santo André, SP, Brasil
2
Departamento de Ciências da Computação, Instituto de Matemática e Estatística, Universidade de São
Paulo, São Paulo, SP, Brasil
Correspondence to: Y. Zana, Núcleo de Cognição e Sistemas Complexos, Centro de Matemática,
Computação e Cognição, UFABC, Rua Catequese, 242, 09090-400 Santo André, SP, Brasil
Fax: +55-11-4437-8403. E-mail: [email protected]
Motivated by a recently proposed biologically inspired face recognition approach, we investigated the relation between human behavior and a computational model based on Fourier-Bessel (FB) spatial patterns. We measured human recognition performance of FB filtered face images using an 8-alternative forced-choice method. Test stimuli were generated by converting the images from the spatial to the FB domain, filtering the resulting coefficients with a band-pass filter, and finally taking the inverse FB transformation of the filtered coefficients. The performance of the computational models was tested using a simulation of the psychophysical experiment. In the FB model, face images were first filtered by simulated V1- type neurons and later analyzed globally for their content of FB components. In general, there was a higher human contrast sensitivity to radially than to angularly filtered images, but both functions peaked at the 11.3-16 frequency interval. The FB-based model presented similar behavior with regard to peak position and relative sensitivity, but had a wider frequency band width and a narrower response range. The response pattern of two alternative models, based on local FB analysis and on raw luminance, strongly diverged from the human behavior patterns. These results suggest that human performance can be constrained by the type of information conveyed by polar patterns, and consequently that humans might use FB-like spatial patterns in face processing. Key words: Face processing; Visual perception; Cognitive processes; Computational modeling
Y. Zana was supported by FAPESP (#03/07519-0). R.M. Cesar Jr. was supported by FAPESP (#2005/00587-5) and by CNPq (#300722/98-2, #474596/2004-4, and #491323/2005-0). J.P. Mena-Chalco was supported by CAPES.
Part of the results from preliminary tests were first reported at the 7th IEEE International Conference on Automatic Face and Gesture Recognition, Southampton, 2006.
Received August 17, 2008. Accepted April 28, 2009
Introduction
Knowledge of which visual features are used for the recognition of different types of objects is crucial for under-standing human visual processing and can indicate useful features for automatic face recognition systems. On the other hand, biologically motivated computational algorithms may be explored as test platform for modeling human visual mechanisms. Face recognition is one of the best understood cognitive tasks (1), due in part to the identifica-tion of several critical spatial components, although the
In the current study, we investigated the possibility that spatial polar-defined components are selectively used in human face processing. Moreover, we compared the per-formance of human observers to that of a polar frequency-based face recognition model. The main motivation for this study was to improve the predictability value and increase the biologically inspired content of high-level visual tasks such as human object recognition models (7). The main contributions of this study were a) demonstrating for the first time that human visual face processing could involve the selective use of polar frequency components (8), and b) reporting direct empirical support for a recently pro-posed computational face recognition model (6).
In the next section, we present a brief review of the literature relevant to face recognition and spatial frequency analysis. We then describe the Fourier-Bessel (FB) trans-formation and detail our experimental design and stimulus generation. Finally, we describe our results and discuss their implications.
Selective spatial frequency usage in face recognition
In classical studies of the human visual system, the luminance of test stimuli is modulated by a sine function in Cartesian coordinates (9). This choice is based on the shape of the receptive fields and on the sensitivity of retinal ganglion cells and of the cells in area V1 of the brain (10). In accordance with this view, all previous studies (to the best of our knowledge) searched for the fundamental components of human face processing in the Cartesian frequency domain. Such experiments typically employed face images whose spatial frequency content was manipu-lated using band-pass Fourier filters. Most of these studies confirmed that face recognition is sensitive to the spatial frequency content of the images and concluded that the mid-range spatial frequencies, between 10 and 20 cycles per face, are the most important for this task (3,11-13). This knowledge was essential for a comprehensive understand-ing of cognitive function since it delimited the quantity of information available in higher level stages.
However, more recent physiological and psychophysi-cal studies have provided evidence about the tuning of visual cells to stimuli defined in coordinate systems other than the Cartesian ones. Sensitivity to complex shapes, like stars, rather than to simple Cartesian stimuli, like bars, was observed in several cells in the visual area V4 of macaque monkeys by Kobatake and Tanaka (14). At the same time, Gallant et al. (4,15) probed cells in area V4 with Cartesian, polar, or hyperbolic gratings and showed speci-ficity for these types of stimuli. A few years later, Mahon and De Valois (5) extended the study to lower processing levels of the visual pathway and found that populations of
cells in areas LGN, V1 and V2 are also tuned to these types of stimuli. The physiological evidence about the specificity of cells to non-Cartesian stimuli was further supported by psychophysical experiments using Glass patterns. The stimuli used by Wilson et al. (16,17) consisted of a pattern of random dots presented within a circular window that generated a percept of global structure of Cartesian, con-centric, radial, and hyperbolic patterns. Detection thresh-old was measured by degrading the patterns by the addi-tion of noise. It was found that threshold decreases from Cartesian to hyperbolic, radial and concentric patterns. Measurements of the thresholds as a function of the stim-ulated area showed a 3 to 4 visual degrees global pooling of orientation information in the detection of radial and concentric patterns, but only local pooling in the detection of parallel patterns. Similar results were obtained when subjects had to judge which of two square arrays of Gabor contained global structures, with higher sensitivity found in concentric than to radial patterns (18).
Stimulated by these latter studies, we first determined the contrast sensitivity functions to fundamental patterns defined in polar coordinates (19) and later developed an automatic face recognition system based on polar fre-quency features, as extracted by FB transformation and dissimilar representation (6,20). This representation sys-tem was thoroughly tested on large data sets and achieved state of the art performance when compared to previous algorithms (21). In the current study, we propose a compu-tational model based on a simplification of an automatic system and validate it by comparing its performance in a classical face recognition task with that of humans.
Fourier-Bessel transformation
This section briefly reviews the FB approach intro-duced by Zana and Cesar-Jr. (6). The reader is referred to the original paper for more details. Let f (x,y) be the region of interest in the image. FB transform analysis starts by converting the image coordinates from Cartesian (x,y)
to polar (r, θ) domain. Let (x0, y0) be the origin of the
Cartesian image. The polar coordinates necessary to ob-tain the new image representation f (r,θ) are defined as
θ = tan-1(y-y
0x-x0) and .
The f (r,θ) function, r≤1, is represented by the two-dimensional FB series as (6)
(Equation 1)
where Jnis the Bessel function of order n and αn,iis the ith
satisfy-ing Jn (αn,i) = 0 is the radial distance to the edge of the
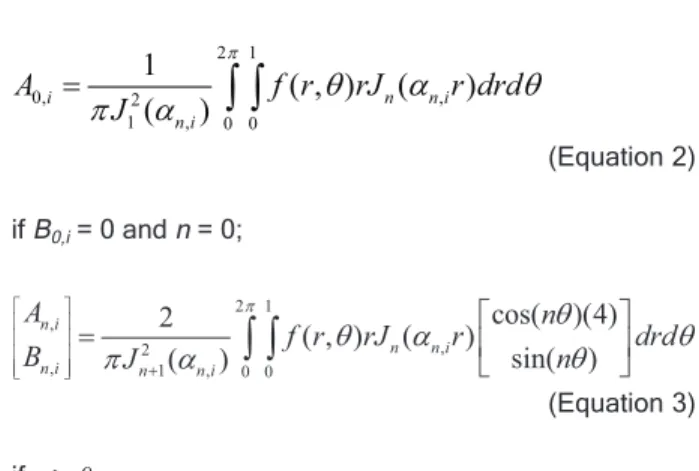
image. The orthogonal coefficients An,iand Bn,iare given by
(Equation 2)
if B0,i = 0 and n = 0;
(Equation 3)
if n > 0...
Images can be FB transformed up to any Bessel order and root with any angular and radial resolution. Each ex-tracted coefficient (or Bessel mode) is described by a Bessel order and a Bessel root number. FB modes are represented by two coefficients, except those of order zero that are represented by a single coefficient1. In the polar frequency domain, the Bessel root is related to the radial frequency (number of cycles along the image radius) while the Bessel order is related to the angular frequency (number of cycles around the center of the image). Figure 1 shows plots of a few FB patterns. In the proposed model, the extracted FB components are related to the output of the cortical neurons tuned to radial and angular spatial patterns (4,5,15).
Subjects and Methods
Psychophysical experiments
Observers and equipment. Two of the authors partici-pated in the tests. Observer S2 had no previous experi-ence in psychophysical experiments, while observer S1 had a few years of experience. However, both were famil-iarized with the non-manipulated stimuli prior to data col-lection until recognizing with ease all the images. The stimuli were generated on a Philips 2020p color monitor and the graphics board was set at a resolution of 1024 x 768 pixels with a frame rate of 85 Hz. Viewing was binocu-lar from a distance of 75 cm. The average luminance of the display was 10 cd/m2 in an otherwise dark environment. To increase the number of luminance levels available from 256 to 4096, the red and blue color channels of the
graph-1,0 1,1 1,2
2,0 2,1 2,2
3,0 3,1 3,2
Figure 1. Figure 1. Figure 1. Figure 1.
Figure 1. Spatial representation of Fourier-Bessel modes. The pairs of numbers indicate the Bessel root and order, respectively.
ics board were combined in a resistance network (22). The combined signal was connected to the green input in the monitor and gamma was corrected to produce a linear luminance-modulated image. The experiments were pro-grammed in the LabView® environment.
Stimuli. We used eight face images from the FERET face database (23). The criteria for the selection were: male gender, age between 20 and 40 years, neutral ex-pression, Caucasian race, and absence of any special marks such as beard, eyeglasses, etc. Using the ground-truth eye coordinates, we translated, rotated, and scaled the images so that the eyes were registered at specific locations. Next, the images were cropped to a 130 x 150-pixel size and a mask (zero value) was applied to remove most of the hair and background. The unmasked region was histogram equalized and normalized to zero mean (Figure 2). From the viewing distance, each image sub-tended 2.9° of horizontal visual degrees. Signal strength was defined as the image contrast variance (12). Signal strength was manipulated by multiplying the image data by an appropriate constant and converting the contrast val-ues to luminance valval-ues.
Test stimuli were generated by first FB transforming
1The number of coefficients that results from ith Bessel order and jth Bessel root FB transformation is j(i+1)*2-i. Notice that the lowest Bessel order is 1,
Figure 2. Figure 2. Figure 2. Figure 2.
Figure 2. Face stimuli used in the experiments. All images are set to the same mean luminance and contrast variance. A, The original normalized face images in the spatial layout displayed to the observers. B, Radial and C, angular filtering of the image defined by a black contour line in A. Numbers below the images indicate the respective central frequency of the filters.
A. Unmanipulated
A. Unmanipulated
A. Unmanipulated
A. Unmanipulated
A. Unmanipulated
B. FB radial filtering
B. FB radial filtering
B. FB radial filtering
B. FB radial filtering
B. FB radial filtering
4.0
5.6
8.0
C. FB angular filtering
C. FB angular filtering
C. FB angular filtering
C. FB angular filtering
C. FB angular filtering
11.3
16.0
22.6
4.0
5.6
8.0
the original images from the spatial domain, as described in the Fourier-Bessel transformation Section. The resulting coefficients were filtered by three-octave-Gaussian band-pass filters centered at frequencies of 4, 5.6, 8, 11.3, 16, and 22.6 (half-octave steps). The final images were ob-tained by taking the inverse FB transformation of the filtered coefficients. Radial and angular filtering was achieved by multiplying the Gaussian filters along the Bessel root or Bessel order dimension, respectively. Ex-amples of radially and angularly filtered images are shown in Figure 2. Unfiltered FB inverse transformed images were tested to establish a reference performance.
Procedure. Identification thresholds were determined using a two-interval eight-alternative forced-choice para-digm. Observers were thoroughly familiarized with the non-manipulated images. At the start of a trial, a brief tone indicated the presentation of the test stimulus. The test image was exposed for 1000 ms and followed by a 2500-ms presentation of a set of eight non-manipulated images. The images were arranged around the region where the test image had been displayed (see Figure 2 for the image layout) and included the target image. Observers identified the target image by pressing one of eight keys on the computer keypad. Decision time was not limited (usually less than 2 s). The intertrial interval was set at 1000 ms. After three consecutive correct responses, the contrast of the target stimulus was decreased by a factor of 0.1 log units, and after each incorrect response the contrast was increased by the same factor. Auditory feedback was given for an incorrect response (a short low-frequency “beep” tone emitted whenever the subject chose the wrong alternative). A threshold estimate was obtained as the mean of the last 5 reversals of a total of 6. Each threshold point was measured five times.
Face recognition models
The computational model was implemented in the Matlab® environment and consisted of two main stages: a) local Cartesian filtering and b) FB coefficient extraction. Thus, an input image is sequentially processed and its final representation is the vector of FB coefficients. In our implementation, image processing and learning of a single face from ≈2000 subjects requires approximately 4 h (PC Pentium IV, 2.8 GHz CPU). Recognition of a test image is performed in approximately 5 s. It is important to empha-size that all simulations were carried out using Matlab®, which is a programming environment for rapid prototyping, but not to create efficient implementations.
Local Cartesian filtering
Visual polar analysis supposedly occurs after the initial
processing by V1 cells (4,16) (see Ref. 5), hence it is reason-able to precede the global FB pattern extraction with a local Cartesian filtering. Moreover, the contrast sensitivity func-tions of the human visual system favors spatial frequencies of approximately four cycles per visual angle (24), while the FB transform weight patterns of different frequencies equally. We simulated local Cartesian filtering using a conven-tional neural model of V1 area cells. The model is based on a filtering stage, followed by full-wave rectification (16). In the first stage, images were convolved with spatial filters that resemble the receptive fields of simple cells (25). A filter RF with preferred spatial frequency iand location (x,y) was specified as
(Equation 4)
All parameters in Equation 4 were estimated by mask-ing experiments (26,27). The convolution results were full-wave rectified (taking the absolute value) in order to con-sider both ON and OFF type cells. This filter-rectification sequence was repeated for each of six frequencies and all outputs were summed. Thus, the final model response was the output matrix.
Extraction of FB coefficients
After neural filtering of the simulated V1 cells, images were FB transformed up to the 30th Bessel order and root, with angular resolution of 3° and radial resolution of one pixel, yielding 1830 coefficients. These coefficients repre-sent a frequency range of up to 30 cycles/image of angular and radial frequency. This frequency range was selected since perceptually it preserved most of the original image information. We tested two forms of FB coefficient extrac-tion: global (6) and local (21). In the global version, the image is FB transformed as a whole, i.e., the FB coeffi-cients are extracted from a circular image-wide area cen-tered on the face image. Local FB analysis is performed by extracting FB coefficients from a medium size circular area centered on the right eye, left eye and between the eyes. The three locally extracted coefficients are then joined to form a single vector of features. Illustrative examples are shown in Figure 3. These face regions were chosen on the basis of previous studies that showed their importance for face identification (21,28).
Other model versions
be-Figure 3. Figure 3. Figure 3. Figure 3.
Figure 3. Face regions analyzed by the global and local Fourier-Bessel models. Regions outside the face area, but in the radius range, were cropped only in this illustration.
Figure 4. Figure 4.Figure 4. Figure 4.
Figure 4. Face recognition contrast sensitivity functions of subjects S1 and S2. Circles and triangles rep-resent radial and angular filtering, respectively. Each point represents the mean of 5 measurements. Er-ror bars represent ± standard erEr-ror of the mean.
havior, we built a baseline luminance-based model, i.e., we replaced the FB coefficients with the pixel luminance value. This model assumes no specific processing and can demonstrate the gain obtained by using FB analysis. For both FB and raw luminance versions, we also tested models with and without prior local Cartesian filtering. This type of comparison might clarify the necessity of an initial local Cartesian analysis.
Simulations
The psychophysical experiment was simulated in such a way that the input images and the experimental procedures were as close as possible to those used with humans. The first step was training, in which the eight unfiltered images were processed and stored in the memory with their respec-tive identity label. In the testing stage, all images were manipulated in the same manner as in the psychophysical experiment. In a typical trial, an unidentified target image was given as input to the model and processed. The final FB representation of the image was compared to the eight stored images and the identity of the closest image (in Euclidean terms) was attributed to the target image. The only difference from the real psychophysical experiment (besides the unnecessary use of the Lookup-table to correct the non-linearity of the display) was the addition of white noise to the target images, assuming a similar noise level in the observers’ visual system. The noise had a 0.15 standard
deviation and values outside the ±2.0 standard deviation range were discarded. Classification of test images was performed by calculating the cross-correlation between the target and learned images, and the label of the image that achieved the highest value was selected. This strategy yielded optimal performances in previous studies (12).
Results and Discussion
Human results
Figure 4 shows the face recognition performance of the two subjects. The contrast sensitivity function of observer S1 to radially filtered stimuli had a bell-shape and peaked at the 11.3 frequency. The angular contrast sensitivity function was only partially similar. It peaked in about the same region, slightly shifted to higher frequencies. Sensi-tivity was in general lower than that of the radial curve, except at the highest sensitivity point. It also had a nar-rower band-width shape as compared to the radial func-tion. Sensitivity to unfiltered images was higher than to any of the FB filtered images.
Observer S2 showed similar behavioral patterns, but not identical. Both contrast sensitivity functions were bell shaped and centered on middle-range frequencies, with the sensitivity to angularly filtered images being in general lower than that to radially filtered images. This observer differed somewhat from observer S1 in having a wider
band-width response and flatter peak sensitivity to radially filtered images. The only notable difference was the level-ing of the peak sensitivity to filtered images at the level of the sensitivity to unfiltered images. The results of observer S2 mean that the sensitivity to filtered images can be the same as the sensitivity to unfiltered images.
The low variability between the results of the two ob-servers permits drawing conclusion of at least a qualitative nature. First, face recognition is better tuned to mid-range radial and angular frequencies. This result is compatible with previous studies using Cartesian filtering (see Fou-rier-Bessel transformation) and reflects internal (neural) constraints and/or lack of critical identity information at low and high frequencies as used in the human face process-ing (3). Second, sensitivity to images filtered in the angular frequency domain is lower than to images filtered in the radial frequency domain, an exception being the 16 cycle filtering. At the moment, it is not clear what originated this effect. Possible, not excluding, hypotheses are a) that the angular filtering does not preserve as much face identity
information as radial filtering and b) that human face pro-cessing relies more on radial than on angular components. The fact that sensitivity to radially and angularly filtered images can equal the sensitivity to unfiltered images is intriguing, considering that the amount of information in the latter is much higher, and confirms similar results observed by Gold et al. (12). One possible explanation is that filtered images had the same (global) contrast variance as that of unfiltered images, but had regions of higher (local) con-trast. Thus, observers could rely on this type of information to identify the faces. A second, non-excluding, hypothesis is that radial filtering at a specific frequency range empha-sizes (local and/or global) facial features that can help recognition and increase the signal-to-noise ratio.
Computational model results
Figure 5 (top row) shows the performance of the global FB computational models. Without prior local filtering, the model had a very flat sensitivity level for both radial and angular filtering, although the radial curve was always
Figure 5. Figure 5. Figure 5. Figure 5.
higher that the angular curve. When images were filtered by local simulated V1 cells, the radial and angular func-tions peaked at 11.3 frequency and the response range was increased. The contrast sensitivity functions of the latter model are similar to those observed in humans regarding peak location at 11.3 mid-range frequency and the lower sensitivity to angular than to radial filtering.
However, notable differences exist. The global sensi-tivity of the FB model with radial filtering was relatively higher in the low and middle frequency range, and similar to the angular curve at high frequencies. This phenome-non was not observed in the human results at the exact same frequencies, but a parallel pattern of response could be noticed if we ignored the response to the highest frequency. The curves of the FB model notably had a wider frequency band-width than those of humans, but had a smaller response range. The sensitivity to unfiltered im-ages was below peak sensitivity, and therefore filtered images resulted in better recognition performance.
The effect of the Cartesian local processing is theoreti-cally critical: from a physiological point of view, it is not expected that any global processing would be performed prior to a local analysis, and this aspect was confirmed by the relatively poor results of the pure global FB model. The most important difference was related to the flat response of the model to the different frequency filtering and the relatively high sensitivity to high frequencies. Clearly, the approximation to human behavior is a result of the selec-tive frequency filtering properties of the simulated V1 cells’ local filtering.
Figure 5 (middle row) shows the contrast sensitivity functions of the local FB model. Without the prior Cartesian analysis, the response to radially filtered images was not much altered by the change from global to local FB analy-sis, but the radial curve was inverted from a high-pass to a low-pass filter shape. When the local FB analysis was preceded by Cartesian filtering, the radial function had a bell-shape, as in the global FB model, while the angular function had a marked high-pass profile. In both model versions, with and without the Cartesian filtering stage, the sensitivity at high frequencies was higher to angular than to radial filtering. These results suggest that of the four FB-based model versions, Cartesian filtering followed by a global FB analysis better describes human face process-ing. It should be noted that in a previous large study (21), a local FB-based algorithm outperformed a system based on global FB analysis, but those systems were much more complex than the models proposed here.
As a baseline for the FB model performance, we tested a model based on only the raw luminance information (Figure 5, bottom row). Without Cartesian processing, the
bell-shaped angular curve bore some resemblance to the human curve, but the angular curve was completely dis-tinctive. The addition of prior Cartesian processing to this model approximated its response to that of humans, as the sensitivity to high-frequency angular stimuli surpassed the sensitivity to radial stimuli. Still, significant differences persisted. The radial and angular curves had low- and high-pass shapes, respectively, with peaks at 5.6 and 16 cycles, in contrast to the bell-shaped human curves with high sensitivity centered in the mid-frequency range.
It is interesting to note that for the three models tested in which a Cartesian filtering step was utilized, the sensitiv-ity to unfiltered images was below the peak sensitivsensitiv-ity to radially and angularly filtered images. This result indicates that from a purely informative point of view, it is advanta-geous to rely on the recognition of face images on the basis of a strict polar frequency range. This phenomenon may be directly related to the action of the simulated V1 cells in the local FB and luminance-based models, but not in the global FB-based model. Currently, available data do not permit us to conclude if humans are relatively less sensi-tive to unfiltered images or more sensisensi-tive to FB filtered images. But, it is certain that humans benefit less from polar filtering compared to the models under consider-ation, a fact suggesting that the FB model is incomplete.
Conclusions and future directions
The computational system proposed here incorporates several well-known properties of the human visual pro-cessing system: a) it performs partially local sampling of the eyes’ region (29,30), b) it decomposes visual stimuli into components that represent polar spatial patterns char-acteristic of cells in the LGN and V1 to V4 brain areas (4,5), and c) the polar representation is mapped to a dissimilarity space, similar to the previously proposed representation of visual objects by humans (31-33). This type of representa-tion implies dynamic and plastic general characteristics of the system since each new labeled face image is mapped into the representation of all previous images, thus repli-cating characteristics encountered in the human memory system. In previous studies, the system performed face recognition tasks with a very low error rate, demonstrated relative invariability of expression, age and luminance changes, and was highly robust in response to occlusion of up to 50% of the face area (6,20). Such high performance and robustness were also observed in humans (34,35).
rela-tion between human face recognirela-tion and a polar-fre-quency based model. The relation of the proposed model is reinforced by the implementation of a local Cartesian filtering, simulating the action of V1 cell type. Although the global FB model did not reproduce all the features of the human contrast sensitivity functions, the other two alterna-tive models were considerably less adequate. The lumi-nance-based model presented the more diverging pat-terns, indicating a low level of participation in the process. Although the tested local FB model was also rejected, we cannot exclude, for example, the possibility that probing face regions other than the eyes would improve the match with human functions.
The demonstration of the possibility of constraining
human performance by the type of information conveyed by FB patterns is a strong indication that the human visual system could be using FB-like spatial patterns in face processing. This hypothesis is supported by the electro-physiological evidence of the existence of neurons tuned to similar polar spatial patterns (15).
Encouraged by the plausibility of the proposed model, our ongoing work concerns clarifying several issues that can lead to fine tuning of the algorithm so that it will better match human performance. One open question is why unfiltered images have a relatively high recognition thresh-old. Another important issue is the window size of the local FB processing and the relative weight of each region.
References
1. Schweinberger SR, Burton AM. Covert recognition and the neural system for face processing. Cortex 2003; 39: 9-30. 2. Cohen JD, Tong F. Neuroscience. The face of controversy.
Science 2001; 293: 2405-2407.
3. Nasanen R. Spatial frequency bandwidth used in the recog-nition of facial images. Vision Res 1999; 39: 3824-3833. 4. Gallant JL, Braun J, Van Essen DC. Selectivity for polar,
hyperbolic, and Cartesian gratings in macaque visual cor-tex. Science 1993; 259: 100-103.
5. Mahon LE, De Valois RL. Cartesian and non-Cartesian responses in LGN, V1, and V2 cells. Vis Neurosci 2001; 18: 973-981.
6. Zana Y, Cesar-Jr R. Face recognition based on polar fre-quency features. ACM Trans Appl Percept 2006; 3: 1-21. 7. Riesenhuber M, Poggio T. Models of object recognition. Nat
Neurosci 2000; 3 (Suppl): 1199-1204.
8. Zana Y, Cesar-Jr R, Mena-Chalco J. Human and machine recognition of Fourier-Bessel filtered face images. Proceed-ings of the 7th IEEE International Conference on Automatic Face and Gesture Recognition. Southampton: 2006. p 299-304.
9. VanNes FL, Bouman MA. Spatial modulation transfer in the human eye. J Opt Soc A 1967; 57: 401-406.
10. De Valois RL, De Valois KK. Spatial vision. Oxford: Oxford University Press; 1990.
11. Costen NP, Parker DM, Craw I. Effects of high-pass and low-pass spatial filtering on face identification. Percept Psychophys 1996; 58: 602-612.
12. Gold J, Bennett PJ, Sekuler AB. Identification of band-pass filtered letters and faces by human and ideal observers. Vision Res 1999; 39: 3537-3560.
13. Tieger T, Ganz L. Recognition of faces in the presence of two-dimensional sinusoidal masks. Percept Psychophys 1979; 26: 163-167.
14. Kobatake E, Tanaka K. Neuronal selectivities to complex object features in the ventral visual pathway of the macaque cerebral cortex. J Neurophysiol 1994; 71: 856-867. 15. Gallant JL, Connor CE, Rakshit S, Lewis JW, Van Essen
DC. Neural responses to polar, hyperbolic, and Cartesian
gratings in area V4 of the macaque monkey. J Neurophysiol 1996; 76: 2718-2739.
16. Wilson HR, Wilkinson F. Detection of global structure in Glass patterns: implications for form vision. Vision Res 1998; 38: 2933-2947.
17. Wilson HR, Wilkinson F, Asaad W. Concentric orientation summation in human form vision. Vision Res 1997; 37: 2325-2330.
18. Achtman RL, Hess RF, Wang YZ. Sensitivity for global shape detection. J Vis 2003; 3: 616-624.
19. Zana Y, Cavalcanti AC. Contrast sensitivity functions to stimuli defined in Cartesian, polar and hyperbolic coordi-nates. Spat Vis 2005; 18: 85-98.
20. Zana Y, Cesar-Jr R, Feris R, Turk M. Face verification in polar frequency domain: A biologically motivated approach. Lect Notes Comput Sci 2005; 3804: 138-190.
21. Zana Y, Cesar-Jr R, Feris R, Turk M. Local approach for face verification in polar frequency domain. Image Vis Comput 2006; 24: 904-913.
22. Pelli DG, Zhang L. Accurate control of contrast on micro-computer displays. Vision Res 1991; 31: 1337-1350. 23. Phillips P, Wechsler H, Huang J, Rauss P. The FERET
database and evaluation procedure for face recognition algorithms. Image Vis Comput 1998; 16: 295-306. 24. Blakemore C, Campbell FW. On the existence of neurones
in the human visual system selectively sensitive to the orientation and size of retinal images. J Physiol 1969; 203: 237-260.
25. Hubel DH, Wiesel TN. Receptive fields and functional archi-tecture of monkey striate cortex. J Physiol 1968; 195: 215-243.
26. Wilson HR. Psychophysical models of spatial vision and hyperacuity. In: Regan D (Editor), Spatial vision. Boca Raton: CRC Press; 1991. p 64-86.
27. Wilson HR, McFarlane DK, Phillips GC. Spatial frequency tuning of orientation selective units estimated by oblique masking. Vision Res 1983; 23: 873-882.
Vis Image Underst 2003; 91: 6-21.
29. Barton JJ, Radcliffe N, Cherkasova MV, Edelman J, Intriligator JM. Information processing during face recogni-tion: the effects of familiarity, inversion, and morphing on scanning fixations. Perception 2006; 35: 1089-1105. 30. Hsiao JH, Cottrell G. Two fixations suffice in face
recogni-tion. Psychol Sci 2008; 19: 998-1006.
31. Edelman S. Representation and recognition in vision. Cam-bridge: MIT Press; 1999.
32. Rhodes G. Looking at faces: first-order and second-order
features as determinants of facial appearance. Perception 1988; 17: 43-63.
33. Young MP, Yamane S. Sparse population coding of faces in the inferotemporal cortex. Science 1992; 256: 1327-1331. 34. Burton AM, Miller P, Bruce V, Hancock PJ, Henderson Z.
Human and automatic face recognition: a comparison across image formats. Vision Res 2001; 41: 3185-3195. 35. Liu CH, Seetzen H, Burton AM, Chaudhuri A. Face