Evaluation of energy expenditure in forward and
backward movements performed by soccer referees
M.R. Paes and R. Fernandez
Departamento de Fisiologia, Setor de Ciências Biológicas, Universidade Federal do Paraná, Curitiba, PR, Brasil
Abstract
The aim of this study was to measure the energy expenditure for locomotor activities usually performed by soccer referees during a match (walking, jogging, and running) under laboratory conditions, and to compare forward with backward movements. The sample was composed by 10 male soccer referees, age 29±7.8 years, body mass 77.5±6.2 kg, stature 1.78±0.07 m and
professional experience of 7.33±4.92 years. Referees were evaluated on two separate occasions. On thefirst day, maximal
oxygen uptake (VO2max) was determined by a maximal treadmill test, and on the second day, the oxygen consumption was
determined in different speeds of forward and backward movements. The mean VO2maxwas 41.20±3.60 mLkg–1
min–1and the mean heart rate achieved in the last stage of the test was 190.5±7.9 bpm. When results of forward and backward
movements were compared at 1.62 m/s (walking speed), we found significant differences in VO2, in metabolic equivalents, and
in kcal. However, the same parameters in forward and backward movements at jogging velocities (2.46 m/s) were not significantly different, showing that these motor activities have similar intensity. Backward movements at velocities equivalent to walking and jogging are moderate-intensity activities, with energy expenditure less than 9 kcal. Energy expenditure was overestimated by at least 35% when calculated by mathematical equations. In summary, we observed that backward movements are not high-intensity activities as has been commonly reported, and when calculated using equations available in the literature, energy expenditure was overestimated compared to the values obtained by indirect calorimetry.
Key words: Referee; Football (soccer); Energy expenditure; Maximal oxygen uptake (VO2max)
Introduction
Body weight can affect, either positively or negatively, the physical performance of an athlete. Therefore, weight control is extremely necessary for any person who is involved in a professional sport. The most effective body weight control is by maintaining a balance between food intake and energy expenditure (1). There are many factors that determine the daily energy requirements of athletes, including the type of physical activity that they perform (2). The energy expenditure caused by training depends on the amount and the intensity with which the movements are performed (3). Thus, determining the energy expend-iture of an athlete during sports and training has great importance. However, while this parameter has been well evaluated in soccer players, it has not been so well explored in soccer referees. Although soccer players and referees are exposed to identical environmental condi-tions during a match, each plays a different role involving
specific physical and cognitive demands (4,5). During a
soccer match, the referee changes motion activity every
4–6 seconds, equating to more than 1200 different
activities. Of these, almost half are low-intensity activities (standing, walking, jogging) and around 10% are of high
intensity (running and sprinting) (6). These indicate that soccer refereeing is a highly intermittent exercise, in which the aerobic energy production accounts for approximately 90% of total energy consumption (7). The frequency of high intensity activities is reduced in the second period of the match, an event that coincides with the increase of the mean distance from infringements (8). These observations reinforce the idea of fatigue at the end of the match, and
the possible negative effects on the referee’s
decision-making process. Presently, it is not clear if improving exercise capacity can decrease the probability of incurring judgment errors during the match.
Numerous studies have investigated the maximum oxygen consumption of soccer players during training and
matches (9–11), but only one study has been conducted
to determine the energy expenditure during lateral and backward movements (12). In this study, Reilly and Bowen
(12) found significantly higher energy expenditure during
backward movement at 9 km/h when compared to forward movement at the same velocity. Based on the mean energy expenditure found for backward movements
(17.06 kcal) this activity was classified as of high intensity,
concluding that such movements call for great metabolic demand and elevated cardiovascular response. However, there is no study that investigated the energy expenditure during backward movements in soccer referees. Da Silva et al. (13) have investigated the energy expenditure, reported as kilocalories (kcal), and metabolic equivalents of task (METs) of referees during the motor activities
performed in official matches. A major limitation of these
studies was that energy expenditure was predicted based on mathematical equations instead of direct measure-ments, such as indirect calorimetry (with gas exchange analysis). Thus, it is necessary to directly determine oxygen consumption in soccer referees during each motor activity (including backward movements) by using an open circuit spirometry.
Therefore, the aim of this study was to measure the energy expenditure for each locomotor activity performed by soccer referees during a simulated-match (walking, jogging, and running) under laboratory conditions, and to compare forward with backward movements.
Material and Methods
Participants and ethical procedures
The sample was composed by 10 male volunteer soccer referees accredited by the Paranaense Soccer
Federation (FPF), with mean age of 29±7.8 years and a
professional experience of 7.33±4.92 years. The
partici-pants had mean body mass of 77.5±6.2 kg, stature of
1.78±0.07 m, body mass index of 24.07±1.69 kg/m2,
and body fat percentage of 19.9±2.1. Most of these
characteristics were similar to other groups of official
soccer referees reported in previous studies (4,14). Through a contact with the FPF, a list with all referees from the federation was obtained. Referees were ran-domly contacted by telephone and a brief explanation about the study was given. Volunteers who agreed to participate were informed verbally and by a written form about the nature and demands of the study, as well as about eventual health risks. They were also informed that they could withdraw from the study at any time. Written consent was obtained from each individual. Care was taken to ensure that subjects maintained their normal training and professional routines during the experimental
period. All subjects were approved to work in official
matches, during official physical tests and medical
evaluation conducted by the FPF. The project was approved (Record #1076.11.03) by the Ethics Committee of the Hospital Universitário, Universidade Federal do Paraná, and it followed the 96/1996 resolution from the Brazilian National Council of Health.
Experimental design
Referees were evaluated on two separate days. The
first test performed was maximal oxygen uptake (VO2max)
and the second test included evaluation of forward and
backward movements. The second test was performed
within at least 24 h after the VO2maxtest. The agenda of all
individuals was checked to verify that they were not refereeing any match or performing any strenuous effort during test periods. All tests were performed between 2:00 and 4:00 pm. Referees performed a familiarization session in a treadmill prior to testing, including backward movements. Five minutes of moderate intensity exercise (8 km/h) was used as warm-up, with the test beginning after 5 min of passive recovery.
During the first testing session, the VO2max and
velocity associated vVO2max were obtained with the
maximal incremental test at an initial velocity of 8 km/h incremented by 1 km/h every minute until exhaustion. Strong encouragement was given for subjects to achieve maximal intensity. Treadmill gradient was set at 1% (15).
VO2maxwas considered as the highest average
consump-tion of O2during the last 30 s of exercise, with at least two
of the following criteria being obtained: Heart rate (HR)
4maximal age-predicted HR (220–age); respiratory gas
exchange ratio (RER=carbon dioxide production (VCO2)/
VO2) of 1.04 or higher; and a VO2plateau (variation of
o2.1 mLkg–1
min–1 between the last two exercise
stages). vVO2max was considered as the lowest running
velocity achieved at VO2max. The 1% gradient was used to
favor the comparison among others studies (12,16) and to follow the Fédération Internationale de Football
Associa-tion (17) recommendaAssocia-tions that the playingfield must be
absolutely smooth and leveled. In the second testing session the oxygen consumption was determined during forward and backward movements. During the forward movement the oxygen consumption was determined in the following speeds: walking speed of 1.62 m/s (6 km/h); jogging at 2.46 m/s (9 km/h); running at 3.16 m/s (11 km/h); and sprinting at 5.08 m/s (18 km/h). These velocities were similar to those previously described in a study with Brazilian soccer referees (13). Subjects performed each movement for 3 min, with a break of 5 min between
velocities. The average VO2was measured during the last
30 s of exercise. However, we observed that VO2maxwas
obtained with speeds lower than 5.08 m/s, thus the energetic expenditure at that speed was evaluated through the anaerobic capacity (18). Backward move-ments were performed only at speeds of 1.62 m/s (6 km/h), and 2.46 m/s (9 km/h). This was done to simulate the
situation found in thefield during a game, where referees
perform backward movements with the game stopped (no ball movements). If they need to move faster, referees usually turn and run forward. Although backward motion is not commonly performed in this equipment (treadmill), a
previous study that verified the energetic expenditure
during backward movement rated soccer players in the same condition (12).
Monitor (Polar Electro Oy, Finland) and recorded
beat-by-beat (R–R intervals) by an electrocardiography channel of
a True-One system (TrueOnes 2400, Parvo Medics,
USA). The energetic expenditure in kcal and METs were also obtained simultaneously and continuously through the consumption of oxygen and the individual parameters using the True System-One. Oxygen consumption and energetic expenditure in kcal were also estimated by mathematical equations, as previously described (13).
Pulmonary gas exchange was measured
breath-by-breath in all sessions by determining O2 and CO2
concentrations, and ventilation, to calculate VO2using a
metabolic gas analysis system (True-One 2400, Parvo-Medics). The gas analyzer was calibrated immediately
before and verified after each test using a certified
gravimetrically determined gas mixture, while the
ventil-ometer was calibrated pre-exercise and verified
post-exercise using a 3-L syringe, in accordance with the
manufacturer’s instruction (19). Following removal of
outliers to exclude discrepant breaths, breath-by-breath
VO2data were interpolated to give 1s values, and cleaned
using a rolling average analysis (30 s) (OriginPro 7.0, OriginLab Corporation, USA) to enhance the underlying
VO2 response characteristics. Room temperature and
humidity (mean 26±1.41°C and 46.5±6.0%,
respec-tively) were controlled using an apparatus available with
the metabolic analyzer used in the study (TrueOnes2400,
Parvo Medics).
The net efficiency was calculated according to Powers
and Howley (2), in which Work is divided by consumed
Energy (in kilojoules), multiplied by one hundred (WorkC
Energy consumed 100).
Statistical analysis
Results are reported as means±SD. Normality was
assessed using the Shapiro-Wilk test. Statistical compar-isons among multiple means were made by repeated-measures one-way ANOVA followed by the Tukey multiple
comparisons test. Energetic expenditure and net effi
-ciency comparisons between forward and backward
movements were determining using two-tailed Student’s
pairedt-test. The statistical software used was GraphPad
Prism, version 5.0 for Windows (GraphPad Inc., USA).
Values for Po0.05 were considered to be statistically
significant.
Results
The mean VO2max was 41.20±3.60 mLkg–1
min–1
and the mean HR in the last stage of the test was 190.5
±7.9 bpm. The energetic expenditure, measured in METs
and in kilocalories (kcal), observed in the last stage of the
test was 11.80±1.03 and 18.08±6.38, respectively.
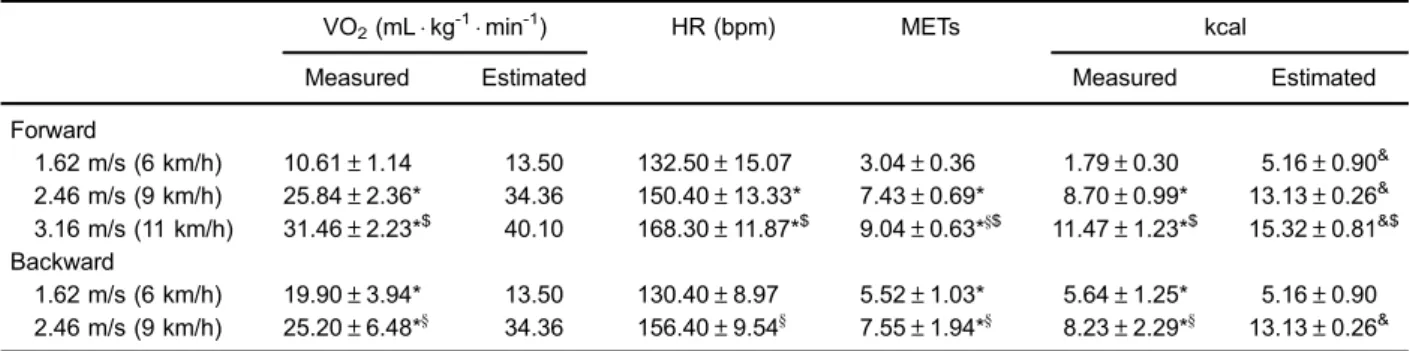
The energetic expenditure obtained at walking, jogging and running velocities was separately analyzed. In this aspect, the data were divided into forward and backward movements (Table 1). The repeated measures ANOVA
test showed significant differences for VO2, HR, METs and
kcal between all speeds in forward movements (Table 1). When we compared the results of forward and backward
walking, we found significant differences in VO2, METs
and kcal (Table 1). These results show that walking in backward movements is more intense than in forward movements at the same speed (Figure 1). However, the same parameters in forward and backward movements at
jogging velocities were not significantly different, showing
that these motor activities have similar intensity (Table 1, Figure 1). We also found that backward movements at velocities equivalent to walking and jogging are moderate-intensity activities, with energy expenditure lower than 9 kcal (Table 1). When oxygen consumption and energetic expenditure in kcal were calculated by mathematical
equations we obtained values that were significantly higher
to those directly determined by ergospirometry (Table 1). The only exception was with backward movements at walking velocity.
Table 1.Values of oxygen uptake (VO2), metabolic equivalents (METs), kilocalories (kcal) and heart rate (HR) in forward and backward movements of soccer referees.
VO2(mLkg-1min-1) HR (bpm) METs kcal
Measured Estimated Measured Estimated
Forward
1.62 m/s (6 km/h) 10.61±1.14 13.50 132.50±15.07 3.04±0.36 1.79±0.30 5.16±0.90& 2.46 m/s (9 km/h) 25.84±2.36* 34.36 150.40±13.33* 7.43±0.69* 8.70±0.99* 13.13±0.26&
3.16 m/s (11 km/h) 31.46±2.23*$ 40.10 168.30±11.87*$ 9.04±0.63*y$ 11.47±1.23*$ 15.32±0.81&$ Backward
1.62 m/s (6 km/h) 19.90±3.94* 13.50 130.40±8.97 5.52±1.03* 5.64±1.25* 5.16±0.90 2.46 m/s (9 km/h) 25.20±6.48*y 34.36 156.40±9.54y 7.55±1.94*y 8.23±2.29*y 13.13±0.26&
Data are reported as means±SD. Measured: values were directly determined by an ergospirometry test; Estimated: values were calculated by
mathematical equations (13). *Po0.001vsforward movement at 1.62 m/s (6 km/h);yPo0.001vsbackward movements at 1.62 m/s (6 km/h); &
The mechanical efficiency during backward/forward walking and backward/forward jogging was reported as
the percentage of net efficiency. The net efficiency of
participants during forward and backward walking was
17.98±4.03 and 8.17±2.64%, respectively (Po0.001).
In contrast, net efficiency during forward and backward
jogging was 6.59±0.83 and 7.63±2.58%, respectively.
The low efficiency shown by referees directly reflects the
lower VO2maxvalues found.
Discussion
The aim of this study was to measure the energy expenditure of common motor activities performed by soccer referees during a match in a laboratory setting (walking, jogging, and running), and to compare forward with backward movements. Our results show that back-ward walking and jogging are not high-intensity activities, as has been commonly reported in the international literature. Furthermore, when energy expenditure was estimated using equations available in the literature,
values were significantly overestimated compared to
those measured by indirect calorimetry in the laboratory. Results of the ergospirometry test showed a progressively
increasing VO2for forward walking, jogging, and running.
The mean VO2max obtained in this study was moderate,
as has been described in the literature for elite European soccer referees (6,20). The literature considers values between 7.5 and 9 kcal to represent moderate energy expenditure (1). Therefore, the only motor activity in our study considered of high intensity (energy expenditure
more than 9 kcal) was forward running. VO2 during
backward walking and jogging was significantly higher
than that observed for forward walking, but was similar to that for forward jogging. All backward motor actions
showed an energy expenditure of less than 9 kcal; therefore, backward movements could not be considered high-intensity activities in our study. This contradicts the results obtained by Reilly and Bowen (12) who investi-gated energy consumption in soccer players. The protocol used by these authors was similar to that used in the present study, and they evaluated the motor activities of forward and backward movements at speeds of 5, 7, and 9 km/h. Unfortunately, these authors report energy
expend-iture in kcal, but no VO2 results are reported for each
activity. They found a consumption of 12.08±1.18 and
17.06±1.67 kcal for forward and backward movements at
9 km/h, respectively. The difference between the energy expenditure of forward and backward movements at 9 km/ h shown in the study of Reilly and Bowen (12) is 4.93 kcal or approximately 40% higher in backward movements. Williford et al. (21) also reported a difference of 15% in both
VO2and HR between forward and backward movements
at 8 km/h in young tennis players. Based on these studies, backward movements are considered high intensity activities, which call for greater metabolic demand and elevated cardiovascular response. In the present study, we observed similar values of energy expenditure for forward and backward displacements at 2.46 m/s (jogging), a difference of only 5.5%. In addition, the maximum energy
expenditure found in the present study was 18.08±6.38
kcal; therefore, these 2 activities use approximately 52% of the maximum energy expenditure from each individual and obviously cannot be regarded as activities with a high energy cost. Differences in measurements and speeds between our study and the studies by Reilly and Bowen
(12) and Williford et al. (21) make it difficult to conduct
comparisons across these studies. However, it is interest-ing to note that in the Williford et al. (21) study the difference in energy expenditure between forward and
backward movements decreased with an increasing intensity of movement (differences of 28 and 15% for movement at 6 and 8 km/h, respectively), as was observed in our study. Several factors could explain the differences between forward and backward movements: motor pat-terns (increase of cadence and reduction of stride length during backward movement), differences in muscular power and work output, different types of muscle action, differences in motor unit recruitment, and greater burden
on the medial sensorimotor cortices (22–26). The last two
factors should primarily be considered when backward movement is a "new" task, with little or no previous practice
carried out (27). All of these factors, and the fluctuation
between them, influence the distribution of effort between
the aerobic and anaerobic components, hampering the measurement of total energy consumption. However, the increase in speed promotes a reduction in body stability in a similar manner in both types of motor action, which explains the decrease of the difference in energy con-sumption with increasing intensity (speed) (28). In other words, with the increase in speed, and concomitant in-creased demand of the anaerobic system, there is a reduction in the consumption of oxygen.
Energy expenditure of an athlete during physical activity can be predicted by mathematical equations. In the present experimental protocol we observed that these equations overestimated energy expenditure in at least 35%. In a previous study, the energy expenditure of soccer
referees during official matches was estimated from
equa-tions that take into account the time spent performing each motor activities (16). By using published equations, Da Silva and Rodriguez-Añez (16) reported a total energy expendi-ture of 740.42 and 494.64 kcal for referees and assistant
referees, respectively. The referees consumed a mean O2of
16.17, 33.08, and 41.46 mLkg–1
min–1 for walking,
jogging, and running activities, respectively. Furthermore,
when VO2 was transformed into kcal and the values for
these 3 motor activities were combined, a total of 705.48 kcal consumption during a 90 min match was obtained. By using mathematical equations, which combine the time
spent on motor activities with the VO2values, we found a
total of 469.76 kcal (walking, 225.27 kcal; jogging, 135.28 kcal; running, 110.20 kcal). Thus, in our study, the equation
for VO2 overestimated the energy expenditure in the
participants. This observation could be owing to differences in the weight of the subjects (88 kg in the study by Da Silva and Rodriguez-Añez (16) and 77.5 kg in the present study). However, when the same routine was performed by assistant referees from the study by Da Silva and Rodriguez-Añez, who showed an average weight of 77 kg,
a similar pattern was observed (walking, 328.05vs215.60
kcal; jogging, 42.02vs25.43 kcal; running, 18.62vs13.40
kcal). The total energy expenditure estimated from equations in the Da Silva and Rodriguez-Añez study was 388.69 kcal, which was considerably higher than that found in our study
by using VO2 values (254.44 kcal). Another possible
explanation for the difference in energy expenditure between the studies could be the different duration of each activity.
Da Silva et al. (13) estimated the energy expenditure
of soccer referees during official matches in METs and in
kcal. These authors reported a total energy expenditure of
734.7±65 kcal, made up of 266.05, 256.25, 94.68, and
85.57 kcal for walking, jogging, running, and backward movement, respectively. Unfortunately, our study did not evaluate the individual energy expenditure for sprinting, which hampered the comparison of total consumption during the match between the studies.
One way to explain differences in individual energy
expenditures is through exercise efficiency. The net effi
-ciency reflects how efficiently our organism can transduce
oxygen consumption into effective work. Several mathema-tical equations have been developed to describe individual
efficiency during a physical activity (2,18). It is known that
many factors influence energy expenditure both at rest and
during activity, such as the intensity of the activity, movement speed, and the different composition of motor units in each muscle, amongst others (2). Diverse studies have found that
a marathon runner has an average efficiency of 20 to 25%
and that swimming is the least efficient activity, promoting an
efficiency of about 7% [2,18,29]. Powers and Howley (2)
reported that mechanical efficiency is inversely proportional
to intensity; in other words, the higher the intensity, the lower
the efficiency. This is evident when looking at the data for net
efficiency of forward and backward movements at 9 km/h
(jogging). Furthermore, we observed that the highest
efficiency was obtained in forward movements at 6 km/h
(walking) (17.98±4.03%). During this motor activity, referees
presented a mean energy expenditure of only 3.04±0.36
METs and 1.79±0.30 kcal, just above resting values. One
hypothesis that could explain the differences in mechanical
efficiency is the professional experience as referees, and
body fat percentage. However, no correlations between
professional experience or body fat % and VO2consumption
in forward or backward walking/jogging are reported in the literature. Moreover, some papers have reported differences among the metabolic systems used, and in test/re-test measurement evaluations (30,31). These factors could explain the high variability of data published for backward walking and jogging.
The main limitation of this study is that referees were
evaluated at specific workloads, which may not
corre-spond to actual speeds when walking/jogging in a match situation. Also, in a lab setting, environmental factors like temperature, humidity, precipitation, wind, etc, can be controlled, which could be very different to a match situation. However, these results contribute to the knowl-edge on the energetic expenditure during training ses-sions, and provide information that may be useful in body weight control during the season.
equations available in the literature, energy expenditure can be overestimated and produce errors when prescribing diets. A diet plan based on overestimated energy consumption may cause greater calorie intake than required, which could contribute to the high percentage of body fat commonly found
in referees (32–34). Future research should focus in field
measurements of energy expenditure and dietetic strategies
specific to refereeing.
Acknowledgments
The authors thank Prof. Edson Itaru Kaminagakura (in
memoriam) and Dr. Alberto I. Da Silva (Laboratory of Physiology, Health and Sport, LAFISE, State University of Ponta Grossa, UEPG) for helping with open circuit spirometry experiments and useful suggestions. M.R. Paes received a fellowship from CAPES.
References
1. Mcardle WD, Katch FI, Katch VL. Exercise physiology: nutrition, energy, and human performance. 7th edn. Phila-delphia: Lippincott Williams & Wilkins; 2009.
2. Powers SK, Howley ET.Exercise physiology: theory and application to fitness and performance. 6th edn. Whitby: McGraw-Hill Education; 2009.
3. American College of Sport Medicine.ACSM’s guidelines for exercise testing and prescription. 9th edn. Philadelphia: Lippincott Williams & Wilkins; 2013.
4. Castagna C, Abt G, D’Ottavio S. Physiological aspects of soccer refereeing performance and training.Sports Med2007; 37: 625–646. doi: 10.2165/00007256-200737070-00006. 5. Weston M, Castagna C, Impellizzeri FM, Bizzini M, Williams
AM, Gregson W. Science and medicine applied to soccer refereeing: an update.Sports Med2012; 42: 615–631. 6. Krustrup P, Bangsbo J. Physiological demands of top-class
soccer refereeing in relation to physical capacity: effect of intense intermittent exercise training.J Sports Sci2001; 19: 881–891. doi: 10.1080/026404101753113831.
7. Bangsbo J. Energy demands in competitive soccer.J Sports Sci1994; 12 (Spec No): S5–S12.
8. Mallo J, Navarro E, Garcia-Aranda JM, Gilis B, Helsen W. Activity profile of top-class association football referees in relation to performance in selected physical tests.J Sports Sci2007; 25: 805–813. doi: 10.1080/02640410600778602. 9. Bangsbo J, Lindquist F. Comparison of various exercise tests with endurance performance during soccer in profes-sional players.Int J Sports Med1992; 13: 125–132. 10. Bangsbo J, Norregaard L, Thorso F. Activity profile of
competition soccer.Can J Sport Sci1991; 16: 110–116. 11. Tumilty D. Physiological characteristics of elite soccer players.
Sports Med 1993; 16: 80–96. doi: 10.2165/00007256-199316020-00002.
12. Reilly T, Bowen T. Exertional costs of changes in directional modes of running.Percept Mot Skills1984; 58: 149–150. doi: 10.2466/pms.1984.58.1.149.
13. da Silva AI, Fernandes LC, Fernandez R. Energy expendi-ture and intensity of physical activity in soccer referees during match-play.J Sports Sci Med2008; 7: 327–334. 14. Helsen W, Bultynck JB. Physical and perceptual-cognitive
demands of top-class refereeing in association football.J Sports Sci2004; 22: 179–189. doi: 10.1080/02640410310001641502. 15. Jones AM, Doust JH. A 1% treadmill grade most accurately reflects the energetic cost of outdoor running.J Sports Sci 1996; 14: 321–327. doi: 10.1080/02640419608727717.
16. Da Silva AI, Rodriguez-Añez CR. Energetic expenditure of the referee and the assistant soccer referee.J Phys Educ /JPESM2001; 12: 113–118.
17. Fédération Internationale de Football Association. Technical recommendations and requirements. Football stadiums. 5th edn. http://www.fi fa.com/governance/security/stadium-safety-and-security.html. Accessed September 21, 2015.
18. Noordhof DA, Skiba PF, de Koning JJ. Determining anaerobic capacity in sporting activities.Int J Sports Physiol Perform2013; 8: 475–482.
19. Duffield R, Bishop D. VO2 responses to running speeds above VO2max.Int J Sports Med2008; 29: 494–499. doi: 10.1055/s-2007-989230.
20. D’Ottavio S, Castagna C. Physiological load imposed on elite soccer referees during actual match play.J Sports Med Phys Fitness2001; 41: 27–32.
21. Williford HN, Olson MS, Gauger S, Duey WJ, Blessing DL. Cardiovascular and metabolic costs of forward, backward, and lateral motion.Med Sci Sports Exerc1998; 30: 1419– 1423. doi: 10.1097/00005768-199809000-00011.
22. Kachanathu SJ, Alenazi AM, Algarni AD, Hafez AR, Hameed UA, Nuhmani S, et al. Effect of forward and backward locomotion training on anaerobic performance and anthropometrical composition. J Phys Ther Sci2014; 26: 1879–1882. doi: 10.1589/jpts.26.1879.
23. Vilensky A, Gankiewicz E, Gehlsen G. A kinematic comparison of backward and forward walking in humans. Hum Move Stud1987; 13: 29–50.
24. Flynn TW, Soutas-Little RW. Mechanical power and muscle action during forward and backward running.J Orthop Sports Phys Ther1993; 17: 108–112. doi: 10.2519/jospt.1993.17.2.108. 25. DeVita P, Stribling J. Lower extremity joint kinetics and energetics during backward running.Med Sci Sports Exerc 1991; 23: 602–610.
26. Kurz MJ, Wilson TW, Arpin DJ. Stride-time variability and sensorimotor cortical activation during walking. Neuroimage 2012; 59: 1602–1607. doi: 10.1016/j.neuroimage.2011.08.084. 27. Shigemori K, Nagino K, Nakamata E, Nagai E, Izuta M, Nishii M, et al. Motor Learning in the Community-dwelling Elderly during Nordic Backward Walking.J Phys Ther Sci 2014; 26: 741–743. doi: 10.1589/jpts.26.741.
29. Barnes KR, Kilding AE. Strategies to improve running economy. Sports Med2015; 45: 37–56. doi: 10.1007/s40279-014-0246-y. 30. Nieman DC, Austin MD, Dew D, Utter AC. Validity of COSMED’s quark CPET mixing chamber system in evaluating energy metabolism during aerobic exercise in healthy male adults.Res Sports Med2013; 21: 136–145. doi: 10.1080/15438627.2012.757227.
31. Vandarakis D, Salacinski AJ, Broeder CE. A comparison of COSMED metabolic systems for the determination of resting metabolic rate.Res Sports Med2013; 21: 187–194.
32. Casajus JA, Matute-Llorente A, Herrero H, Gonález-Agüero A. Body composition in Spanish Soccer Referees. Mea-surement Control 2014; 47: 178–184. doi: 10.1177/ 0020294014538790.
33. Rontoyannis GP, Stalikas A, Sarros G, Vlastaris A. Medical, morphological and functional aspects of Greek football referees.J Sports Med Phys Fitness1998; 38: 208–214. 34. Zoraghi MR, Khoshnam E, Solhjo MH. Assessment of body