Efect of an Educational Program on Schoolchildren’s
Energy Expenditure during Physical Education Classes
Cristianne Troleis da CunhaI, Ana Paula PoblacionI, Fernando Antonio Basile ColugnatiII, José Augusto de Aguiar
Carrazedo TaddeiI, Mario Maia BraccoIII
DOI: 10.5935/MedicalExpress.2016.01.04
I Universidade Federal de São Paulo, Departmento de Pediatria, Disciplina de Nutrologia, São Paulo, SP, Brazil.
II Universidade Federal de Juiz de Fora, Divisão de Nefrologia, Núcleo Interdisciplinar de Estudos e Pesquisas em Nefrologia (NIEPEN), Juiz de Fora, Minas Gerais, MG, Brazil.
III Hospital Israelita Albert Einstein, Hospital Municipal Dr. Moyses Deutsh, M’Boi Mirim. São Paulo, SP, Brazil.
OBJECTIVE: Physical activity is a means of prevention of noncommunicable diseases. The level of physical activity of children is decreasing in Brazil, and this can increase the risks of diseases associated with sedentary lifestyles and obesity.
METHOD: This is a school-based randomized controlled trial which evaluated the impact of an educational intervention on children’s physical activity level, energy expenditure, and teacher’s behavior during physical education classes at public schools in São Paulo. The studied population comprised children attending the 1st and the 2nd grades of
eight schools (three exposed and ive unexposed to teacher training on a course in nutrition and physical activity). Outcomes were measured by direct observation, recorded by a VHS camera during physical education classes; data from 78 physical education classes were analyzed by the System for Observing Fitness Instruction Time - SOFIT. RESULTS: After intervention, results showed highly signiicant increases in children’s physical activity level (walking, p < 0.001; vigorous activities (p < 0.001), and a decrease in the standing category (p < 0.001). It also showed a non-signiicant increase in mean energy expenditure of children (70.6% = 27.6Kcal), but the interaction’s efect of group and time (intervention) was highly signiicant (32.4Kcal; 95%CI 24.7 - 40.1, p < 0.001) indicating the intervention efectiveness in increasing the energy expenditure of children during Physical Education classes. It also showed an increase in length of physical education classes (26.2 to 32.1 minutes (p = 0.01).
CONCLUSION: There was a change in teachers’ behavior with a positive impact on children’s physical activity level and energy expenditure after the educational intervention.
KEYWORDS: Energy Expenditure; Physical Education; Child; Randomized Controlled Trial.
Cunha CT, Poblacion AP, Colugnati FAB, Taddei JAAC, Bracco MM. Efect of an Educational Program on Schoolchildren’s Energy Expenditure during Physical Education Classes. MedicalExpress (São Paulo, online). 2016;3(1):M160104
Received for Publication on September 14, 2015; First review on October 1, 2015; Accepted for publication on November 21, 2015; Online on January 16, 2016
E-mail: [email protected]
■
INTRODUCTIONPhysical activity in all age groups has been increasingly valued as a protective factor against noncommunicable diseases, such as cardiovascular diseases, cancer and diabetes.1,2 It can also be used as a tool for health promotion, disease prevention or therapeutic approach to non-transmissible chronic diseases.3 An active lifestyle does not require a program
with vigorous exercises. Even small changes can reduce disease risks and contribute to a better quality of life.4 Physically active individuals perform better at school or work, pursue healthier nutritional habits,5 have lower rates of detrimental habits to health, such as smoking, alcohol and other drug use, and are less subjected to stress.6-8
Childhood physical inactivity has been considered as a public health issue given its association with childhood obesity; its prevalence is on the rise, worldwide, mainly so in the developing countries.9-11 Physical activity habits
Study Design. This study is a School-based Randomized Controlled Trial. A three-step cluster sampling
procedure was used for subject selection. In the first step,
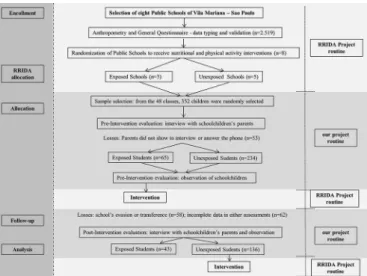
8 schools in the Vila Mariana district (São Paulo) were purposely selected and randomly assigned either to physical activity intervention (3 schools) or control condition (5 schools). In the second step, all 48 classrooms from the 1st and 2nd grades of the three physical activity intervention schools were selected. In the third step, 352 children who belonged to those 48 classrooms were randomly selected to compose the observational group. Direct observation and questionnaire data were collected twice: “pre” (immediately before the intervention), and “post” (immediately after the intervention), with a six months interval between them. No educational intervention took place in the control schools during the running of the project. After the project was completed, control schools teachers received the same training.
Eligibility and Selection Criteria. Among all Public Schools located in the neighborhood of Vila Mariana/ São Paulo (Brazil) eight schools were conveniently designated by the Central South Board of Education, which is the State Agency responsible for managing schools. From these eight elementary Public Schools we randomly selected four to receive an educational intervention for teachers, however one school refused to participate in the intervention group, because the training program was offered in the evenings and teachers weren’t willing stay longer periods to be trained. Therefore this school was included in the control group, since this post randomization allocation agrees to the Intention to Treat Principle assumptions.20 In order to evaluate the intervention results, all 1st and 2nd grade children, from exposed and unexposed schools (n = 48 classrooms) were enrolled for the selection of children to be evaluated. In each class, seven or eight children were randomly selected according to presence list, numbering a total of 352 selected children. Unavailable selected children were replaced by the subsequent child in the list.
Sample Loss. From initial sample, 53 of subjects were excluded because parents neither attended interview day at school, nor established telephone contact. In addition, 58 children were transferred or left school during the observational year, and 62 of them were excluded due to
missing data in either observation. The final sample was
composed by 179 children (90 boys and 89 girls) (Figure 1).
Intervention
The randomized schools were contacted for an awareness process by the research team of the Reducing Risks of Illness and Death in Adulthood - RRIDA Project. The team presented the study purposes and the methodology that would be used to the principals and teachers participating.
physical activities in adulthood, thus having a long-term positive effect.12 Given that, schools represent a favorable environment to promote physical activity, contributing to the health of children and reducing risk factors for chronic diseases.13-15 Nevertheless, school physical education is not generally perceived and valued as an effective strategy to promote physical activity in spite of a strong body of evidence that supports recommendations directed toward this purpose.16
Physical activity intervention programs should be based on behavior change models.17 In this sense, intervention programs in schools should encourage children and adolescents to develop patterns of living a more active life, imprinting healthy habits during childhood that could be perpetuated into adulthood, preventing noncommunicable diseases.18
The aim of this study was to evaluate the impact of a classroom teachers’ educational intervention on 1st and 2nd grades upon the physical activity level and energy expenditure of children during physical education classes in elementary public schools, in São Paulo, Brazil.
■
MATERIALS AND METHODSEthics Statement. Data was collected from March to July 2000, in strict observance of the Declaration of Helsinki; all procedures involving human participants the parents’ written consent form on behalf of enrolled minors was approved by the Ethics Committee of the Federal University of São Paulo/ São Paulo Hospital (Case #330/00). In addition, this trial has been registered at ClinicalTrials under the
protocol number NCT 02024763 and the authors confirm
of the children, and to empower the teachers to promote more active PE classes.
Outcome measures
To assess children’s level of Physical Activity (PA), the Physical Education classes were recorded. The analysis of the videotapes set the level of each student’s physical activity, the teacher’s attitude towards the class/students, and the class context. The observational instrument used was SOFIT - System for Observing Fitness Instruction Time.25 This tool recommends observations of student’s physical activity level, class context and teacher’s attitude every 20 seconds throughout PE class period. It allows the calculation of children’s energy expenditure through the correlation with heart rate, validated in a previous study.26 Exposed children wore distinctly colored shirts to be best observed on videotapes; we used a video camera (JVC GR-AX657UM) placed on a tripod at a distance that allowed clear visualization of each child and the teacher during classes. SOFIT’s assessments were performed independently by two previously trained PE professors.
To test reproducibility, ten classes were coded simultaneously by the two PE professors (806 intervals) in order to verify the consistency of observations, interval by interval, between them. Levels of agreement for Student’s Physical Activity Engagement, Lesson’s Context/Content, and Instructor’s Behavior were 84.5%, 97.3% and 88.0%, respectively.
Sample Size Calculation and Statistical Analysis
Accepting that among the unexposed students the proportion of low energy expenditure during PE classes would be observed in 10% of them while for the exposed students the proportion would be 23%, corresponding to a risk ratio of 2.30, the sample sizes considering three
unexposed for each exposed student, with a significance level of 5% (α = 0.05), and a power of 80% (β = 0.20), would
be of 352 children, 264 unexposed and 88 exposed. After considering the sample loss, statistical analyzes were performed with 179 children. Frequency distributions of biological variables were used to access selection biases possibly introduced by the losses in exposed and unexposed groups. To test differences between enrolled and lost individuals we used chi-square test with 5%
significance level. To perform SOFIT assessments we used
paired and unpaired t-tests. The paired t-test was used for intragroup comparisons and the unpaired t-test was used for intergroup comparisons.
The evaluation of the influence of interventions in
the Physical Activity measurements was performed using a generalized linear mixed-model approach27 in a multilevel fashion. The intercepts for schools and classes were modeled as random effects representing the two main levels of the study design. The idea was to control for the likely
Figure 1. Study Flow Chart
The intervention was designed for and focused on classroom teachers and consisted of a 30 hour refresher course in nutrition and physical activity.21 Training lasted six weeks, with 12 hours devoted to physical activity and 18 hours to nutritional contents. Classroom teachers were invited to attend and upon successful completion they were
granted a participation certificate by the Federal University
of São Paulo. In addition the time spent in the course was added to teacher’s continuing studies log, counting as pedagogy tasks. Modules of educational activities were delivered to classroom teachers so as to be replicated at Physical Education (PE) classes to children from 1st and 2nd grades of three exposed schools.
The physical activity module was delivered by classroom teachers (not by PE specialists) in four sessions of three hours each. Theoretical content was delivered by the RRIDA’s physical activity coordinator in each of these
meetings. The contents were (i) physical activity benefits
and risks for the overall health, (ii) children’s physical
fitness and physiological exercise patterns, (iii) limitations
according to growth and neuromotor development, (iv) physical education as a public health strategy, and (v)
behavior change models that could be fitted in the PE
classes.
intra-class correlation induced by students in same classes and classes into the same school. The models assumed normal distribution for errors and identity link function. To perform statistical procedures we used STATA 12.0/IC (StataCorp LP, College Station, TX, USA).
■
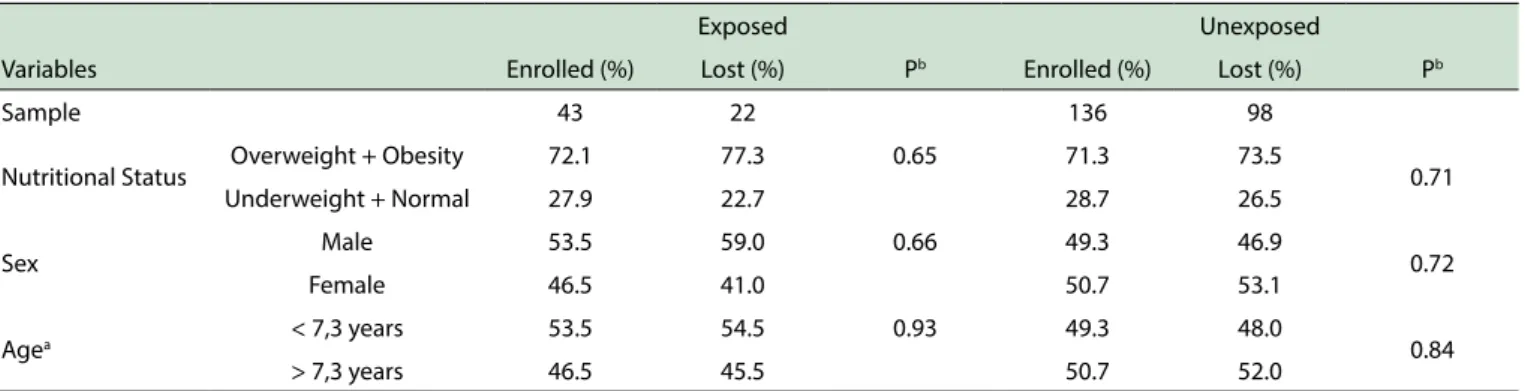
RESULTSIn order to access selection biases due the high dropout rate, we compared the distributions for nutritional status, sex and age variables (Table 1). The similarity over distributions of lost and enrolled individuals showed no differences between groups.
From a total of 30 minutes duration PE class, the total mean duration of children’s physical activity at PE classes in the pre-intervention observation, in both sets of schools (exposed and unexposed) were 26.2 and 27.5 minutes, respectively. However, after the intervention there was a
significant increase in the mean total duration of PE classes
only at the exposed schools, rising to 32.1 minutes (p =
0.01). We did not find this modification among unexposed
schools, as shown in Table 2.
Table 3 shows the distribution of teacher’s involvement during PE lessons according to SOFIT categories. Independently of intervention, there was a tendency to diminish teacher’s involvement in the PE
classes. In both groups, there was a significant reduction in the category named “demonstrates fitness”. If teachers
reduced their time spent showing how to execute the exercise, they compensated this behavior watching students perform the exercises. Therefore the category “observes”
increased during lessons in both groups, but was found
significant only in the unexposed group.
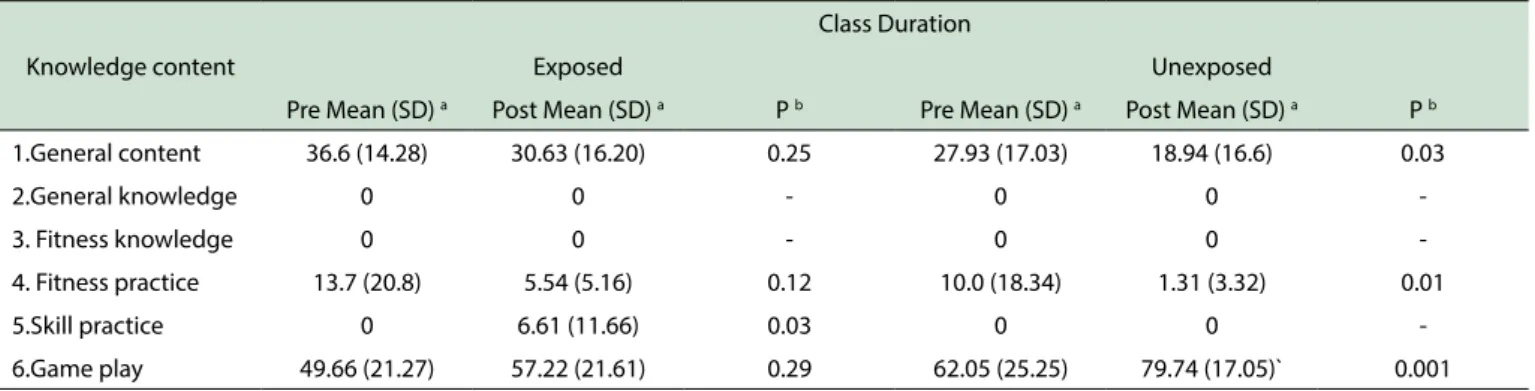
Table 4 indicates that during classes no theoretical content (categories 2 and 3) was provided. In addition, no practice skills were performed during PE classes in both groups, but after intervention the exposed group had this content incorporated by teachers (p = 0.03). The 6th category “Game play”, showed in table 4, was the most frequent during PE classes in both groups, with a
significantly increase in the unexposed group.
Table 5 shows on one hand a significant increase
after the intervention in the categories of higher energy expenditure, such as walking (p < 0.001) and vigorous activity (p < 0.001); on the other hand the table shows a
significant decrease in the standing category (p < 0.001). For the unexposed group, there was a small but significant
increase in the walking category (p < 0.001) and a decrease at vigorous activity category (p = 0.002).
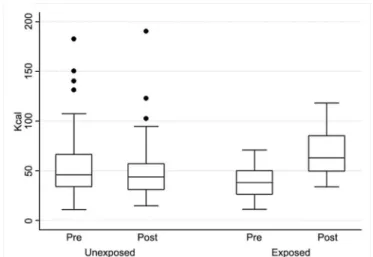
Figure 2 shows that in the exposed group there was an increase of 70.6% (27.6Kcal) in mean energy expenditure of children after the intervention, while there was a decrease in mean energy expenditure of 8.6% (-4.7Kcal) in the unexposed group. Neither of these results was significant. However, Table 6 brings the highly significant joint effect of group and time (32.4Kcal; 95%CI 24.7-40.1, p = 0.0001) indicating the intervention effectiveness in increasing the energy expenditure of children during PE classes. The school, class, and children’s random effects and its 95%CI were respectively, 15.39Kcal (8.20-28.87); 10.60Kcal (7.18-15.64); 9.04Kcal (6.25-13.07).
Table 1. Distribution of biological variables between enrolled and lost individuals in each comparison group
Exposed Unexposed
Variables Enrolled (%) Lost (%) Pb Enrolled (%) Lost (%) Pb
Sample 43 22 136 98
Nutritional Status Overweight + Obesity 72.1 77.3 0.65 71.3 73.5 0.71 Underweight + Normal 27.9 22.7 28.7 26.5
Sex Male 53.5 59.0 0.66 49.3 46.9 0.72 Female 46.5 41.0 50.7 53.1
Agea < 7,3 years 53.5 54.5 0.93 49.3 48.0 0.84
> 7,3 years 46.5 45.5 50.7 52.0
a categorized according to the median age of the initial sample; b probability.
Table 2. Mean and standard deviations of children’s physical activity total duration (minutes) at PE classes, at exposed and unexposed
schools, pre and post-intervention
Schools
Exposed Unexposed
Pre Mean (SD) a Post Mean (SD) a Pb Pre Mean (SD) a Post Mean (SD) a Pb
Children’s physical activity total duration
26.2 (7,39) 32.1(6.08) 0.01 27.5 (10.32) 24.1 (9.00) 0.13
Table 3. Mean and standard deviations of teacher’s involvement (percentage) during PE classes according to SOFIT’s categories at exposed and unexposed teachers, pre and post-intervention (n=53).
Teacher’s involvement
Teachers
Exposed N = 18 Unexposed N = 35
Pre Mean (SD) a Post Mean (SD) a P b Pre Mean (SD) a Post Mean (SD) a Pb
1. Promotes itness 7.3 (11.0) 2.9 (3.4) 0.12 2.1 (5.3) 2.1 (4.2) 1.00 2. Demonstrates itness 11.4 (13.7) 4.0 (4.0) 0.04 7.9 (13.0) 1.9 (5.4) 0.02 3. Instructs 17.1 (11.2) 17.9 (6.2) 0.79 16.6 (14.2) 13.2 (7.9) 0.22 4. Manages 39.3 (19.2) 40.2 (10.0) 0.86 34.5 (21.2) 26.4 (10.6) 0.04 5. Observes 24.6 (20.9) 33.7 (11.5) 0.11 33.9 (23.7) 48.5 (16.2) 0.004 6. Other-task 0.2 (0.9) 1.1 (4.3) <0.001 5.0 (11.0) 7.8 (15.5) 0.38
a standard deviation; b probability.
Table 4. Mean and standard deviations of the duration of class context (percentages) in PE classes according to SOFIT’s categories at exposed
and unexposed classes, pre and post-intervention (n = 79)
Knowledge content
Class Duration
Exposed Unexposed
Pre Mean (SD) a Post Mean (SD) a P b Pre Mean (SD) a Post Mean (SD) a P b
1.General content 36.6 (14.28) 30.63 (16.20) 0.25 27.93 (17.03) 18.94 (16.6) 0.03
2.General knowledge 0 0 - 0 0
-3. Fitness knowledge 0 0 - 0 0
-4. Fitness practice 13.7 (20.8) 5.54 (5.16) 0.12 10.0 (18.34) 1.31 (3.32) 0.01 5.Skill practice 0 6.61 (11.66) 0.03 0 0 -6.Game play 49.66 (21.27) 57.22 (21.61) 0.29 62.05 (25.25) 79.74 (17.05)` 0.001
a standard deviation; b probability.
Table 5. Mean and standard deviations of time spent (percentages) in PE classes according to student’s physical activity engagement under
SOFIT’s categories at exposed and unexposed students, pre and post-intervention (n=179)
Student’s physical activity engage-ment
Students
Exposed Unexposed
Pre Mean (SD) a Post Mean (SD) a Pb Pre Mean (SD) a Post Mean (SD) a Pb
Lying down 0.4 (1.4) 0.2 (1.0) 0.44 1.0 (3.5) 0.9 (1.0) 0.74 Sitting 21.9 (21.5) 15.5 (14.8) 0.11 20.7 (23.3) 16.5 (23.7) 0.14 Standing 65.5 (22.4) 42.7 (13.7) <0.001 48.3 (22.7) 51.5 (22.5) 0.24 Walking 5.6 (4.8) 25.5 (11.4) <0.001 12.8 (15.5) 13.8 (10.6) <0.001 Vigorous 6.5 (4.4) 16.1 (9.6) <0.001 15.5 (15.6) 10.6 (9.7) 0.002
a standard deviation; b probability.
■
DISCUSSION & RECOMMENDATIONThis is one of the five trials with strong evidence to
support a practice recommendation to increase physical activity in Latin America included into a systematic review.18 The combination of a randomized controlled design and an educational intervention with classroom teachers led to changes (i) in the net percentage of physical activity from baseline in estimated caloric expenditure (80.5%); (ii) in the time spent being vigorous during PE classes (179.3%); and time spent walking during PE classes
(307.4%). Furthermore, the use of direct observation that insured the inclusion of all students initially randomized to be witnessed in order to assess energy expenditure measurements reinforced the internal validity of our observations. In addition to that, we tested the consistency of observations: a satisfactory level of reproducibility between the two PE professors was obtained. Finally, we used a validated instrument which has reproducibility within expected levels for interventional studies.
schools have the obligation and the resources to provide physical activity as part of its curriculum.8,32
In the educational context, PE covers the cognitive, affective, social and motor development of the child. Besides, it has been seeking the playful component of education.33 According to the Brazilian 1st Grade Physical Education Curriculum Proposal, PE follows the constructivist line, involving children in the construction of knowledge by integrating the subject into the world. It is a method of search, discover, rediscover, invent and create, that is important in the teaching-learning process.34 Thus, the stimulus to accomplish physical activity provides pleasant
moments, and promotes health benefits for the child.35 Unfortunately, there is a worldwide trend toward physical inactivity. A 51-country prevalence study, showed
that overall about one fifth of them are at risk for chronic
diseases due to physical inactivity.36 Children have also been experiencing it as well, wherever physical education classes are declining at schools.8,16
According to that, the Brazilian government has found it necessary to promote Physical Education Guidelines in order to enhance the value of this practice.34 Although the Guidelines are dictating what is considered the basis of PE at schools, PE classes ministered to 1st to 4th grades of elementary state schools are not usually under the responsibility of PE professionals. Instead, these classes are often assigned to classroom teachers. According to the Guidelines and Bases of National Education,37 the presence of the PE specialists has become dispensable for classes in the 1st cycle. That given, physical activity level and energy expenditure may have decreased, probably due to PE classes being ministered by inexperienced professionals.38
In order to enable classroom teachers to increase children’s physical activity level and energy expenditure, the RRIDA Project formulated an Educational Intervention. Tables 2 and 5 concisely show results that enable us to conclude that the educational intervention was successful in increasing physical activity among schoolchildren.
The evidence of this trial shows a 20% increase (from 26.2 to 32.1 minutes) in children’s physical activity total duration (minutes) at PE classes in exposed schools, which was not observed in the unexposed schools (Table 2). This study has also shown an increase in the time children spent doing physical activity at PE classes: a 355% increase in walking and a 148% increase in vigorous activities among the exposed children. The amount of time spent in PE classes and its intensity accounted for half of daily physical activity recommendations, time required to improve physical performance and achieve the health
benefits associated with physical activity.39 This was not found in the unexposed children in whom we observed a small increase of 7.8% in walking and an expressive decrease of -31.6% in vigorous activities, meaning that children from schools that did not receive the Educational
Figure 2. Box Plot of energy expenditure between unexposed and exposed children, pre and post- intervention.
Table 6. Student’s mean energy expenditure (kcal) during PE lessons
according to SOFIT’s calculations at exposed and unexposed groups, pre-and post-intervention (N = 179)
Coef. a CI b (95%CI) P>zc
Pre/Post Momentum -4.8 (-8.6; -1.0) <0.0001 Exposed/Unexposed Groups -15.6 (-39.4; 8.1) 0.2 Interaction
(Momentum*Groups)
32.4 (24.7; 40.1) <0.0001
Constant 54.7 (40.4; 69.0) <0.0001
a coeicient; b conidence interval; c probability
a limiting factor that hinders the adoption of results as
definitive. Even if they remained similar according to
measured biological variables as shown in Table 1, we cannot guarantee the maintenance of group equality
defined by randomization. However, it should be noted that
this weakness might not invalidate the body of evidence
observed in terms of size and significance of the observed
effect.28 In addition, another limitation of this evidence is power, resulting in the fact that our results can only be directly applied in schools with similar conditions in which classroom teachers were trained instead of PE specialists.
Economic, political, social and cultural changes occurred in the world since the nineteenth century and were
intensified during the last century, producing significant
changes in society life, especially in health related issues. Children in developing countries have been experiencing rapid urbanization leading to fewer opportunities to be physically active in safe environments, thus contributing to a sedentary lifestyle.29
Intervention diminished their energy expenditure along the timeline (Table 5).
The joint impact of group (exposed vs. unexposed), and time (pre vs. post intervention) is well shown by the interaction factor at the multilevel model; thus, it is a better measurement of the trial’s impact factor of a 32.4 kcal increase in children’s energy expenditure during PE classes (Fig. 2). Although the amount of calories may seem low, formal PE classes are not the only opportunity for students to engage in physical activity, but such classes offer a regular schedule and a structured format, both excellent incentives for engaging in physical activity that have an impact in establishing habits early in life.14 So it is true that only exposed children changed their physical activity behavior incorporating extra activities in their daily life such as playing sports in which we observed a 18.7% increase (p = 0.02); and playing outside with an increase of 25% (p = 0.04). Also we observed a 9.9% increase among the exposed children who started going to school walking or cycling (p = 0.05) (data not shown).
The effectiveness of community-based interventions to improve physical activity was recently analyzed in a systematic review of the literature18 and concluded that school-based
programs were successful at improving the physical fitness
among school-aged children when compared with other types of interventions. Although the evidence showed high variability in the net percentage change in physical activity of school-based programs, this could be attributed (i) to differences in age group (elementary, primary schoolchildren); (ii) to study design (randomized or non-randomized design); (iii) to different types of measurements (minutes spent in moderate and vigorous physical activity; percentage of children meeting physical activity goals; (iv) to the percentage of children biking or walking to school, (v) to estimated energy expenditure, (vi) to the percentage of children being very active during PE classes; (vii) to the percentage of time spent walking during PE classes; (viii) to aerobic capacity as estimated by VO2 max results from timed runs, (ix) to endurance capacity as estimated by the shuttle run test.
■
CONCLUSIONThis study contributes strong evidence that school-based educational intervention programs to classroom teachers increases energy expenditure of children, although issues related to income, work environment such as physical space, and structural resources still persist as barriers, leading schools to struggle in offering high-quality PE classes. Regardless, PE seems to be an effective but underused way to promote physical activity.
The additional step is to encourage new studies to verify the relationship between the increase in children’s
energy expenditure and its benefits, such as the decrease in
cardiometabolic outcomes aiming to change obesity rates.
■
ACKNOWLEDGEMENTSThe authors extend their thanks to Fundação de
Amparo à Pesquisa do Estado de São Paulo (FAPESP), for
the financial support (99/07582-6) and to the Secretaria de
Educação de São Paulo for collaborating to the development
of the RRIDA Project.
■
CONFLICT OF INTERESTAuthors declare no conflict of interest regarding
this project.
■
AUTHOR PARTICIPATIONCunha CT: acquisition of data, interpretation of data and writing the article; Poblacion AP: interpretation of
data, writing the article and final approval of the submitted
version; Colugnati FAB: analysis of data, critical review of
article and final approval of submitted version; Taddei JAAC:
conception and design of the project, critical review of the
article and final approval of submitted version; Bracco
MM: conception and design of the project, interpretation
of data, critical review of the article and final approval of
submitted version.
EFEITO DE UM PROGRAMA DE EDUCAÇÃO NO GASTO ENERGÉTICO DE ESCOLARES DURANTE AS AULAS DE EDUCAÇÃO FÍSICA
OBJETIVO: A prática de atividade física é uma forma
de prevenção de doenças não transmissíveis. O nível de atividade física das crianças tem diminuído no Brasil, fato
que pode contribuir para o aumento do risco de doenças associadas com o sedentarismo e a obesidade.
MÉTODO: Este é um ensaio educacional randomizado
controlado que avaliou o impacto de uma intervenção
educacional para professores no nível de atividade física e no gasto energético das crianças, e no comportamento do professor durante as aulas de educação física em escolas
públicas de São Paulo. A população estudada compreendeu
crianças de 1ᵃ e 2ᵃ series de oito escolas (três expostas
e cinco não-expostas ao treinamento de professores em
nutrição e atividade física). Os resultados foram medidos
por observação direta e gravados por uma câmera VHS
durante as aulas de educação física. Dados de 78 aulas de educação física foram analisados segundo o System for
Observing Fitness Instruction Time - SOFIT.
RESULTADOS: Após intervenção, os resultados
mostraram aumentos significantes no nível de atividade física das crianças (caminhada, p < 0.001; atividades
vigorosas (p < 0.001), e diminuição na categoria na qual
os resultados mostraram um aumento não-significante na média do gasto energético pelas crianças (70.6% = 27.6Kcal), porém a interação do grupo e do tempo (intervenção) foi altamente significante (32.4Kcal; 95%CI
24.7; 40.1, p < 0.0001) indicando a efetividade da intervenção
em aumentar o gasto energético das crianças durante a aula de educação física. Os resultados mostraram também um aumento na duração da aula de educação física (26.2 para
32.1 minutos (p = 0.01).
CONCLUSÃO: Houve diferença no comportamento
dos professores com um impacto positivo no nível de atividade física e no gasto energético das crianças após a
intervenção educacional.
PALAVRAS-CHAVE: Gasto energético; Educação
Física; Criança; Ensaio Randomizado Controlado.
■
REFERENCES1. Fernandes RA, Zanesco A. Early physical activity promotes lower prevalence of chronic diseases in adulthood. Hypertens Res. 2010;33(9):926-31. http://dx.doi.org/10.1038/hr.2010.106. 2. WHO. Global strategy on diet, physical activity and health. 2004.
[cited 2015 January, 13th]; Available from: http://www.who.int/ dietphysicalactivity/strategy/eb11344/strategy_english_web.pdf 3. Fernandes R, Sponton C, Zanesco A. Atividade física na infância e na
adolescência promove efeitos benéficos na saúde de adultos. Rev SOCERJ. 2009;22(6):8.
4. Pate RR, Pratt M, Blair SN, Haskell WL, Macera CA, Bouchard C, et al. Physical activity and public health. A recommendation from the Centers for Disease Control and Prevention and the American College of Sports Medicine. JAMA. 1995;273(5):402-7.
5. Singh A, Uijtdewilligen L, Twisk JW, van Mechelen W, Chinapaw MJ. Physical activity and performance at school: a systematic review of the literature including a methodological quality assessment. Arch Pediatr Adolesc Med. 2012;166(1):49-55. http://dx.doi.org/10.1001/ archpediatrics.2011.716.
6. Trudeau F, Laurencelle L, Tremblay J, Rajic M, Shephard RJ. Daily primary school physical education: effects on physical activity during adult life. Med Sci Sports Exerc. 1999;31(1):111-7. http://dx.doi. org/10.1097/00005768-199901000-00018
7. Haskell WL, Leon AS, Caspersen CJ, Froelicher VF, Hagberg JM, Harlan W, et al. Cardiovascular benefits and assessment of physical activity and physical fitness in adults. Med Sci Sports Exerc. 1992;24(6 Suppl):S201-20.
8. World Health Organization. The meeting on promoting active living in and through schools. Denmark; 1998.
9. Fonseca V, Sichieri R, da Veiga G. Factors associated with obesity among adolescents. Rev Saude Publica. 1998;32(6):541-9. http://dx.doi. org/10.1590/S0034-89101998000600007
10. Berkey CS, Rockett HR, Field AE, Gillman MW, Frazier AL, Camargo CA, et al. Activity, dietary intake, and weight changes in a longitudinal study of preadolescent and adolescent boys and girls. Pediatrics. 2000;105(4):E56.
11. Bracco M, Ferreira M, Morcillo A, Colugnati F, Jenovesi J. Energy expenditure among obese and non obese public school children. Rev Bras Cien Mov. 2002;10(3):7.
12. Telama R, Yang X, Viikari J, Välimäki I, Wanne O, Raitakari O. Physical activity from childhood to adulthood: a 21-year tracking study. Am J Prev Med. 2005;28(3):267-73. http://dx.doi.org/10.1016/j. amepre.2004.12.003
13. Mâsse LC, Naiman D, Naylor PJ. From policy to practice: implementation of physical activity and food policies in schools. Int J Behav Nutr Phys Act. 2013;10:71. http://dx.doi.org/10.1186/1479-5868-10-71
14. Sun C, Pezic A, Tikellis G, Ponsonby AL, Wake M, Carlin JB, et al. Effects of school- based interventions for direct delivery of physical activity on fitness and cardiometabolic markers in children and adolescents: a systematic review of randomized controlled trials. Obes Rev. 2013;14(10):818-38. http://dx.doi.org/10.1111/obr.12047. 15. Flynn MA, McNeil DA, Maloff B, Mutasingwa D, Wu M, Ford C, et al.
Reducing obesity and related chronic disease risk in children and youth: a synthesis of evidence with ‘best practice’ recommendations. Obes Rev. 2006;7 Suppl 1:7-66. http://dx.doi.org/10.1111/j.1746-1561.2012.00703.x.
16. Turner L, Chaloupka FJ, Slater SJ. Geographic variations in elementary school-based physical activity practices. J Sch Health. 2012;82(7):307-10. http://dx.doi.org/2012;82(7):307-10.1111/j.1746-1561.2012.00703.x.
17. Baranowski T, Anderson C, Carmack C. Mediating variable framework in physical activity interventions. How are we doing? How might we do better? Am J Prev Med. 1998;15(4):266-97. http://dx.doi. org/10.1016/S0749-3797(98)00080-4
18. Hoehner CM, Soares J, Parra Perez D, Ribeiro IC, Joshu CE, Pratt M, et al. Physical activity interventions in Latin America: a systematic review. Am J Prev Med. 2008;34(3):224-33. http://dx.doi.org/10.1016/j. amepre.2007.11.016.
19. Brownson RC, Ramos L. Guide for Useful Interventions for Physical Activity in Brazil & Latin America. [cited 2015 February, 24th]; Available from: http://www.projectguia.org/en/
20. Guyatt G, Rennie D, Meade MO, Cook DJ. User’s Guides to the Medical Literature. A Manual for Evidence-Based Clinical Practice. 2nd Edition ed. [cited 2015 February, 20th]; Available from: http://jmvertiz. posgrado.unam.mx/pmdcmos02/convocatorias/Users_guide_ medical_literature.pdf
21. RRIDA Project - Reduction Risks of Illness and Death in Adulthood. 2001 [cited 2015 March, 23rd]; Available from: http://www2.unifesp. br/dped/disciplinas/nutricao/projet.html
22. Gaglianone CP, Taddei JAdAC, Colugnati FAB, Magalhães CG, Davanço GM, Macedo Ld, et al. Nutrition education in public elementary schools of São Paulo, Brazil: the Reducing Risks of Illness and Death in Adulthood project. Rev Nutrição. 2006;19:309-320. http://dx.doi. org/10.1590/S1415-52732006000300002.
23. Da Cunha CT. Impacto de Programa Educativo no Gasto Energetico de Escolares nas aulas de Educação Fisica: Ensaio randomizado controlado. São Paulo: Federal University of São Paulo; 2002. 24. Macedo L, Petty A, Passos N. Aprender com jogos e situações problema.
Porto Alegre: Artmed; 2000.
25. McKenzie T, Sallis J, Nader P. SOFIT: System for Observing Fitness Instruction Time. J Teaching Physical Education. 1991;11:195-205. 26. McKenzie TL. Observational measures of children’s physical
a c t iv i t y. J S c h H e a l t h . 1 9 9 1 ; 6 1 ( 5 ) : 2 2 4 - 7 . h t t p : / / d x . d o i . org/10.1111/j.1746-1561.1991.tb06019.x
27. McCulloch C, Searle S. Generalized Linear and Mixed Models. New York: Wiley; 2001.
28. OCEBM. The Oxford 2011 Levels of Evidence. Oxford Centre for Evidence-Based Madicine; Available from: http://www.cebm.net/ index.aspx?o=5653
29. Popkin BM, Gordon-Larsen P. The nutrition transition: worldwide obesity dynamics and their determinants. Int J Obes Relat Metab Disord. 2004;28 Suppl 3:S2-9. http://dx.doi.org/10.1038/sj.ijo.0802804 30. Waxman A. Prevention of chronic diseases: WHO global strategy on
diet, physical activity and health. Food Nutr Bull. 2003;24(3):281-4. 31. Gordon-Larsen P, Nelson MC, Popkin BM. Longitudinal physical
activity and sedentary behavior trends: adolescence to adulthood. Am J Prev Med. 2004;27(4):277-83. http://dx.doi.org/10.1016/j. amepre.2004.07.006
33. Freire J. Educação de corpo inteiro: teoria e prática da educação física. São Paulo: Scipione; 1997.
34. Brasil. Parâmetros Curriculares Nacionais: Educação Física / Secretaria de Educação Fundamental. In: Educação Md, editor. Brasília; 1997. 35. Borra ST, Schwartz NE, Spain CG, Natchipolsky MM. Food, physical
activity, and fun: inspiring America’s kids to more healthful lifestyles. J Am Diet Assoc. 1995;95(7):816-23.
36. Guthold R, Ono T, Strong KL, Chatterji S, Morabia A. Worldwide variability in physical inactivity a 51-country survey. Am J Prev Med. 2008;34(6):486-94. http://dx.doi.org/10.1016/j.amepre.2008.02.013.
37. Brasil. LDB: Lei de Diretrizes e Bases da Educação Nacional. Lei n. 9.394. In. Brasil: Edições Câmara; 1996.
38. Telford RD, Cunningham RB, Fitzgerald R, Olive LS, Prosser L, Jiang X, et al. Physical education, obesity, and academic achievement: a 2-year longitudinal investigation of Australian elementary school children. Am J Public Health. 2012;102(2):368-74. http://dx.doi.org/10.2105/ AJPH.2011.300220.