Submitted30 March 2016
Accepted 16 August 2016
Published13 September 2016
Corresponding authors
Steven C. Huber,
Ivan Baxter, [email protected]
Academic editor
Marion Röder
Additional Information and Declarations can be found on page 23
DOI10.7717/peerj.2452
Copyright
2016 Huber et al.
Distributed under
Creative Commons CC-BY 4.0
OPEN ACCESS
Canopy position has a profound effect on
soybean seed composition
Steven C. Huber1,2,3,*, Kunzhi Li1,2,4,*, Randall Nelson3,8,*, Alexander Ulanov5,
Catherine M. DeMuro1and Ivan Baxter6,7
1Global Change and Photosynthesis Research Unit, United States Department of Agriculture, Agricultural Research Service, Urbana, IL, United States
2Department of Plant Biology, University of Illinois at Urbana-Champaign, Urbana, IL, United States 3Department of Crop Sciences, University of Illinois at Urbana-Champaign, Urbana, IL, United States 4Lab of Plant Nutrition Genetic Engineering, Kunming University of Science and Technology, Kunming,
Yunnan, China
5Metabolomics Facility, Carver Biotechnology Center, University of Illinois at Urbana-Champaign, Urbana, IL, United States
6Plant Genetics Research Unit, United States Department of Agriculture Agricultural Research Service, St. Louis, MO, United States
7Donald Danforth Plant Science Center, Creve Coeur, MO, United States
8Soybean/Maize Germplasm, Pathology, and Genetics Research Unit, United States Department of Agriculture, Agricultural Research Service, Urbana, IL, United States
*These authors contributed equally to this work.
ABSTRACT
Fe concentrations than products from the top of the canopy. Therefore, using seeds produced in the lower canopy for production of iron-rich soy foods for human consumption could be important when plants are the major source of protein and human diets can be chronically deficient in Fe and other minerals.
SubjectsAgricultural Science, Plant Science
Keywords Soybean, Canopy, Physiology, Elemental composition, Ionome, Nutrition
INTRODUCTION
Although soybean seeds from a given plant may appear physically homogeneous, it has long been known that seed produced at the top of the canopy can have higher protein and less oil compared to seeds from the bottom of the canopy (Collins & Cartter, 1956). Subsequently it was demonstrated that positional effects are observed with determinate as well as indeterminate soybeans (Escalante & Wilcox, 1993a) and in normal protein as well as high-protein breeding lines (Escalante & Wilcox, 1993b). While these effects on protein and oil concentrations have been documented to occur, they are nonetheless not widely recognized today and there are no insights concerning possible physiological mechanisms that may underlie these positional effects. There are many other important seed constituents, in particular minerals, but the impact of canopy position on many of these seed constituents is unknown. Because legumes like soybean can contribute not only protein to the human diet but also minerals like iron (Fe) and zinc (Zn), canopy position effects on the concentrations of essential minerals could be important, especially for the health and nutrition of children and women. According to the World Health Organization, Fe deficiency is currently the most widespread mineral deficiency affecting more than 30% of the world’s population (http://www.who.int/nutrition/topics/ida/en/). One approach to control this problem is to increase Fe intake via dietary diversification with Fe-rich foods and it is possible that variation with canopy position could be exploited.
In the present study, we grew a core group of ten soybean lines in Urbana, IL, over a 3-yr period and monitored seed composition (protein, oil and mineral element concentration) at maturity as a function of node position. In general, there was a continuum in composition with seed that developed at the top of the canopy having more protein but less oil and reduced concentrations of minerals such as Mg, Fe, and Cu compared to seeds produced at the bottom of the canopy. Of particular note was the variation in Fe concentration, which was generally∼20% higher in seeds from the bottom of the canopy. The differences in
mineral concentrations such as Fe could have direct impact on use of soybeans for human food in countries that primarily depend on plant protein sources for intake of minerals. We also tested several possible developmental and micro-environmental factors for their ability to influence the seed compositional gradients, and used metabolomic profiling of developing seeds to investigate biochemical determinants of the protein and oil gradients. Collectively, the results establish a new type of seed heteromorphism in soybean where seeds appear physically homogenous but differ in composition and provide new insights to some of the underlying factors that may be responsible for the gradients in composition from bottom to top of the canopy.
MATERIALS AND METHODS
Plant growth and sampling
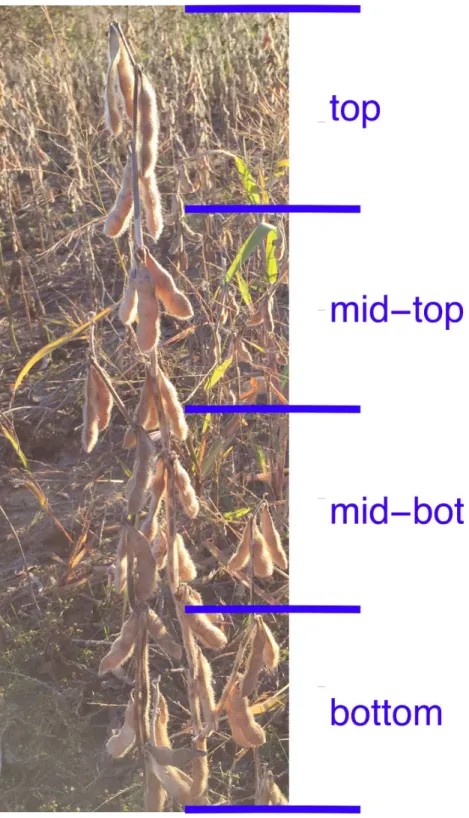
Soybean lines were grown at the University of Illinois South Farm, Urbana, IL, in a randomized complete block design with three replicates each year. Each plot consisted of three rows 2.5 m long, with 0.75 m between rows and a planting density of roughly 30 seeds m−1. To produce the thinning treatment, all but three plants were removed from each row shortly after flowering. Delaying thinning until after the reproductive period had begun minimized branching on the remaining plants. Approximately 20 cm of plants were thinned from the ends of each row and the third plant was left in the middle in the row. The remaining plants were spaced approximately 1 m apart.
Plants were harvested at maturity. All plants were cut close to ground level and brought into the laboratory. Each main stem was divided into four quadrants and the stem fractions in each quadrant were threshed together for each plot. Only normal-sized plants were included in the analysis, and extremely small, wrinkled or off-color seeds were manually removed from all samples before analysis.
Soy products
To produce flour, soybeans were blanched (boiled for∼25 min) and then baked before
grinding. To produce soymilk and okara (remaining solids), soybeans were blanched (boiled for ∼5 min) twice and then ground in water and cooled slightly. The soymilk
(liquid phase) and okara (solid phase) were separated using a cheesecloth and then dried separately and reground before analysis.
Seed storage product analysis
a spectrum from 850 to 1,050 nm via the monochrome light source and mobile grating system. A 50-ml seed sample was used that allowed for 10 subsample readings reported on a 13% moisture basis.
Ionomic analysis
Seed analysis was conducted as described inZiegler et al. (2013). Briefly, single seeds from each quadrant were weighed using a custom-built seed weighing robot and then digested in concentrated nitric acid before loading onto an Elan ICP-MS. Internal standards were used to control for differences in dilution and sample injection. Leaf and soy products were analyzed in the same manner except that samples were added to digestion tubes by hand and weighed. Custom scripts were used to correct for internal standards and correct for sample weight.
Metabolomic analysis
Metabolome analysis was done through Metabolomics Center, Roy J. Carver Biotechnology Center, University of Illinois at Urbana-Champaign. Frozen seeds of the cultivar ‘Williams 82’ with attached seed coats were homogenized in liquid nitrogen and about 25 mg FW was extracted at room temperature with 1 mL of 50% methanol followed by addition of 800µ1 of methanol:chloroform (1:2) as outlined inFile S7. Each extraction was followed by centrifugation (5 min at 15,000 g), and the supernatants were collected. With the exception of samples for analysis of coenzymes, final extracts were evaporated under vacuum at
−60◦C and subjected to GC/MS analysis.
Metabolic profiling
Dried extracts were derivatized with 100µL methoxyamine hydrochloride (40 mg ml−1in pyridine) for 90 min at 50◦
C, then with 100µL MSTFA at 50◦C for 120 min, and following 2-h incubation at room temperature 5µL of the internal standard (hentriacontanoic acid, 10 mg ml−1) was added to each sample prior to derivatization. Metabolites were analyzed using a GC-MS system (Agilent Inc, CA, USA) consisting of an Agilent 7890 gas chromatograph, an Agilent 5975 mass selective detector and a HP 7683B autosampler. Gas chromatography was performed on a ZB-5MS (60 m×0.32 mm I.D. and 0.25µm film thickness) capillary column (Phenomenex, CA, USA). The inlet and MS interface temper-atures were 250 ◦
C, and the ion source temperature was adjusted to 230◦
C. An aliquot of 1µL was injected with the split ratio of 10:1. The helium carrier gas was kept at a constant flow rate of 2 ml min−1. The temperature program was: 5-min isothermal heating at 70◦
C, followed by an oven temperature increase of 5◦
C min−1to 310 ◦
C and a final 10 min at 310◦
C. The mass spectrometer was operated in positive electron impact mode (EI) at 69.9 eV ionization energy at m/z 30–800 scan range.
Amino acid analysis
Alto, CA, USA) gas chromatograph, an Agilent 5973 mass selective detector and Agilent 7683B autosampler. Gas chromatography was performed on a 60 m ZB-5MS column with 0.32 mm inner diameter (I.D.) and 0.25µm film thickness (Phenomenex, CA, USA) with injection temperature and MSD transfer line of 230◦
C both, and the ion source adjusted to 230 ◦
C. The helium carrier gas was set at a constant flow rate of 2 ml min−1. The temperature program was 5 min at 150◦
C, followed by an oven temperature ramp of 5 ◦
C min−1to 315◦
C for a final 3 min. The mass spectrometer was operated in positive electron impact mode (EI) at 69.9 eV ionization energy in m/z 50–800 scan range. Acquired data were normalized to the internal standard (DL-p-chlorophenylalanine) and sample fresh weight. Amino acid concentrations were calculated based on 2–75µg ml−1standard curves.
Free fatty acids, total fatty acids and coenzymes were also measured and values obtained used in the global analysis, but specific results are not presented. Detailed methods for the analysis are available on request.
The spectra of all chromatogram peaks were compared with electron impact mass spectrum libraries NIST08 (NIST, MD, USA), W8N08 (Palisade Corporation, NY, USA), and a custom-built database (460 unique metabolites). All known artificial peaks were identified and removed. To allow comparison between samples, all data were normalized to the corresponding internal standard and the sample fresh weight (FW). The spectra of all chromatogram peaks were evaluated using the AMDIS 2.71 (NIST, MD, USA) program. Metabolite concentrations were reported as concentrations relative to the internal standard (i.e., target compound peak area divided by peak area of internal standard: NI=Xi×X−1IS)
per gram sample weight. The instrument variability was within the standard acceptance limit (5%).
Metabolites with more than 50% of missing data were removed and for the rest of the metabolites, any missing data was imputed with one-half of the minimum positive value in the original data assuming their level was below the instrument detection limit. MVA and visualization was performed with SIMCA-P+12.0 software (Umetrics AB, Umeå, Sweden)
and MetaboAnalyst (Xia & Wishart, 2011) using log-transformed and autoscaled data and validated by sevenfold Cross-Validation and permutation with 500 random. To address the problem of multiple comparisons the False Discovery Rate (FDR) test was adopted (Storey, 2002).
Data analysis
Protein, oil, and elemental data were analyzed using R and the packages dplyr, ggplot2, grid, reshape2, qtlcharts and gplots. All data and analysis scripts used in the analysis are included as a supplemental file and are available onwww.ionomicshub.org.
RESULTS
Canopy position affects soybean seed protein, oil and mineral concentrations
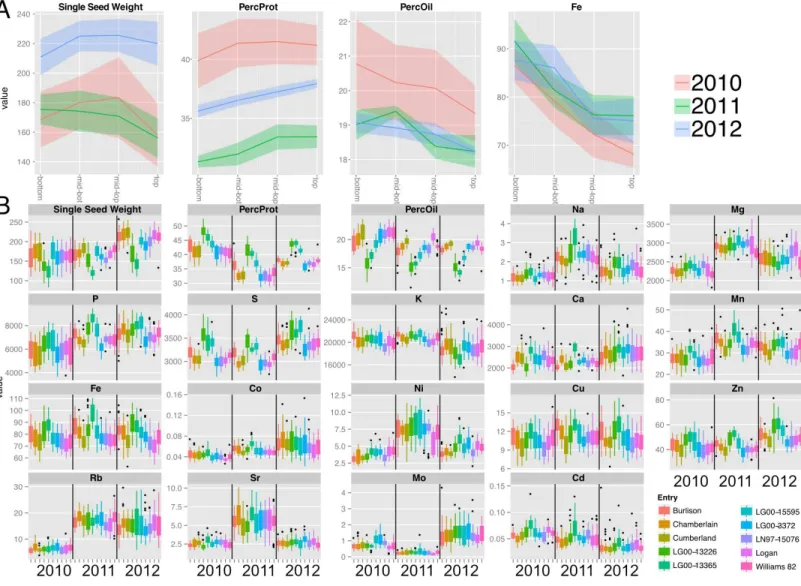
Figure 2 Canopy gradients of seed composition traits before normalization and line and year effects on total accumulation.(A) Composition gradients from the bottom to the top of the canopy for cultivar ‘Chamberlain’. The plots display the quadrant average as a line with the 95% con-fidence interval calculated using standard error as the ribbon. Units are mg (Single seed weight), PPM (Fe) and percentage for Protein and Oil (B) Year and line effects for each compositional trait, represented as boxplots. Units are PPM.
were analyzed separately for major storage products (protein and oil) and various minerals. Representative results obtained for one cultivar (‘Chamberlain’) are presented inFig. 2A
with full plots provides asFile S1. As shown, protein concentration increased with node position at which seeds developed going from bottom to top of the mainstem while oil and iron (Fe) concentration decreased. For both protein and oil, which are the major seed constituents, there was variation in the absolute concentrations among the 3 years of study, but general trends were similar. Differences in absolute concentrations among years were most apparent for protein concentration with highest levels obtained in 2010 and lowest in 2011, presumably reflecting the impact of weather on seed development and composition. Another confounding source of variation for canopy position analysis is genotype, and
were highest (>1000 ppm); Mn, Fe, Rb, and Zn were intermediate (10 to 100 ppm), and
Na, Co, Ni, Cu, Sr, Mo, and Cd were present at trace levels (<10 ppm).
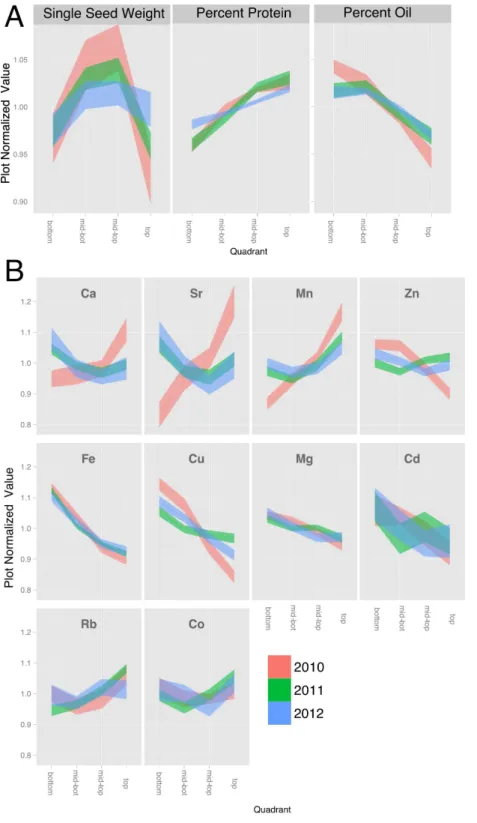
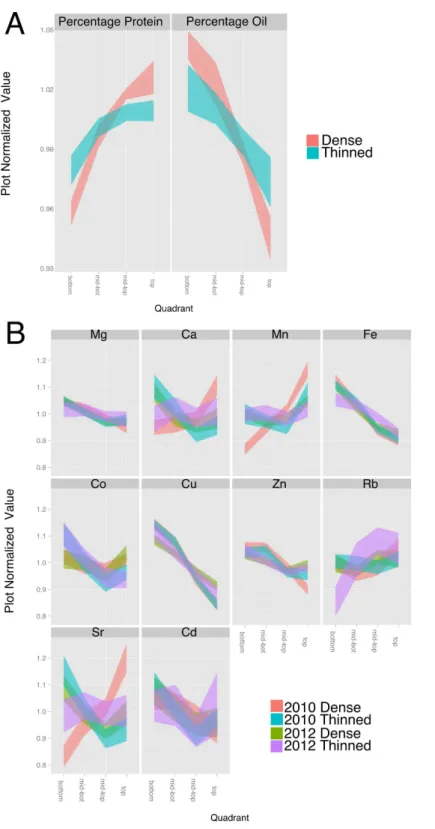
In order to compare positional effects for various parameters across genotypes and years without the confounding effects of differences in absolute values, we normalized each canopy gradient to a mean value of one and the values for each quadrant were then expressed relative to the normalized mean. However, because the weather in each year of the study differed (Table S2), the normalized results for each parameter are presented separately for each year. Across the 10 soybean lines, oil concentration decreased progressively from bottom to top of the canopy and was associated with a reciprocal increase in protein con-centration (Fig. 3A). Protein and oil concentrations in soybean seeds are usually inversely related (Wilcox, 1998) and this was apparent with variation within the canopy as well. Single seed weight (designated as sample weight inFig. 3A) varied with canopy position with seed produced in the middle portion tending to be slightly heavier than seeds produced at either the bottom or top of the canopy; however, the storage product gradients were independent of seed weight variation. Storage product gradients did not vary significantly across the three years of the study; however, absolute protein and oil concentrations varied among the three years of the study (Fig. 2), This is perhaps a result of weather that differed substantially in terms of temperature and precipitation among the three growing seasons (Table S2).
We also found that canopy position significantly affected the seed ionome, which comprises all of the minerals and trace elements found in mature seeds (Fig. 3Band
File S2). While there have been several studies of the soybean seed ionome (McGrath & Lobell, 2013;Myers et al., 2014;Sha et al., 2012;Ziegler et al., 2013), to our knowledge this is the first report demonstrating variation with canopy position.Figure 3Bshows normalized canopy gradient plots for elements where there was a statistically significant (p<0.01)
variation in concentration with position. Several groups of minerals exhibited common responses with canopy position. The elements Mg, Fe, Cu, and Cd were present at highest concentrations in seeds from the bottom of the canopy and decreased progressively to the top of the canopy. Within this group, the profiles for Mg and Fe were similar to one another in that variation was relatively low and the gradients were almost identical across the three years; however, the relative changes in Fe concentration were much greater in magnitude compared to changes in Mg concentration. Cu, Zn and Cd showed similar patterns, but were more variable among years. The second group that was apparent included Ca and Sr, where seeds from the middle of the canopy exhibited the lowest concentrations except in 2010, when concentrations of both Ca and Sr tended to increase going up the canopy. Finally, Mn was alone in the third category that increased in concentration towards the top of the canopy in all 3 years. Ca and Sr, and Cd and Zn, are chemically similar which may explain their parallel profiles. It is interesting to note that while Rb is a chemical analog of K and the two are often closely correlated (Baxter, 2009), that was not the case for soybean seeds where significant position effects on Rb were observed (Fig. 3B) but not for K (see
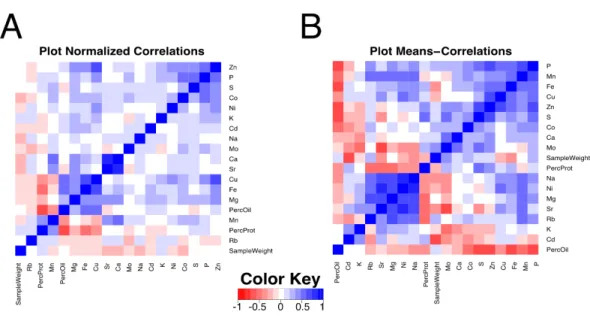
Figure 4 Correlation plot among composition traits.Pearson correlation values between compositional traits. (A) Correlation across 832 quadrants normalized to the plot average. (B) Correlation across 208 plot means.
ionome, and interestingly some minerals were affected (Ca, Mn, Cu, Zn, Sr) while others (Mg, Fe, Co, Rb, Cd) were not. We also measured other minerals (B, Na, Al, P, S, K, Ni, As, Se and Mo) that did not show statistically significant variation with nodal position and are presented inFile S2.
Another way to compare canopy profiles for the minerals measured is to do an overall correlation matrix of quadrant variation normalized to plot averages. In this way, one can look across the entire data set for parameters that are correlated based on variation with nodal position. A strong positive correlation would indicate that both components changed not only in the same direction but also to the same relative extent. As shown inFig. 4A, only a few strong correlations were apparent among the measured parameters. Variation in seed size (sample weight inFig. 4A) did not significantly correlate with positional variation of any of the measured elements or storage products. Protein and oil concentrations were strongly negatively correlated, as expected. In terms of minerals and storage products, the quadrant variation in protein concentration correlated negatively with Fe and Cu, and positively with Mn, and the reciprocal pattern was apparent with oil concentration. Among the minerals, highly correlated element pairs included Fe–Cu, Ca–Sr, Ca–Mn, and Zn–Cu, and between P and S, Zn, and Co. As noted earlier, Ca and Sr are chemical analogs and frequently correlated (Baxter, 2009), but surprisingly, other chemical analog pairs such as K–Rb were not observed. Fe and Cu were positively paired and have been reported to be positively correlated in soybean seeds (Vasconcelos, Clemente & Grusak, 2014) but the basis for the pairing is unknown. Correlations between P and minerals are often considered to reflect association of the mineral with seed phytate, the principal form of P in seeds (Vreugdenhil et al., 2004).
values of the parameters.Figure 4Bshows a matrix plot of correlations between plot means. Compared to the corresponding plot that focused on quadrant variation (Fig. 4A), many more strong correlations were apparent when comparing plot means. For example, protein concentration was positively correlated with S and Zn (and more weakly with Fe). The correlation with S is expected as the total seed S has been shown to track closely with high cysteine- and methionine- containing proteins in the soybean seed (Krishnan et al., 2012). The correlations between protein content, Zn and Fe could be due to their primary role as cofactors of metalloproteins or to variation in senescence in leaves leading to nutrient remobilization (Uauy et al., 2006). Accordingly, there was a significant negative correlation of Fe, S, and Zn with oil concentration. Interestingly, there was also a strongly significant negative correlation of P with oil, whereas the positive correlation of P with protein concentration was relatively weak. The majority of mineral correlations were positive in nature, with a maxi-cluster of Rb, Mn, Sr, Mg, Ni, and Na and a mini-cluster of Fe, Cu and Zn. The mini-cluster pairs of Fe–Cu and Cu–Zn were noted in the plot ofFig. 4A, but several members of the maxi-cluster correlation were not reported in the plot normalized correlation matrix. For example, Mn and Mg concentrations did not relate to each other in terms of quadrant variation but were strongly positively correlated based on plot means, indicating that mineral uptake may be similar but allocation among seeds in different quadrants is controlled separately. Finally, P concentration exhibited a positive correlation with Mn, Fe, Cu, Zn, S and Co. The link among P and Zn, S and Co concentrations with quadrant variation was observed (Fig. 4A), but when analyzed in terms of plot means in
Fig. 4Bthe association of P with Mn, Fe, and Cu became apparent as well. It is worth noting that in terms of plot means, there was no association between Ca and Sr suggesting that these chemical analogs do not always behave similarly. There was also a strong negative correlation between Mo and Sr, and Mo and S, perhaps suggesting a common component of the uptake system. Readers can explore all of the correlations and the underlying data inFiles S3–S5.
Canopy microenvironment impacts seed composition
the canopy positional effect on Mg, Fe and Cu was unaltered by the thinning treatment whereas Ca and Sr were similar to one another and showed a significant effect of thinning but only in one of the two test years (2010). The general conclusion is that thinning affects the canopy positional effect on some but not all minerals. This suggests that at least for Mg, Fe and Cu, the transport and homeostasis mechanisms are generally independent of instantaneous environmental factors and the transport of sucrose and amino acids into the developing seeds is not the sole factor driving their movement into seeds.
Seed fill period and seed composition
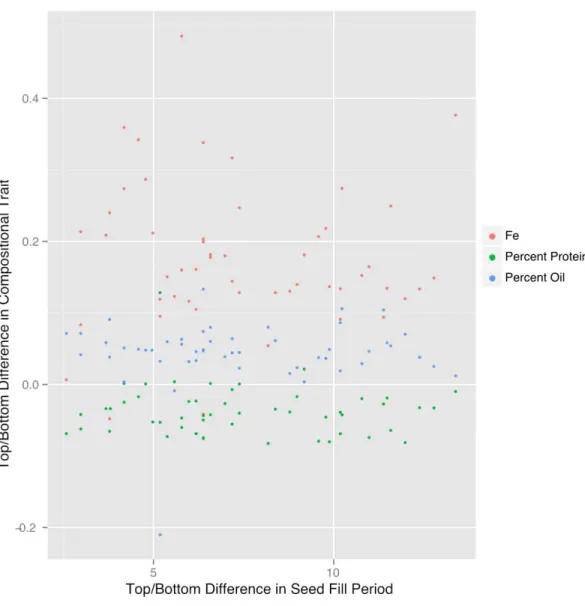
Another factor that could contribute to canopy position effects on seed composition is the duration of the seed-fill period (SFP), which is affected by genetic and environmental factors and is one of the major determinants of yield potential in soybean (Evans et al., 1995). Soybeans flower in response to photoperiod and the first flowers form lower in the canopy followed by flowering at upper nodes. Pods then form in the same order and when fully elongated the process of seed development is considered to begin when seeds are approximately 0.34 centimeter long (by visual inspection). In general, seeds lower in the canopy fill over a longer period but at a lower rate compared to seeds at the top of the canopy (Raboy & Dickinson, 1987) so that at maturity, final seed size tends to be rather constant through the canopy rather than increasing progressively from bottom to top of the canopy. We measured the SFPs with our core group of ten lines and found substantial differences in SFPs at the bottom and top of the canopy (Table S3). Top SFP was generally correlated with bottom SFP, as would be expected, but the difference in SPF (bottom–top position) was not correlated with the canopy gradients of protein, oil, or Fe (Fig. 6). Therefore, factors other than the duration of the SFP are responsible for the documented variation in composition with nodal position.
Iron concentrations of soybean seed products
Figure 6 Difference in top/bottom composition traits is not correlated with seed fill period.The differ-ence in plot normalized composition between the top quad and the bottom quad for protein, oil and iron plotted versus the difference in seed fill period for 51 plots in 2012.
The vegetative soybean ionome
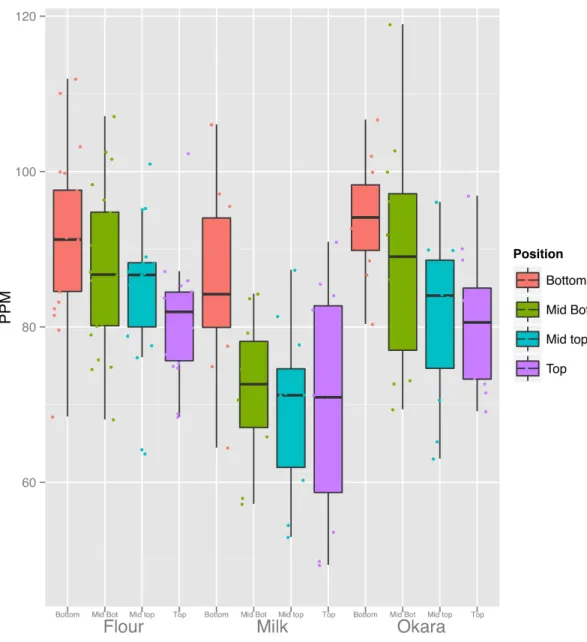
Figure 7 Canopy differences in iron are reflected in food products.Fe content of the products from 3 replicates of seven lines (flour) and four lines (Milk and Okara). Boxplots display the five number summary (median, 25, and 75% percentile define the box, with whiskers extending to 1.5×interquartile range).
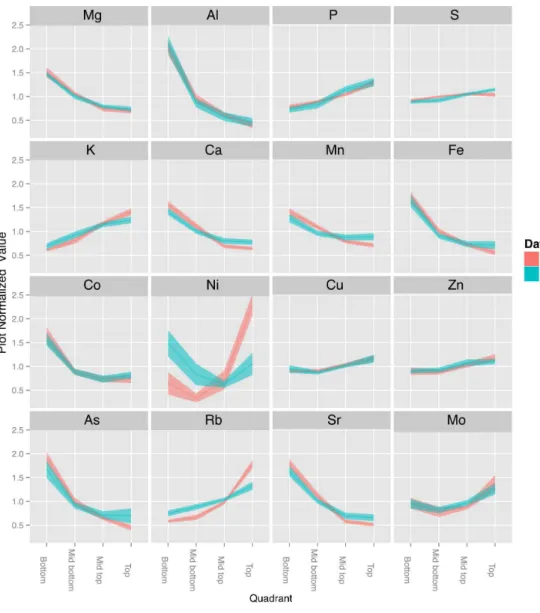
Figure 8 Canopy gradients of leaf composition traits.For each trait, the data was normalized to the plot average to remove the effect of environment and genotype. The plots display the quadrant average as a line with the 95% confidence interval calculated using standard error as the ribbon. Elements with a significant (p<1e−10) effect of gradient in an ANOVA analysis that included Entry, Collection Date and Position.
A final point to note is that the potential exists for some soil particles to adhere to vegetative plant parts, especially lower in the canopy, while seeds are protected from soil contamination by the pods. Since some minerals exhibited opposite patterns, it seems that soil adhesion could not be completely responsible for the patterns observed.
Node position and the developing seed metabolome
Developing seeds were analyzed to determine whether canopy position affected seed metabolism sufficiently to explain the observed differences in protein and oil concentrations at maturity. To do this, we collected developing seeds (cultivar ‘Williams 82’) from the top and bottom of the canopy at several time points over a 24-h period. Because seeds at the top and bottom of the canopy differed in size on the day of the experiment, seeds from the top of the canopy were also collected 6 days later when they had reached the same size (fresh weight seed−1) as the bottom seeds on the first collection date. All seeds were at the stage of development where cell expansion and accumulation of storage compounds (protein and oil) were the dominant metabolic processes (Collakova et al., 2013). Untargeted metabolite profiling was conducted for analysis of polar compounds, free amino acids, free fatty acids, and total fatty acids (File S7).
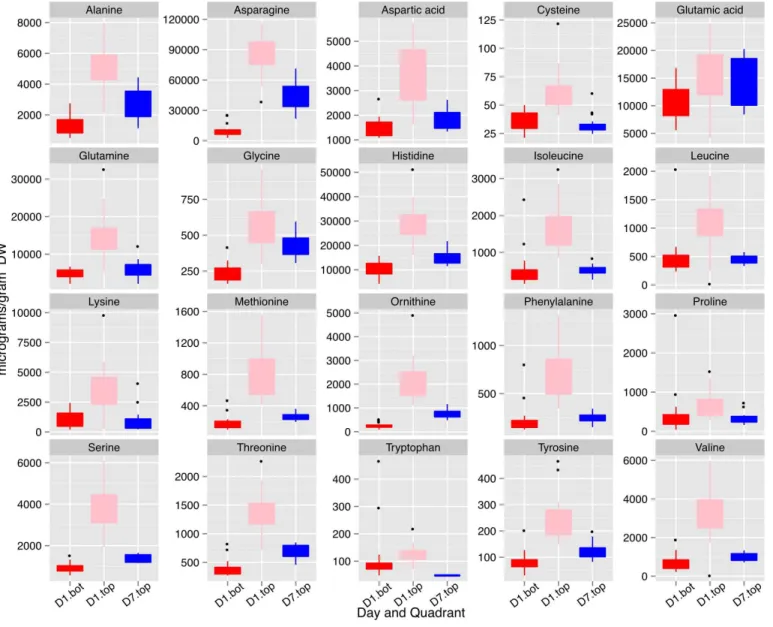
In general, most metabolites did not show diurnal changes in concentration, but there were differences in concentrations as a function of seed size and node position. The metabo-lite plots in Fig. 9illustrate some of the different patterns observed. The concentration of sucrose (Fig. 9A) in developing seeds did not vary diurnally and remained relatively constant but the concentration was slightly higher in the smallest seeds (day 1, top seed) compared to the larger seeds sampled at the bottom position on day 1 or top position on day 7. The decrease in sucrose concentration comparing top seed on day 1 and day 7 likely reflects in part the dilution effect caused by storage product accumulation as the seeds increased in size by roughly 2-fold. In contrast, the concentration of citrate in developing seeds was roughly equal among the three samples (Fig. 9B). These results suggest that seeds actually accumulate sucrose and to a larger extent citrate as they increase in dry matter during seed fill (thereby negating the dilution effect caused by seed growth). This also indicates that developing seeds have ample sugars and organic acids irrespective of size and node position and time of day. In marked contrast to sucrose and citrate were the dramatic differences observed in free asparagine (Asn) concentration (Fig. 9C), which was highest in top seed sampled on day 1 (Aug 20), and lowest in bottom seed sampled on the same day; the difference was roughly 8-fold. Sampling top seed on day 7 (Aug 26), when seed size was equivalent to that of bottom seed on day 1, still resulted in a∼4-fold elevation
Figure 10 Concentrations of free amino acids in developing seeds.Boxplots display the five number summary (median, 25, and 75% percentile define the box, with whiskers extending to 1.5×interquartile range) for values from each sampling interval (3 replicates and 4 time points are merged within each box) and nodal position. Ornithine levels reflect both ornithine and arginine as arginine is converted to ornithine during sample prep for GC-MS. D1.bot, D1.top and D7.top refer to the samples collected on day one top and bottom quadrants and the day seven top quadrant respectively.
DISCUSSION
The present study yields two major conclusions. First, the position along the main stem at which soybean seeds develop has a profound impact on seed composition, affecting the concentrations of protein, oil and certain minerals at maturity. Second, the canopy position effects on seed mineral concentrations (in particular Fe) are sufficiently large that there may be direct implications for human nutrition in countries where plants are the main source of protein and soybeans are used for human food. These conclusions are discussed in more detail below.
Positional effects on seed protein and oil concentration are broadly observed
thereby restricting the ability of those leaves to provide Asn (and Gln) to developing seeds. In contrast, removal of neighboring plants (in the ‘thinned’ plant treatment) would increase light at lower nodes thereby enhancing overall leaf metabolism and the flux of reduced nitrogen to subtending pods resulting in increased protein (and reduced oil) accumulation.
Positional effects on seed mineral concentration are documented The concentration of minerals in seeds reflects the combined action of transport processes and regulation at multiple steps starting with mobilization from the soil, uptake into the root, and transport to the shoot for distribution among organs (Grusak, Dellapenna & Welch, 1999;Waters & Grusak, 2008). Deposition of some minerals in seeds can also involve remobilization from leaves during seed filling (Grusak, Dellapenna & Welch, 1999; Hocking & Pate, 1977), and it is interesting that different minerals show fundamentally different profiles of accumulation in seeds as a function of canopy position (Fig. 3). These differences could reflect alternate routes from the apoplast to the symplast or differences in mobility in the phloem (White, 2012). Interestingly, minerals that tended to have highest concentrations in seeds at the bottom of the canopy (e.g., Mg, Fe, and Cu) are considered to have moderate to good phloem mobility compared to the minerals that tended to concentrate in the top of the canopy such as Mn (and in some cases Ca) that are considered to have poor phloem mobility. These results suggest that remobilization from leaves may be playing some role at least in the positional effects on the mature seed ionome. Another factor that may impact the distribution of minerals in seeds along the mainstem is precipitation. This speculation is based on the increased concentrations of Ca, Mn, and Sr found in seeds at the top of the canopy in 2010, which had above normal precipitation. It is possible that increased precipitation resulted in greater xylem transport of certain minerals (including Ca, Mn, and Sr) to developing seeds at the top of the canopy, or alternatively, that weather conditions in 2010 allowed greater remobilization of selected minerals from leaves via the xylem. It is recognized that while Ca and Mn are generally considered to have very low phloem mobility and are therefore not remobilized from senescing leaves, there is variation among species in the extent of remobilization (Maillard et al., 2015). Conceivably, remobilization may also be triggered from leaves of all species under certain conditions.
controlled by different mechanisms, and in general, canopy positional effects on minerals and protein/oil appear to be controlled by distinct mechanisms. It should be noted that altering the microenvironment by thinning plants did affect the observed gradients in seed concentrations of Ca, Mn, and Sr, which were also the minerals altered in distribution in 2010 (the year of this study with above normal precipitation). These results highlight the differences among minerals in terms of factors controlling their distribution among seed produced at different node positions. Clear, continued studies in the future will be required to sort out the different mechanisms involved.
Human nutrition implications for variation in seed composition
Soybeans are valued for their protein and oil content, but when used for human nutrition the content of minerals such as iron and zinc is also critically important. On a global scale, human iron deficiency is one of the most prevalent nutritional disorders (McLean et al., 2009) especially in countries where plant-based diets are prominent. As discussed above, nodal position affected the concentration of several minerals such as Mg, Fe, and Cu that were present at higher concentrations in seeds produced at the bottom of the canopy. Iron is of particular interest and was generally 20% higher in seeds produced lower in the canopy relative to the top and as expected, differences in seed iron concentrations affected the concentration of iron in soy food products made from those seeds (Fig. 7). Soy flour preserved more Fe than did milk; perhaps mineral retention improvement through product preparation is possible. An immediate application of our results with respect to human nutrition would be to use seeds from the top and bottom halves of the canopy for different purposes, with seeds produced in the lower half reserved for production of iron-rich soy foods for human consumption. Thus, knowledge of these canopy position effects provides an unexpected approach to link agronomic practices to improve human nutrition and health.
New type of seed heteromorphism and implications for climate change impacts
Seed heteromorphism is well established (Matilla, Gallardo & Puga-Hermida, 2005) but the seed heterogeneity documented here establishes a new category where an individual plant produces a continuum of seeds that differ in major aspects of their composition (protein, oil, and minerals) but are morphologically very similar. Overall, our results raise a number of questions and directions for future research. For example, it would be interesting to explore whether there are positional effects on soybean seed functional traits such as seed vigor or seedling stress tolerance. Because environment during reproductive development of plants is now recognized to broadly impact seed properties, such as growth performance and stress tolerance of the progeny (Biodner et al., 2007;Tricker et al., 2013), it will be interesting to further explore similar properties of soybean seed produced at the different parts of the canopy. Our results also raise the question of whether similar effects occur in other species including non-domesticated plants where there might be some ecological significance.
2014;Myers et al., 2014) that grain from many species, including soybean, have lower concentrations of Zn and Fe when plants are grown at elevated CO2thereby uncovering a new climate change challenge to global health. The meta-analysis established a∼5%
reduction in soybean seed Fe and Zn concentrations at high CO2. It is relevant to note that variation in seed Fe concentration with node position established in the present study is substantially larger (4-fold greater) compared to the impact of climate change on mean seed Fe concentration. Therefore, our results are likely to be meaningful from a quantitative standpoint and have important implications for examining the impact of climate change on the seed ionome. For example, it will be interesting to determine how this overall reduction in mean seed Fe concentration at elevated CO2is related (if at all) to canopy position effects; is Fe reduced 5% in seeds at nodes throughout the canopy or are certain positions affected to a greater degree than others? Identifying the molecular mechanisms underlying canopy gradients in composition may provide new approaches to controlling soybean seed quality for various uses, including food for human consumption under conditions of global climate change.
ACKNOWLEDGEMENTS
The authors thank Kunming University of Science and Technology (KUST), Kunming City, P.R. China for supporting the visit of Prof. Kunzhi Li to UIUC; Karl E. Weingarter and Marilyn L. Nash for advice on soy food preparation and providing access to the Test Kitchen facility of the National Soybean Research Laboratory at the University of Illinois and Greg Ziegler for expert technical assistance with ionomic analysis.
ADDITIONAL INFORMATION AND DECLARATIONS
Funding
Funding was provided by the United Soybean Board and the US Department of Agriculture—Agricultural Research Service. The funders had no role in study design, data collection and analysis, decision to publish, or preparation of the manuscript.
Grant Disclosures
The following grant information was disclosed by the authors:
United Soybean Board and the US Department of Agriculture—Agricultural Research Service.
Competing Interests
The authors declare there are no competing interests.
Author Contributions
• Steven C. Huber and Ivan Baxter conceived and designed the experiments, performed
the experiments, analyzed the data, wrote the paper, prepared figures and/or tables, reviewed drafts of the paper.
• Kunzhi Li and Catherine M. DeMuro performed the experiments, reviewed drafts of the
• Randall Nelson conceived and designed the experiments, performed the experiments,
contributed reagents/materials/analysis tools, reviewed drafts of the paper.
• Alexander Ulanov performed the experiments, analyzed the data, reviewed drafts of the
paper.
Data Availability
The following information was supplied regarding data availability:
The raw data can be downloaded from here:http://www.ionomicshub.org/home/PiiMS/ fileDownload?file=50.
Supplemental Information
Supplemental information for this article can be found online athttp://dx.doi.org/10.7717/ peerj.2452#supplemental-information.
REFERENCES
Baldocchi DD, Verma SB, Rosenberg NJ. 1983.Microclimate in the soybean canopy.
Agricultural Meteorology 28:321–337DOI 10.1016/0002-1571(83)90009-2.
Baxter I. 2009.Ionomics: studying the social network of mineral nutrients.Current
Opinion in Plant Biology12:381–386 DOI 10.1016/j.pbi.2009.05.002.
Biodner C, Goebel C, Feussner I, Gatz C, Polle A. 2007.Warm and cold parental
reproductive environments affect seed properties, fitness, and cold responsiveness in Arabidopsis thaliana progenies.Plant, Cell and Environment30:165–175
DOI 10.1111/j.1365-3040.2006.01615.x.
Carrera C, Martínez MJ, Dardanelli J, Balzarini M. 2009.Water deficit effect on the
re-lationship between temperature during the seed fill period and soybean seed oil and protein concentrations.Crop Science49:990–998DOI 10.2135/cropsci2008.06.0361.
Carrera C, Martínez MJ, Dardanelli J, Balzarini M. 2011.Environmental variation
and correlation of seed components in nontransgenic soybeans: protein, oil, unsaturated fatty acids, tocopherols, and isoflavones.Crop Science51:800–809
DOI 10.2135/cropsci2010.06.0314.
Collakova E, Aghamirzaie D, Fang Y, Klumas C, Tabataba F, Kakumanu A,
Myers E, Heath L, Grene R. 2013.Metabolic and transcriptional
reprogram-ming in developing soybean (Glycine max) embryos.Metabolites3:347–372
DOI 10.3390/metabo3020347.
Collins FI, Cartter JL. 1956.Variability in chemical composition of seed from
different portions of the soybean plant1.Agronomy Journal 48:216–219
DOI 10.2134/agronj1956.00021962004800050006x.
Drossopoulos JB, Bouranis DL, Bairaktari BD. 1994.Patterns of mineral nutrient
fluctuations in soybean leaves in relation to their position.Journal of Plant Nutrition 17:1017–1035DOI 10.1080/01904169409364785.
Duke SO, Reddy KN, Bu K, Cizdziel JV. 2012.Effects of glyphosate on the mineral
content of glyphosate-resistant soybeans (Glycine max).Journal of Agricultural and
Escalante EE, Wilcox JR. 1993a.Variation in seed protein among nodes of deter-minate and indeterdeter-minate soybean near-isolines.Crop Science33:1166–1168
DOI 10.2135/cropsci1993.0011183X003300060012x.
Escalante EE, Wilcox JR. 1993b.Variation in seed protein among nodes of
normal-protein and high-normal-protein soybean genotypes.Crop Science33:1164–1166
DOI 10.2135/cropsci1993.0011183X003300060011x.
Evans TA, Fuhrmann JJ, Nelson RL, Vasilas BL. 1995.Relationship of nitrogen
uti-lization patterns with soybean yield and seed-fill period.Crop Science35:809–813
DOI 10.2135/cropsci1995.0011183X003500030029x.
Grusak MA, Dellapenna D, Welch RM. 1999.Physiologic processes affecting the
content and distribution of phytonutrients in plants.Nutrition Reviews57:27–33
DOI 10.1111/j.1753-4887.1999.tb01804.x.
Herman EM. 2014.Soybean seed proteome rebalancing.Frontiers in Plant Science5:437
DOI 10.3389/fpls.2014.00437.
Hernandez-Sebastia C, Marsolais F, Saravitz C, Israel D, Dewey RE, Huber SC. 2005.
Free amino acid profiles suggest a possible role for asparagine in the control of storage-product accumulation in developing seeds of low- and high-protein soybean lines.Journal of Experimental Botany56:1951–1963DOI 10.1093/jxb/eri191.
Hocking PJ, Pate JS. 1977.Mobilization of minerals to developing seeds of legumes.
Annals of Botany41:1259–1278.
Jiménez MP, Effrón D, De la Horra AM, Defrieri R. 1996.Foliar potassium, calcium,
magnesium, zinc, and manganese content in soybean cultivars at different stages of development.Journal of Plant Nutrition19:807–816
DOI 10.1080/01904169609365163.
Krishnan HB, Jang S, Baxter I, Wiebold WJ. 2012.Growing location has a pronounced
effect on the accumulation of cancer chemopreventive agent Bowman-Birk inhibitor in soybean seeds.Crop Science52:1786–1794DOI 10.2135/cropsci2011.11.0593.
Loladze I. 2014.Hidden shift of the ionome of plants exposed to elevated CO2 depletes
minerals at the base of human nutrition.Elife3:e02245DOI 10.7554/eLife.02245.
Maillard A, Diquélou S, Billard V, Laîné P, Garnica M, Prudent M, Garcia-Mina J-M,
Yvin J-C, Ourry A. 2015.Leaf mineral nutrient remobilization during leaf
senes-cence and modulation by nutrient deficiency.Frontiers in Plant Science6:317
DOI 10.3389/fpls.2015.00317.
Matilla A, Gallardo M, Puga-Hermida MI. 2005.Structural, physiological and
molec-ular aspects of heterogeneity in seeds: a review.Seed Science Research15:63–76
DOI 10.1079/SSR2005203.
McGrath JM, Lobell DB. 2013.Reduction of transpiration and altered nutrient allocation
contribute to nutrient decline of crops grown in elevated CO(2) concentrations.
Plant, Cell and Environment 36:697–705DOI 10.1111/pce.12007.
McLean E, Cogswell M, Egli I, Wojdyla D, de Benoist B. 2009.Worldwide prevalence
of anaemia, WHO Vitamin and Mineral Nutrition Information System, 1993–2005.
Miller AJ, Fan X, Shen Q, Smith SJ. 2008.Amino acids and nitrate as signals for the regulation of nitrogen acquisition.Journal of Experimental Botany59:111–119
DOI 10.1093/jxb/erm208.
Myers SS, Zanobetti A, Kloog I, Huybers P, Leakey AD, Bloom AJ, Carlisle E, Dietterich LH, Fitzgerald G, Hasegawa T, Holbrook NM, Nelson RL, Ottman MJ, Raboy V,
Sakai H, Sartor KA, Schwartz J, Seneweera S, Tausz M, Usui Y. 2014.Increasing
CO2 threatens human nutrition.Nature510:139–142DOI 10.1038/nature13179.
Pandurangan S, Pajak A, Molnar SJ, Cober ER, Dhaubhadel S, Hernandez-Sebastia
C, Kaiser WM, Nelson RL, Huber SC, Marsolais F. 2012.Relationship between
asparagine metabolism and protein concentration in soybean seed.Journal of
Experimental Botany63:3173–3184DOI 10.1093/jxb/ers039.
Pandurangan S, Pajak A, Rintoul T, Beyaert R, Hernandez-Sebastia C, Brown DC,
Marsolais F. 2015.Soybean seeds overexpressing asparaginase exhibit reduced
nitrogen concentration.Physiologia Plantarum155:126–137DOI 10.1111/ppl.12341.
Raboy V, Dickinson DB. 1987.The timing and rate of phytic acid accumulation in
developing soybean seeds.Plant Physiology85:841–844DOI 10.1104/pp.85.3.841.
Rotundo JL, Westgate ME. 2009.Meta-analysis of environmental effects on soybean seed
composition.Field Crops Research110:147–156DOI 10.1016/j.fcr.2008.07.012.
Saldivar X, Wang Y-J, Chen P, Hou A. 2011.Changes in chemical composition during
soybean seed development.Food Chemistry124:1369–1375
DOI 10.1016/j.foodchem.2010.07.091.
Sankaran RP, Grusak MA. 2014.Whole shoot mineral partitioning and accumulation in
pea (Pisum sativum).Frontiers in Plant Science5:149 DOI 10.3389/fpls.2014.00149.
Seddigh M, Jolliff GD. 1986.Remobilization patterns of C and N in soybeans with
different sink-source ratios induced by various night temperatures.Plant Physiology 81:136–141DOI 10.1104/pp.81.1.136.
Sha Z, Oka N, Watanabe T, Tampubolon BD, Okazaki K, Osaki M, Shinano T. 2012.
Ionome of soybean seed affected by previous cropping with mycorrhizal plant and manure application.Journal of Agricultural and Food Chemistry60:9543–9552
DOI 10.1021/jf3024744.
Storey JD. 2002.A direct approach to false discovery rates.Journal of the Royal Statistical
Society: Series B64:479–498DOI 10.1111/1467-9868.00346.
Streeter JG, Jeffers DL. 1979.Distribution of total non-structural carbohydrates in
soybean plants having increased reproductive load.Crop Science19:729–734
DOI 10.2135/cropsci1979.0011183X001900050046x.
Tricker P, López C, Gibbings G, Hadley P, Wilkinson M. 2013.Transgenerational,
dynamic methylation of stomata genes in response to low relative humidity.
International Journal of Molecular Sciences14:6674–6689DOI 10.3390/ijms14046674.
Uauy C, Distelfeld A, Fahima T, Blechl A, Dubcovsky J. 2006.A NAC gene
Vasconcelos MW, Clemente T, Grusak MA. 2014.Evaluation of constitutive iron re-ductase (AtFRO2) expression on mineral accumulation and distribution in soybean (Glycine max. L).Frontiers in Plant Science 5:112DOI 10.3389/fpls.2014.00112.
Vreugdenhil D, Aarts M, Koornneef M, Nelissen H, Ernst W. 2004.Natural variation
and QTL analysis for cationic mineral content in seeds of Arabidopsis thaliana.Plant,
Cell and Environment 27:828–839DOI 10.1111/j.1365-3040.2004.01189.x.
Waters BM, Grusak MA. 2008.Whole-plant mineral partitioning throughout the
life cycle in Arabidopsis thaliana ecotypes Columbia, Landsberg erecta, Cape Verde Islands, and the mutant line ysl1ysl3.New Phytologist 177:389–405
DOI 10.1111/j.1469-8137.2007.02288.x.
White PJ. 2012. Chapter 3—Longdistance transport in the xylem and phloem A2
-Marschner, Petra. In:Marschner’s mineral nutrition of higher plants. third edition. San Diego: Academic Press, 49–70.
Wilcox JR. 1998.Increasing seed protein in soybean with eight cycles of recurrent
selec-tion.Crop Science38:1536–1540DOI 10.2135/cropsci1998.0011183X003800060021x.
Wolf RB, Cavins JF, Kleiman R, Black LT. 1982.Effect of temperature on soybean seed
constituents: oil, protein, moisture, fatty acids, amino acids and sugars.Journal of the
American Oil Chemists’ Society59:230–232DOI 10.1007/BF02582182.
Xia J, Wishart DS. 2011.Web-based inference of biological patterns, functions and
pathways from metabolomic data using MetaboAnalyst.Nature Protocols6:743–760
DOI 10.1038/nprot.2011.319.
Ziegler G, Terauchi A, Becker A, Armstrong P, Hudson K, Baxter I. 2013.Ionomic