www.biogeosciences.net/13/5245/2016/ doi:10.5194/bg-13-5245-2016
© Author(s) 2016. CC Attribution 3.0 License.
Effect of cover crops on greenhouse gas emissions in an irrigated
field under integrated soil fertility management
Guillermo Guardia1, Diego Abalos2, Sonia García-Marco1, Miguel Quemada1, María Alonso-Ayuso1, Laura M. Cárdenas3, Elizabeth R. Dixon3, and Antonio Vallejo1
1ETSI Agronomos, Technical University of Madrid, Ciudad Universitaria, 28040 Madrid, Spain 2School of Environmental Sciences, University of Guelph, Guelph, Ontario, N1G 2W1, Canada 3Rothamsted Research, North Wyke, Devon, EX20 2SB, UK
Correspondence to:Guillermo Guardia (guillermo.guardia@upm.es)
Received: 27 January 2016 – Published in Biogeosciences Discuss.: 29 March 2016 Revised: 30 August 2016 – Accepted: 2 September 2016 – Published: 20 September 2016
Abstract. Agronomical and environmental benefits are as-sociated with replacing winter fallow by cover crops (CCs). Yet, the effect of this practice on nitrous oxide (N2O)
emis-sions remains poorly understood. In this context, a field ex-periment was carried out under Mediterranean conditions to evaluate the effect of replacing the traditional winter fal-low (F) by vetch (Vicia sativa L.; V) or barley (Hordeum
vulgare L.; B) on greenhouse gas (GHG) emissions
dur-ing the intercrop and the maize (Zea maysL.) cropping pe-riod. The maize was fertilized following integrated soil fer-tility management (ISFM) criteria. Maize nitrogen (N) up-take, soil mineral N concentrations, soil temperature and moisture, dissolved organic carbon (DOC) and GHG fluxes were measured during the experiment. Our management (ad-justed N synthetic rates due to ISFM) and pedo-climatic con-ditions resulted in low cumulative N2O emissions (0.57 to
0.75 kg N2O-N ha−1yr−1), yield-scaled N2O emissions (3–
6 g N2O-N kg aboveground N uptake−1)and N surplus (31
to 56 kg N ha−1)for all treatments. Although CCs increased N2O emissions during the intercrop period compared to F
(1.6 and 2.6 times in B and V, respectively), the ISFM re-sulted in similar cumulative emissions for the CCs and F at the end of the maize cropping period. The higher C : N ratio of the B residue led to a greater proportion of N2O losses
from the synthetic fertilizer in these plots when compared to V. No significant differences were observed in CH4and CO2
fluxes at the end of the experiment. This study shows that the use of both legume and nonlegume CCs combined with ISFM could provide, in addition to the advantages reported in previous studies, an opportunity to maximize agronomic
efficiency (lowering synthetic N requirements for the sub-sequent cash crop) without increasing cumulative or yield-scaled N2O losses.
1 Introduction
Improved resource-use efficiencies are pivotal components of sustainable agriculture that meets human needs and pro-tects natural resources (Spiertz, 2010). Several strategies have been proposed to improve the efficiency of intensive irrigated systems, where nitrate (NO−3)leaching losses are of major concern, during both cash crop and winter fallow pe-riods (Quemada et al., 2013). In this sense, replacing winter intercrop fallow with cover crops (CCs) has been reported to decrease NO−3 leaching via retention of post-harvest surplus inorganic nitrogen (N) (Wagner-Riddle and Thurtell, 1998), consequently improving N use efficiency of the cropping sys-tem (Gabriel and Quemada, 2011). Furthermore, the use of CCs as green manure for the subsequent cash crop may fur-ther increase soil fertility and N use efficiency (Tonitto et al., 2006; Veenstra et al., 2007) through slow release of N and other nutrients from the crop residues, leading to a saving in synthetic fertilizer.
From an environmental point of view, N fertilization is closely related to the production and emission of nitrous ox-ide (N2O) (Davidson and Kanter, 2014), a greenhouse gas
(GHG) with a molecular global warming potential ca. 300 times that of carbon dioxide (CO2)(IPCC, 2007). Nitrous
by nitrification and denitrification processes, which are in-fluenced by several soil variables (Firestone and Davidson, 1989). Thereby, modifying these parameters through agricul-tural management practices (e.g., fertilization, crop rotation, tillage or irrigation) aiming to optimize N inputs can lead to strategies for reducing the emission of (N2O) (Ussiri and
Lal, 2013). In order to identify the most effective GHG mit-igation strategies, side effects of methane (CH4)uptake and
CO2emission (i.e., respiration) from soils, which are also
in-fluenced by agricultural practices (Snyder et al., 2009), need to be considered.
To date, the available information linking GHG emission and maize–winter CC rotation in the scientific literature is scarce. The most important knowledge gaps include effects of plant species selection and CC residue management (i.e., retention, incorporation or removal) (Basche et al., 2014). Cover crop species may affect N2O emissions in contrasting
ways by influencing abiotic and biotic soil factors. These fac-tors include mineral N availability in soil and the availability of carbon (C) sources for the denitrifier bacterial communi-ties, soil pH, soil structure and microbial community com-position (Abalos et al., 2014). For example, nonlegume CCs such as winter cereals could contribute to a reduction of N2O
emissions due to their deep roots, which allow them to ex-tract soil N more efficiently than legumes (Kallenbach et al., 2010). Conversely, it has been suggested that the higher C : N ratio of their residues as compared to those of legumes may provide energy (C) for denitrifiers, thereby leading to higher N2O losses in the presence of mineral N-NO−3 from
fertiliz-ers (Sarkodie-Addo et al., 2003). In this sense, the presence of cereal residues can increase the abundance of denitrify-ing microorganisms (Gao et al., 2016), thus enhancdenitrify-ing den-itrification losses when soil conditions are favorable (e.g., high NO−3 availability and soil moisture after rainfall or ir-rigation events, particularly in fine-textured soils) (Stehfest and Bouwman 2006; Baral et al., 2016). Furthermore, win-ter CCs can also abate indirect gaseous N losses through the reduction of leaching and subsequent emissions from wa-ter resources (Feyereisen et al., 2006). Thus, the estimated N2O mitigation potential for winter CCs ranges from 0.2 to
1.1 kg N2O ha−1yr−1according to Ussiri and Lal (2013).
In a CC–maize rotation system, mineral fertilizer applica-tion to the cash crop could have an important effect on N use efficiency and N losses from the agro-ecosystem. Different methods for calculating the N application rate (e.g., conven-tional or integrated) can be employed by farmers, affecting the amount of synthetic N applied to soil and the overall ef-fect of CCs on N2O fluxes. Integrated soil fertility
manage-ment (ISFM) (Kimani et al., 2003) provides an opportunity to optimize the use of available resources, thereby reducing pollution and costs from overuse of N fertilizers (conven-tional management). ISFM involves the use of inorganic fer-tilizers and organic inputs, such as green manure, and aims to maximize agronomic efficiency (Vanlauwe et al., 2011). When applying this technique to a CC–maize crop rotation,
the N fertilization rate for maize is calculated taking into ac-count the background soil mineral N and the expected avail-able N from mineralization of CC residues, which depends on residue composition. Differences in soil mineral N during the cash crop phase may be significantly reduced if ISFM practices are employed, affecting the GHG balance of the CC–cash crop cropping system.
Only one study has investigated the effect of CCs on N2O
emissions in Mediterranean cropping systems (Sanz-Cobena et al., 2014). These authors found an effect of CC species on N2O emissions during the intercrop period. After 4 years of
CC (vetch, barley or rape)–maize rotation, vetch was the only CC species that significantly enhanced N2O losses compared
to fallow, mainly due to its capacity to fix atmospheric N2
and because of higher N surplus from the previous cropping phases in these plots. In this study a conventional fertilization (same N synthetic rate for all treatments) was applied during the maize phase; how ISFM practices may affect these find-ings remains unknown. Moreover, the relative contribution of mineral N fertilizer, CC residues and/or soil mineral N to N2O losses during the cash crop has not been assessed yet. In
this sense, stable isotope analysis (i.e.,15N) represents a way to identify the source and the dominant processes involved in N2O production (Arah, 1997). Stable isotope techniques
have been used in field studies evaluating N leaching and/or plant recovery in systems with cover crops (Bergström et al., 2001; Gabriel and Quemada, 2011; Gabriel et al., 2016). Fur-thermore, some laboratory studies have evaluated the effect of different crop residues on N2O losses using 15N
tech-niques (Baggs et al., 2003; Li et al., 2016), but to date, no previous studies have evaluated the relative contribution of cover crops (which include the aboveground biomass and the decomposition of root biomass) and N synthetic fertilizers to N2O emissions under field conditions. A comprehensive
understanding of the N2O biochemical production pathways
and nutrient sources is crucial for the development of effec-tive mitigation strategies.
The objective of this study was to evaluate the effect of two different CC species (barley and vetch) and fallow on GHG emissions during the CC period and during the fol-lowing maize cash crop period in an ISFM system. An ad-ditional objective was to study the contribution of the syn-thetic fertilizer and other N sources to N2O emissions using 15N-labeled fertilizer. We hypothesized that (1) the presence
of CCs instead of fallow would affect N2O losses, leading
to higher emissions in the case of the legume CC (vetch) in accordance with the studies of Basche et al. (2014) and Sanz-Cobena et al. (2014) and (2) in spite of the ISFM during the maize period, which theoretically would lead to similar soil N availability for all plots, the distinct composition of the CC residues would affect N2O emissions. In order to test these
cropping system, CH4, CO2and yield-scaled N2O emissions
were also analyzed during the experimental period. The rel-ative contribution of each N source (synthetic fertilizer or soil endogenous N, including N mineralized from the CCs) to N2O emissions was also evaluated by15N-labeled
ammo-nium nitrate in a parallel experiment.
2 Materials and methods 2.1 Site characteristics
The study was conducted at “La Chimenea” field station (40◦03′N, 03◦ 31′W; 550 m a.s.l.), located in the central Tajo River basin near Aranjuez (Madrid, Spain), where an experiment involving cover-cropping systems and conser-vation tillage has been carried out since 2006. Soil at the field site is a silty clay loam (Typic Calcixerept; Soil Sur-vey Staff, 2014). Some of the physicochemical properties of the top 0–10 cm soil layer, as measured by conven-tional methods, were as follows: pHH2O, 8.16; total organic
C, 19.0 g kg−1; CaCO3, 198 g kg−1; clay, 25 %; silt, 49 %;
and sand, 26 %. Bulk density of the topsoil layer deter-mined in intact core samples (Grossman and Reinsch, 2002) was 1.46 g cm−3. Average ammonium (NH+4)content at the beginning of the experiment was 0.42±0.2 mg N kg soil−1
(without differences between treatments). Nitrate concentra-tions were 1.5±0.2 mg N kg soil−1in fallow and barley and
0.9±0.1 mg N kg soil−1in vetch. Initial dissolved organic C
(DOC) contents were 56.0±7 mg C kg soil−1 in vetch and
fallow and 68.8±5 mg C kg soil−1in barley. The area has a
Mediterranean semiarid climate, with a mean annual air tem-perature of 14◦C. The coldest month is January, with a mean temperature of 6◦C, and the hottest month is August, with a mean temperature of 24◦C. During the last 30 years, the mean annual precipitation has been approximately 350 mm (17 mm from July to August and 131 mm from September to November).
Hourly rainfall and air temperature data were obtained from a meteorological station located at the field site (CR10X, Campbell Scientific Ltd., Shepshed, UK). A tem-perature probe inserted 10 cm into the soil was used to mea-sure soil temperature. Mean hourly temperature data were stored on a data logger.
2.2 Experimental design and agronomic management Twelve plots (12 m×12 m) were randomly distributed in four replications of three cover-cropping treatments, includ-ing a cereal and a legume: (1) barley (B) (Hordeum vul-gareL. ‘Vanessa’), (2) vetch (V) (Vicia sativaL. ‘Vereda’), and (3) traditional winter fallow (F). Cover crop seeds were broadcast by hand over the stubble of the previous crop and covered with a shallow cultivator (5 cm depth) on 10 October 2013, at a rate of 180 and 150 kg ha−1for B and V, respec-tively. The cover-cropping phase finished on 14 March 2014
following local practices, with an application of glyphosate (N-phosphonomethyl glycine) at a rate of 0.7 kg a.e. ha−1.
Even though the safe use of glyphosate has been under dis-cussion for many years (Chang and Delzell, 2016), it was used in order to preserve the same killing method in all the campaigns in this long-term experiment under conservation tillage management. All of the CC residues were left on top of the soil. Thereafter, a new set of N fertilizer treatments was set up for the maize cash crop phase. Maize (Zea maysL., Pi-oneer P1574, FAO Class 700) was directly drilled on 7 April 2014 in all plots, resulting in a plant population density of 7.5 plants m−2; harvesting took place on 25 September 2014. The fertilizer treatments consisted of ammonium nitrate ap-plied on 2 June at three rates: 170, 140 and 190 kg N ha−1 in F, V and B plots, respectively, according to ISFM prac-tices. For the calculation of each N rate, the N available in the soil (which was calculated following soil analysis as de-scribed below), the expected N uptake by maize crop, and the estimated N mineralized from V and B residues were taken into account, assuming that crop requirements were 236.3 kg N ha−1 (Quemada et al., 2014). Estimated N use efficiency of maize plants for calculating N application rate was 70 % according to the N use efficiency obtained during the previous years in the same experimental area. Each plot received P as triple superphosphate (45 % P2O5, Fertiberia®,
Madrid, Spain) at a rate of 69 kg P2O5ha−1, and K as
potas-sium chloride (60 % K2O, Fertiberia®, Madrid, Spain) at a
rate of 120 kg K2O ha−1just before sowing maize. All N, P
and K fertilizers were broadcast by hand, and immediately after N fertilization the field was irrigated to prevent ammo-nia volatilization. The main crop previous to sowing CCs was sunflower (Helianthus annuusL. ‘Sambro’). Neither the sun-flower nor the CCs were fertilized.
In order to determine the amount of N2O derived
from the N fertilizers, double-labeled ammonium ni-trate (15NH154 NO3, 5 at.% 15N, from Cambridge Isotope
Laboratories, Inc., Massachusetts, USA) was applied on 2 m×2 m subplots established within each plot at a rate of
130 kg N ha−1. In order to reduce biases due to the use of different N rates (e.g., apparent priming effects or different mixing ratios between the added and resident soil N pools) the same amount of N was applied for all treatments. In each subplot, the CC residue was also left on top of the soil. This application took place on 26 May by spreading the fertilizer homogenously with a hand sprayer, followed by an irrigation event.
Sprinkler irrigation was applied to the maize crop at a to-tal amount of 688.5 mm in 31 irrigation events. Sprinklers were installed in a 12 m×12 m framework. The water doses
to be applied were estimated from the crop evapotranspira-tion (ETc) of the previous week (net water requirements). This was calculated daily as ETc=Kc×ETo, where ETo is
crop coefficient (Kc) was obtained using the relationship for maize in semiarid conditions (Martínez-Cob, 2008).
Two different periods were considered for data reporting and analysis: Period I (from CC sowing to N fertilization of the maize crop) and Period II (from N fertilization of maize to the end of the experimental period, after maize harvest).
2.3 GHG emissions sampling and analyzing
Fluxes of N2O, CH4 and CO2 were measured from
Octo-ber 2013 to OctoOcto-ber 2014 using opaque, manually operated circular static chambers as described in detail by Abalos et al. (2013). One chamber (diameter 35.6 cm, height 19.3 cm) was located in each experimental plot. The chambers were hermetically closed (for 1 h) by fitting them into stainless steel rings, which were inserted at the beginning of the study into the soil to a depth of 5 cm in order to minimize the lateral diffusion of gases and to avoid the soil disturbance associated with the insertion of the chambers in the soil. The rings were only removed during management events. Each chamber had rubber sealing tape to guarantee an airtight seal between the chamber and the ring and was covered with a radiant barrier reflective foil to reduce temperature gradients between in-side and outin-side. A rubber stopper with a three-way stopcock was placed in the wall of each chamber to take gas samples. Greenhouse gas measurements were always made with bar-ley/vetch plants inside the chamber. During the maize period, gas chambers were set up between maize rows.
During Period I, GHGs were sampled weekly or every 2 weeks. During the first month after maize fertilization, gas samples were taken twice per week. Afterwards, gas sam-pling was performed weekly or fortnightly, until the end of the cropping period. To minimize any effects of diurnal vari-ation in emissions, samples were always taken at the same time of day (10:00–12:00), which is reported as a represen-tative time (Reeves and Wang, 2015).
Measurements of N2O, CO2 and CH4 emissions were
made at 0, 30 and 60 min to test the linearity of gas accu-mulation in each chamber. Gas samples (100 mL) were re-moved from the headspace of each chamber by syringe and transferred to 20 mL gas vials sealed with a gastight neo-prene septum. The vials were previously flushed in the field using 80 mL of the gas sample. Samples were analyzed by gas chromatography using a HP-6890 gas chromatograph equipped with a headspace autoanalyzer (HT3), both from Agilent Technologies (Barcelona, Spain). Inert gases were separated by HP Plot-Q capillary columns. The gas chro-matograph was equipped with a63Ni electron-capture detec-tor (micro-ECD) to analyze N2O concentrations, and with
a flame ionization detector (FID) connected to a methanizer to measure CH4and CO2(previously reduced to CH4). The
temperatures of the injector, oven and ECD were 50, 50 and 350◦C, respectively. The accuracy of the gas chromato-graphic data was 1 % or better. Two gas standards compris-ing a mixture of gases (high standard with 1500±7.50 ppm
CO2, 10±0.25 ppm CH4 and 2±0.05 ppm N2O and low
standard with 200±1.00 ppm CO2, 2±0.10 ppm CH4 and
200±6.00 ppb N2O) were provided by Carburos Metálicos
S.A. and Air Products SA/NV, respectively, and used to de-termine a standard curve for each gas. The response of the GC was linear within 200–1500 ppm for CO2and 2–10 ppm
CH4and quadratic within 200–2000 ppb for N2O.
The increases in N2O, CH4and CO2concentrations within
the chamber headspace were generally (80 % of cases) lin-ear (R2> 0.90) during the sampling period (1 h). Therefore, emission rates of fluxes were estimated as the slope of the linear regression between concentration and time (after cor-rections for temperature) and from the ratio between chamber volume and soil surface area (MacKenzie et al., 1998). Cu-mulative N2O, CH4and CO2emissions per plot during the
sampling period were estimated by linear interpolations be-tween sampling dates, multiplying the mean flux of two suc-cessive determinations by the length of the period between sampling and adding that amount to the previous cumulative total (Sanz-Cobena et al., 2014). The measurement of CO2
emissions from soil, including plants in opaque chambers, only includes ecosystem respiration and not photosynthesis (Meijide et al., 2010).
2.4 15N isotope analysis
Gas samples from the subplots receiving double-labeled AN fertilizer were taken after 60 min of static chamber closure 1, 4, 9, 11, 15, 18, 22 and 25 days after fertilizer applica-tion. Stable15N isotope analysis of N2O contained in the gas
samples was carried out on a cryo-focusing gas chromatog-raphy unit coupled to a 20/20 isotope ratio mass spectrom-eter (both from SerCon Ltd., Crewe, UK). Ambient samples were taken occasionally as required for the subsequent iso-topic calculations. Solutions of 6.6 and 2.9 at. % ammonium sulfate [(NH4)2SO4] were prepared and used to generate 6.6
and 2.9 at. % N2O (Laughlin et al., 1997), which were used
as reference and quality control standards. In order to calcu-late the atom percent excess (APE) of the N2O emitted in the
subplots, the mean natural abundance of atmospheric N2O
from the ambient samples (0.369 at. %15N) was subtracted from the measured enriched gas samples. To obtain the N2O
flux that was derived from fertilizer (N2O−Ndff), the
follow-ing equation was used (Senbayram et al., 2009): N2O−Ndff=N2O−N×
N2O_APEsample
APEfertilizer
, (1)
in which “N2O-N” is the N2O emission from soil,
“N2O_APEsample” is the 15N at. % excess of emitted N2O,
and “APEfertilizer” is the15N at. % excess of the applied
fer-tilizer (Senbayram et al., 2009). 2.5 Soil and crop analyses
sea-son on almost all gas-sampling occasions, particularly after each fertilization event. Three soil cores (2.5 cm diameter and 15 cm length) were randomly sampled close to the ring in each plot, and then mixed and homogenized in the lab-oratory. Soil NH+4 and NO−3 concentrations were analyzed using 8 g of soil extracted with 50 mL of KCl (1 M), and mea-sured by automated colorimetric determination using a flow injection analyzer (FIAS 400 Perkin Elmer) provided with a UV-visible spectrophotometer detector. Soil (DOC) was de-termined by extracting 8 g of homogeneously mixed soil with 50 mL of deionized water (and subsequently filtered) and an-alyzed with a total organic C analyzer (multi N/C 3100 Anal-ityk Jena) equipped with an IR detector. The water-filled pore space (WFPS) was calculated by dividing the volumetric wa-ter content by total soil porosity. Total soil porosity was cal-culated according to the following relationship: soil porosity
=(1−soil bulk density/2.65), assuming a particle density of 2.65 g cm−3(Danielson and Sutherland, 1986). Gravimetric
water content was determined by oven-drying soil samples at 105◦C with a Sartorius®MA30.
Four 0.5 m×0.5 m squares were randomly harvested from
each plot before killing the CC by applying glyphosate. Aerial biomass was cut by hand at soil level, dried, weighed and ground. A subsample was taken for determination of to-tal N content. From these samples the CC biomass and N contribution to the subsequent maize were determined.
At maize harvest, two 8 m central rows in each plot were collected and weighed in the field following separation of grain and straw. For aboveground N uptake calculations, N content was determined in subsamples of grain and biomass. Total N content of maize and CC subsamples was determined with an elemental analyzer (TruMac CN, Leco).
2.6 Calculations and statistical analysis
Yield-scaled N2O emissions and N surplus in the maize cash
crop were calculated as the amount of N2O emitted
(consid-ering the emissions of the whole experiment, i.e., Period I and Period II) per unit of aboveground N uptake and taking the difference between N application and aboveground N up-take, respectively (van Groenigen et al., 2010).
Statistical analyses were carried out with Statgraphics Plus 5.1. Analyses of variance were performed for all vari-ables during the experiment (except climatic ones), for both periods indicated in Sect. 2.2. Data distribution normality and variance uniformity were previously assessed by the Shapiro–Wilk test and Levene’s statistic, respectively, and transformed (log10, root square, arcsin or inverse) before analysis when necessary. Means of soil parameters were sep-arated by Tukey’s honest significance test atP< 0.05, while cumulative GHG emissions, yield-scaled N2O emissions and
N surplus were compared by the orthogonal contrasts method atP < 0.05. For non-normally distributed data, the Kruskal– Wallis test was used on non-transformed data to evaluate dif-ferences atP< 0.05. Linear correlations were carried out to
determine relationships between gas fluxes and WFPS, soil temperature, DOC, NH+4 and NO−3. These analyses were per-formed using the mean/cumulative data of the replicates of the CC treatments (n=12), and also for all the dates when soil and GHG were sampled, for Period I (n=16), Period II
(n=11) and the whole experimental period (n=27).
3 Results
3.1 Cover crop (Period I)
3.1.1 Environmental conditions and WFPS
Mean soil temperature during the intercrop period was 8.8◦C, ranging from 1.8 (December) to 15.5◦C (April) (Fig. 1a), which were typical values in the experimental area. Mean soil temperature during maize cropping period was 24.6◦C, which was also a standard value for this region. The accumulated rainfall during this period was 215 mm, whereas the 30-year mean is 253 mm. WFPS ranged from 40 to 81 % (Fig. 1b). No significant differences were observed for WFPS mean values between the different treatments (P> 0.05). 3.1.2 Mineral N and DOC and cover crop residues Topsoil NH+4 content was below 5 mg N kg soil−1 most of the time in Period I, although a peak was observed af-ter maize sowing (55 days afaf-ter CC kill date) (Fig. 2a), with the highest values reached in B (50 mg N kg soil−1). Mean NH+4 content was significantly higher in B than in F (P< 0.05), but daily NH+4 concentrations between treat-ments were only significantly different between treattreat-ments on one sampling date (210 days after CC sowing). Nitrate content increased after CC killing, reaching values above 25 mg N kg soil−1in the V treatment (Fig. 2c). Mean NO−3 content during Period I was significantly higher in the V plots than in the B and F plots (P< 0.001). Dissolved or-ganic C ranged from 60 to 130 mg C kg soil−1(Fig. 2e). Av-erage topsoil DOC content was significantly higher in B than in V and F (10 and 12 %, respectively, P< 0.01) but dif-ferences were only observed on some sampling dates. The total amount of cover crop biomass left on the ground was 540.5±26.5 and 1106.7±93.6 kg dry matter ha−1in B and
V, respectively. Accordingly, the total N content of these residues was 11.0±0.6 and 41.3±4.5 kg N ha−1 in B and
V, respectively. 3.1.3 GHG fluxes
Nitrous oxide fluxes ranged from −0.06 to
0.22 mg N m−2d−1 (Fig. 3a) in Period I. The soil acted as a sink for N2O at some sampling dates, especially for the
0 5 10 15 20 25 30 35
0 10 20 30 40
T
em
p
er
at
u
re (
°C)
Ir
rig
atio
n
/r
ain
fa
ll
(
m
m
)
Date
Irrigation Rainfall Soil temp
Period I Period II
(a)
0 10 20 30 40 50 60 70 80 90 100
0 20 40 60 80 100 120 140 160 180 200 220 240
W
FPS (
%
)
Days after CC sowing
F V B
(b)
0 10 20 30 40 50 60 70 80 90 100
-10 10 30 50 70 90 110 130
W
FPS (
%
)
Days after N fertilization
F V B
(c)
Figure 1.Daily mean soil temperature (◦C) rainfall and irrigation (mm)(a)and soil WFPS (%) in the three cover crop (CC) treatments (fallow, F; vetch, V; and barley, B) during Period I(b)and II(c). Vertical lines indicate standard errors.
uptake was observed in all intercrop treatments, and daily fluxes ranged from −0.60 to 0.25 mg C m−2d−1 (data not
shown). No significant differences were observed between treatments in cumulative CH4fluxes at the end of Period I
(P > 0.05; Table 1). Carbon dioxide fluxes (data not shown) remained below 1 g C m−2d−1 during the intercrop period. The greatest fluxes were observed in B, although differences in cumulative fluxes were not significant (P> 0.05; Table 1) in the whole intercrop period, but soil respiration was increased in B, with respect to F, from mid-February to the end of Period I. Nitrous oxide emissions were significantly correlated to CO2 fluxes (P< 0.01, n=17, r=0.69) and
soil temperature (P< 0.05,n=17,r=0.55).
3.2 Maize crop (Period II)
3.2.1 Environmental conditions and WFPS
Mean soil temperature ranged from 19.6 (reached in Septem-ber) to 32.3◦C (reached in August) with a mean value of 27.9◦C (Fig. 1a). Total rainfall during the maize crop period was 57 mm. WFPS ranged from 19 to 84 % (Fig. 1c). Higher mean WFPS values (P < 0.01) were measured in B during some sampling dates.
3.2.2 Mineral N and DOC
Topsoil NH+4 content increased rapidly after N fertilization (Fig. 2b), decreasing to values below 10 mg N kg soil−1from 15 days after fertilization to the end of the experimental period. Nitrate concentrations (Fig. 2d) also peaked after AN addition, reaching the highest value (170 mg N kg soil−1)
15 days after fertilization in B (P < 0.05). No significant dif-ferences (P> 0.05) between treatments were observed in av-erage soil NH+4 or NO−3 during the maize phase. Dissolved organic C ranged from 56 to 138 mg C kg soil−1 (Fig. 2f).
Average topsoil DOC content was 26 and 44 % higher in B than in V and F, respectively (P< 0.001).
3.2.3 GHG fluxes, yield-Scaled N2O emissions and N surplus
Nitrous oxide fluxes ranged from 0.0 to 5.6 mg N m−2d−1 (Fig. 3b). The highest N2O emission peak was observed 1–
4 days after fertilization for all plots. Other peaks were sub-sequently observed until 25 days after fertilization, particu-larly in B plots, where N2O emissions 23 and 25 days
af-ter fertilization were higher (P< 0.05) than those of F and V (Fig. 3b). No significant differences in cumulative N2O
fluxes were observed between treatments throughout or at the end of the maize crop period (Table 1), although fluxes were numerically higher in B than in V (0.05 <P < 0.10). Daily N2O emissions were significantly correlated with NH+4
top-soil content (P< 0.05,n=12,r=0.84).
As in the previous period, all treatments were CH4
sinks, without significant differences between treatments (P> 0.05; Table 1). Respiration rates ranged from 0.15 to 3.0 g C m−2d−1; no significant differences (P > 0.05; Ta-ble 1) were observed among the CO2 values for the
differ-ent treatmdiffer-ents. Yield-scaled N2O emissions and N surplus
are shown in Table 1. No significant differences were ob-served between treatments, although these values were gen-erally lower in V than in B (0.05 <P< 0.15).
Considering the whole cropping period (Period I and Period II), N2O fluxes significantly correlated with
WFPS (P< 0.05,n=12,r=0.61) NH+4 (P< 0.05,n=27,
r=0.84) and NO−
0 10 20 30 40 50 60 70
-10 10 30 50 70 90 110 130
mg
N
H4
+
-N
kg s
o
il
-1
F V B
(b)
0 50 100 150 200 250
-10 10 30 50 70 90 110 130
mg
N
O3
-
-N
kg s
o
il
-1
F V B
(d) 0
10 20 30 40 50 60 70
0 20 40 60 80 100 120 140 160 180 200 220 240
mg
N
H4
+-
N
kg
so
il
-1
F V B
0 5 10 15 20 25 30 35
0 20 40 60 80 100 120 140 160 180 200 220 240
mg
N
O3
-
-N
kg s
o
il
-1
F V B
(c)
0 20 40 60 80 100 120 140 160 180
0 20 40 60 80 100 120 140 160 180 200 220 240
m
g D
O
C
kg s
o
il
-1
Days after CC sowing
F V B
(e)
0 20 40 60 80 100 120 140 160 180
-10 10 30 50 70 90 110 130
m
g D
O
C
kg s
o
il
-1
Days after N fertilization
F V B
(f) (a)
Figure 2. (a, b)NH+4-N,(c, d)NO−3-N and(e, f)DOC concentrations in the 0–10 cm soil layer for the three CC treatments (fallow, F; vetch, V; and barley, B) during both cropping periods. The black arrows indicate the time of spraying glyphosate over the CCs. The dotted arrows indicate the time of maize sowing. Vertical lines indicate standard errors.
3.2.4 Fertilizer-derived N2O emissions
The proportion (%) of N2O losses from ammonium nitrate,
calculated by isotopic analyses, is represented in Fig. 4. The highest percentages of N2O fluxes derived from the
syn-thetic fertilizer were observed 1 day after fertilization, rang-ing from 34 % (V) to 67 % (B). On average, almost 50 % of N2O emissions in the first sampling event after N synthetic
fertilization came from other sources (i.e., soil endogenous N, including N mineralized from the CCs). The mean per-centage of N2O losses from synthetic fertilizer throughout
all sampling dates was 2.5 times higher in B compared to V (P < 0.05) and was positively correlated with DOC concen-trations (P< 0.05,n=12,r=0.71). There were no
signifi-cant differences between V and F (P> 0.05).
4 Discussion
4.1 Role of CCs in N2O emissions: Period I
Cover crop treatments (V and B) increased N2O losses
com-pared to F, especially in the case of V (Table 1). These results are consistent with the meta-analysis of Basche et al. (2014), which showed that, overall, CCs increase N2O fluxes
(com-pared to bare fallow), with highly significant increments in the case of legumes and a lower effect in the case of non-legume CCs. In the same experimental area, Sanz-Cobena et al. (2014) found that V was the only CC significantly affecting N2O emissions. The greatest differences between
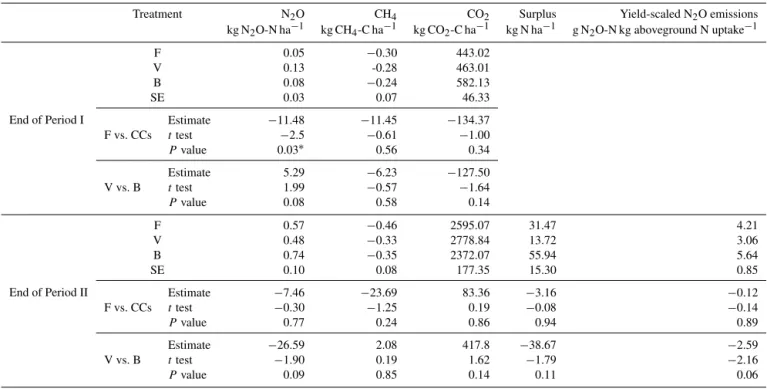
Table 1.Total cumulative N2O-N, CH4-C and CO2-C fluxes; N surplus; and yield-scaled N2O emissions in the three CC treatments (fallow,
F; vetch, V; and barley, B) at the end of both cropping periods.P values were calculated with Student’sttest and df=9.
Treatment N2O CH4 CO2 Surplus Yield-scaled N2O emissions
kg N2O-N ha−1 kg CH4-C ha−1 kg CO2-C ha−1 kg N ha−1 g N2O-N kg aboveground N uptake−1
End of Period I
F 0.05 −0.30 443.02
V 0.13 -0.28 463.01
B 0.08 −0.24 582.13
SE 0.03 0.07 46.33
F vs. CCs
Estimate −11.48 −11.45 −134.37
ttest −2.5 −0.61 −1.00
Pvalue 0.03∗ 0.56 0.34
V vs. B
Estimate 5.29 −6.23 −127.50
ttest 1.99 −0.57 −1.64
Pvalue 0.08 0.58 0.14
End of Period II
F 0.57 −0.46 2595.07 31.47 4.21
V 0.48 −0.33 2778.84 13.72 3.06
B 0.74 −0.35 2372.07 55.94 5.64
SE 0.10 0.08 177.35 15.30 0.85
F vs. CCs
Estimate −7.46 −23.69 83.36 −3.16 −0.12
ttest −0.30 −1.25 0.19 −0.08 −0.14
Pvalue 0.77 0.24 0.86 0.94 0.89
V vs. B
Estimate −26.59 2.08 417.8 −38.67 −2.59
ttest −1.90 0.19 1.62 −1.79 −2.16
Pvalue 0.09 0.85 0.14 0.11 0.06
∗and SE denote significant atP< 0.05 and the standard error of the mean, respectively.
N2O emissions (Fig. 1a, b) (Firestone and Davidson, 1989).
Average topsoil NO−3 was significantly higher in V (Fig. 2b), which was the treatment that led to the highest N2O
emis-sions. Legumes such as V are capable of biologically fixing atmospheric N2, thereby increasing soil NO−3 content with
the potential to be denitrified. Furthermore, the mineraliza-tion of the most recalcitrant fracmineraliza-tion of the previous V residue (which supplies nearly 4 times more N than the B residue, as indicated in Sect. 3.1.2) together with high C-content sun-flower residue could also explain higher NO−3 contents in V plots (Frimpong et al., 2011) and higher N2O losses from
denitrification (Baggs et al., 2000). After the CC kill date, N release from decomposition of roots and nodules and faster mineralization of V residue compared to that of B (shown by NO−3 in soil in Fig. 2c) are the most plausible explana-tions for the N2O increases at the end of the intercrop period
(Fig. 3a) (Rochette and Janzen, 2005; Wichern et al., 2008). Some studies (e.g., Justes et al., 1999; Nemecek et al., 2008) have pointed out that N2O losses can be reduced with
the use of CCs, due to the extraction of plant-available N un-used by previous cash crop. However, in our study lower N2O
emissions were measured from F plots without CCs during the intercrop period. This may be a consequence of higher NO−3 leaching in F plots (Gabriel et al., 2012; Quemada et al., 2013), limiting the availability of the substrate for denitrifi-cation. Frequent rainfall during the intercrop period (Fig. 1a) and the absence of N uptake by CCs may have led to N losses
through leaching, resulting in low concentrations of soil min-eral N in F plots.
Nitrous oxide emissions were low during this period but in the range of those reported by Sanz-Cobena et al. (2014) in the same experimental area. Total emissions during Period I represented 8, 10 and 21 % of total cumulative emissions in F, B and V, respectively (Table 1). The absence of N fertilizer application to the soil combined with the low soil tempera-tures during winter – which were far from the optimum val-ues for nitrification and denitrification (25–30◦C) processes
(Ussiri and Lal, 2013) – may have caused these low N2O
fluxes. The significant positive correlation between soil tem-perature and N2O fluxes during this period highlights the key
role of this parameter as a driver of soil emissions (Schindl-bacher et al., 2004; García-Marco et al., 2014).
4.2 Role of CCs in N2O emissions: Period II
Isotopic analysis during Period II, in which ISFM was carried out, showed that a significant proportion of N2O emissions
came from endogenous soil N or the mineralization of crop residues, especially after the first few days following N fer-tilization (Fig. 4). In this sense, even though an interaction between crop residue and N fertilizer application has been previously described (e.g., in Abalos et al., 2013), the similar proportion of N2O losses coming from fertilizer in B and F
-0,2 -0,1 0,0 0,1 0,2 0,3 0,4
0 20 40 60 80 100 120 140 160 180 200 220 240
mg
N
2
O
-N m
-2 d
-1
Days after CC sowing
F V B
(a)
0 1 2 3 4 5 6 7 8
-10 10 30 50 70 90 110 130
mg
N
2
O
-N m
-2 d
-1
Days after N fertilization
F V B
(b)
Figure 3.N2O emissions for the three CC treatments (fallow, F;
vetch, V; and barley, B) during Period I(a)and II(b). The black arrows indicate the time of spraying glyphosate over the CCs. The dotted arrows indicate the time of maize sowing. Vertical lines indi-cate standard errors.
the N2O bursts after the first irrigation events, with respect to
the N released from CC residues.
As we hypothesized, the different CCs played a key role in the N2O emissions during Period II. Barley plots had
higher N2O emissions than fallow or V-residue plots (at the
10 % significance level; Table 1). Further, a higher propor-tion of N2O emissions was derived from the fertilizer in
B-residue than in V-B-residue plots (Fig. 4). These results are in agreement with those of Baggs et al. (2003), who reported a higher percentage of N2O derived from the15N-labeled
fer-tilizer using a cereal (ryegrass) as surface mulching instead of a legume (bean), in a field trial with zero-tillage man-agement. The differences between B and V in terms of cu-mulative N2O emissions and in the relative contribution of
each source to these emissions (fertilizer- or soil-N) could be explained by: (i) the higher C : N residue of B (20.7±0.7 while that of V was 11.1±0.1, according to Alonso-Ayuso et al., 2014) may have provided an energy source for deni-trification (Sarkodie-Addo et al., 2003), favoring the reduc-tion of the NO−3 supplied by the synthetic fertilizer and en-hancing N2O emissions, as supported by the positive
corre-lation of DOC with the proportion of N2O coming from the
synthetic fertilizer; (ii) NO−3 concentrations, which tended to be higher in B during the maize cropping phase, could have led to incomplete denitrification and larger N2O/N2 ratios
(Yamulki and Jarvis, 2002); (iii) the easily mineralizable V
0 10 20 30 40 50 60 70 80 90 100
1 4 9 11 15 18 22 25 Average
% N
2
O
f
ro
m
N
f
ert
il
izer
Days after N fertilization
F V B
F vs CCs: NS V vs. B: * (P=0.04)
Figure 4.Proportion of N2O losses (%) that come from N
syn-thetic fertilizer during Period II, for the three CC treatments (fallow, F; vetch, V; and barley, B). Vertical lines indicate standard errors. “NS” and∗denote not significant and significant atP< 0.05, re-spectively.
residue (with low C : N ratio) provided an additional N source for soil microorganisms, thus decreasing the relative amount of N2O derived from the synthetic fertilizer (Baggs et al.,
2000; Shan and Yan, 2013); and (iv) V plots were fertilized with a lower amount of immediately available N (i.e., ammo-nium nitrate) than B plots, which could have resulted in bet-ter synchronization between N release and crop needs (Ussiri and Lal, 2013) in V plots. Supporting these findings, Bayer et al. (2015) recently concluded that partially supplying the maize N requirements with winter legume cover crops can be considered a N2O mitigation strategy in subtropical
agro-ecosystems.
The mineralization of B residues resulted in higher DOC contents for these plots compared to the F or V plots (P< 0.001). This was observed in both Period I (as a con-sequence of soil C changes after the 8-year cover-cropping management) and Period II (due to the CC decomposition). Although in the present study the correlation between DOC and N2O emissions was not significant, positive correlations
have been previously found in other low-C Mediterranean soils (e.g., Vallejo et al., 2006; López-Fernández et al., 2007). Some authors have suggested that residues with a high C : N ratio can induce microbial N immobilization (Frimpong and Baggs, 2010; Dendooven et al., 2012). In our experiment, a N2O peak was observed in B plots 20–25 days after
fertil-ization (Fig. 3b) after a remarkable increase of NO−3 content (Fig. 2d), which may be a result of a remineralization of pre-viously immobilized N in these plots.
The positive correlation of N2O fluxes and soil NO−3
con-tent and WFPS during the whole cycle further supports the importance of denitrification process for explaining N2O
losses in this agro-ecosystem (Davidson et al., 1991; García-Marco et al., 2014). However, the strong positive correla-tion of N2O with NH+4 indicated that nitrification was also
a major process leading to N2O fluxes, and showed that
irri-gated maize crop in a semiarid region can lead to favorable WFPS conditions for both nitrification and denitrification processes (Fig. 1c) (Bateman and Baggs, 2005). Emission factors ranged from 0.2 to 0.6 % of the synthetic N applied, which were lower than the IPCC default value of 1 %. As explained above, ecological conditions during the intercrop period (rainfall and temperature) and maize phase (tempera-ture) could be considered normal (based on the 30-year aver-age) in Mediterranean areas. Aguilera et al. (2013) obtained a higher emission factor for high (1.01 %) and low (0.66 %) water-irrigation conditions in a meta-analysis of Mediter-ranean cropping systems. We hypothesized that management practices may have contributed to these low emissions, but other inherent factors such as soil pH should also be con-sidered. Indeed, a higher N2O/N2ratio has been associated
with acidic soils, so lower N2O emissions from
denitrifica-tion could be expected in alkaline soils (Mørkved et al., 2007; Baggs et al., 2010).
4.3 Methane and CO2emissions
As is generally found in non-flooded arable soils, all treat-ments were net CH4sinks (Snyder et al., 2009). No
signif-icant differences were observed between treatments in any of the two periods (Table 1), which is similar to the pat-tern observed by Sanz-Cobena et al. (2014). Some authors (Dunfield and Knowles, 1995; Tate, 2015) have suggested an inhibitory effect of soil NH+4 on CH4uptake. Low NH+4
contents during almost all of the CC and maize cycle may explain the apparent lack of this inhibitory effect (Banger et al., 2012). However, during the dates when the highest NH+4 contents were reached in V and B (225 days after CC sowing) (Fig. 3a), CH4 emissions were significantly higher
for these plots (0.12 and 0.16 mg CH4-C m−2d−1for V and
B, respectively) than for F (−0.01 mg CH4-C m−2d−1)(data not shown). Similarly, the NH+4 peak observed 2 days af-ter fertilization (Fig. 3b) decreased in the order V > F > B, the same trend as CH4 emissions (which were 0.03,−0.04
and−0.63 mg CH4-C m−2d−1in V, F and B, respectively;
data not shown). Contrary to Sanz-Cobena et al. (2014), the presence of CCs did not increase CO2fluxes (Table 1)
dur-ing the whole of Period I (which was longer than the period considered by these authors), even though higher fluxes were associated with B (but not V) with respect to F plots in the last phase of the intercrop. This was probably as a conse-quence of higher root biomass and plant respiration rates in the cereal (B) than in the legume (V). Differences from fall to early winter were not significant, since low soil tempera-tures limited respiration activity. The decomposition of CC residues and the growth of the maize rooting system resulted in an increase in CO2 fluxes during Period II (Oorts et al.,
2007; Chirinda et al., 2010), although differences between treatments were not observed.
4.4 Yield-scaled emissions, N surplus and general assessment
Yield-scaled N2O emissions ranged from 1.74 to 7.15 g N2
O-N kg aboveground O-N uptake−1, which is about 1–4 times lower than those reported in the meta-analysis of van Groeni-gen et al. (2010) for a fertilizer N application rate of 150– 200 kg ha−1. Mean N surpluses of V and F (Table 1) were in the range (0–50 kg N ha−1)recommended by van Groenigen et al. (2010), while the mean N surplus in B (55 kg N ha−1)
was also close to optimal. In spite of higher N2O emissions
in V during Period I (which accounted for a low proportion of total cumulative N2O losses during the experiment), these
plots did not emit greater amounts of N2O per kg of N taken
up by the maize plants, and even tended to decrease yield-scaled N2O emissions and N surplus (Table 1).
Adjusting fertilizer N rate to soil endogenous N led to lower N2O fluxes than previous experiments where
con-ventional N rates were applied (e.g., Adviento-Borbe et al., 2007; Hoben et al., 2011; Sanz-Cobena et al., 2012; Li et al., 2015), in agreement with the study by Migliorati et al. (2014). Moreover, CO2 equivalent emissions associated
with manufacturing and transport of N synthetic fertilizers (Lal, 2004) can be reduced when low synthetic N input strate-gies, such as ISMF, are employed. Our results highlight the critical importance of the cash crop period on total N2O
emissions and demonstrate that the use of nonlegume and – particularly – legume CCs combined with ISFM may provide an optimum balance between GHG emissions from crop pro-duction and agronomic efficiency (i.e., lowering synthetic N requirements for a subsequent cash crop, and leading to sim-ilar yield-scaled N2O emissions as fallow).
The use of CCs has environmental implications beyond ef-fects on direct soil N2O emissions. For instance, CCs can
mitigate indirect N2O losses (from NO−3 leaching). In the
study by Gabriel et al. (2012), conducted in the same ex-perimental area, NO−3 leaching was reduced (on average) by 30 and 59 % in V and B, respectively. Considering an emission factor of 0.075 from N leached (De Klein et al., 2006), indirect N2O losses from leaching could be mitigated
by 0.23±0.16 and 0.45±0.17 kg N ha−1yr−1 if V and B
are used as CCs, respectively. Furthermore, the recent meta-analysis of Poeplau and Don (2015) revealed a C seques-tration potential of 0.32±0.08 Mg C ha−1yr−1 with the
in-troduction of CCs. These environmental factors, together with CO2emissions associated with CC sowing and killing,
5 Conclusions
Our study confirmed that the presence of CCs (particularly V) during the intercrop period increased N2O losses, but the
contribution of this phase to cumulative N2O emissions,
con-sidering the whole cropping cycle (intercrop–cash crop), was low (8–21 %). The high influence of the maize crop period over total N2O losses was due to not only N synthetic
fer-tilization, but also CC residue mineralization and especially endogenous soil N. The type of CC residue determined the N synthetic rate in an ISFM system and affected the per-centage of N2O losses coming from N fertilizer/soil N, as
well as the pattern of N2O losses during the maize phase
(through changes in soil NH+4, NO−3 and DOC concentra-tions). By employing ISFM, similar N2O emissions were
measured from CCs and F treatments at the end of the whole cropping period, resulting in low yield-scaled N2O emissions
(3–6 g N2O-N kg aboveground N uptake−1)and N surplus
(31 to 56 kg N ha−1). Replacing winter F with CCs did not significantly affect CH4 uptake or respiration rates, during
either intercrop or maize cropping periods. Our results high-light the critical importance of the cash crop period on total N2O emissions, and demonstrate that the use of nonlegume
and – particularly – legume CCs combined with ISFM could be considered an efficient practice from both environmental and agronomic points of view, leading to similar N2O losses
per kilogram of aboveground N uptake to bare fallow.
6 Data availability
Our row data will be accessible through the repository of the Technical University of Madrid (UPM) http://oa.upm.es/ contact/.
Acknowledgements. The authors are grateful to the Spanish Min-istry of Economy and Innovation and the Community of Madrid for their economic support through projects AGL2012-37815-C05-01-AGR and the Agrisost-CM project (S2013/ABI- 2717). We also thank the technicians and researchers at the Department of Chemistry and Agricultural Analysis of the Agronomy Faculty (Technical University of Madrid, UPM). Rothamsted Research is grant funded by the Biotechnology and Biological Sciences Research Council (BBSRC), UK.
Edited by: E. Veldkamp
Reviewed by: two anonymous referees
References
Abalos, D., Sanz-Cobena, A., Garcia-Torres, L., van Groenigen, J. W., and Vallejo, A.: Role of maize stover incorporation on ni-trogen oxide emissions in a non-irrigated Mediterranean barley field, Plant Soil, 364, 357–371, 2013.
Abalos, D., Deyn, G. B., Kuyper, T. W., and van Groenigen, J. W.: Plant species identity surpasses species richness as a key driver of N2O emissions from grassland, Glob. Change Biol., 20, 265– 275, 2014.
Adviento-Borbe, M. A. A., Haddix, M. L., Binder, D. L., Walters, D. T., and Dobermann, A.: Soil greenhouse gas fluxes and global warming potential in four high-yielding maize systems, Glob. Change Biol., 13, 1972–1988, 2007.
Aguilera, E., Lassaletta, L., Sanz-Cobena, A., Garnier, J., and Vallejo, A.: The potential of organic fertilizers and water man-agement to reduce N2O emissions in Mediterranean climate
cropping systems. A review, Agr. Ecosyst. Environ., 164, 32–52, 2013.
Allen, R. G., Raes, L. S., and Smith, D. M.: Crop evapotranspira-tion, Guidelines for computing crop water requirements, Irriga-tion and Drainage, Paper 56, Rome, Italy, FAO, 1998.
Alonso-Ayuso, M., Gabriel, J. L., and Quemada, M.: The kill date as a management tool for cover cropping success, Plos One, 9, e109587, doi:10.1371/journal.pone.0109587, 2014.
Arah, J. R. M.: Apportioning nitrous oxide fluxes between nitrifica-tion and denitrificanitrifica-tion using gas-phase mass spectrometry, Soil Biol. Biochem., 29, 1295–1299, 1997.
Baggs, E. M., Rees, R. M., Smith, K. A., and Vinten, A. J. A.: Nitrous oxide emission from soils after incorporating crop residues, Soil Use Manage., 16, 82–87, 2000.
Baggs, E. M., Stevenson, M., Pihlatie, M., Regar, A., Cook, H., and Cadisch, G.: Nitrous oxide emissions following application of residues and fertiliser under zero and conventional tillage, Plant Soil, 254, 361–370, 2003.
Baggs, E. M., Smales, C. L., and Bateman, E. J.: Changing pH shifts the microbial sourceas well as the magnitude of N2O emission
from soil, Biol. Fert. Soils, 46, 793–805, 2010.
Banger, K., Tian, H., and Lu, C.: Do nitrogen fertilizers stimulate or inhibit methane emissions from rice fields?, Glob. Change Biol., 18, 3259–3267, 2012.
Baral, K. R., Arthur, E., Olesen, J. E., and Petersen, S. O.: Predicting nitrous oxide emissions from manure properties and soil mois-ture: An incubation experiment, Soil Biol. Biochem., 97, 112– 120, 2016.
Basche, A. D., Miguez, F. E., Kaspar, T. C., and Castellano, M. J.: Do cover crops increase or decrease nitrous oxide emissions? A meta-analysis, J. Soil Water Conserv., 69, 471–482, 2014. Bateman, E. J. and Baggs, E.M.: Contributions of nitrification and
denitrification to N2O emissions from soils at different
water-filled pore space, Biol. Fert. Soils, 41, 379–388, 2005.
Bayer, C., Gomes, J., Zanatta, J. A., Vieira, F. C. B., de Cássia Pic-colo, M., Dieckow, J., and Six, J.: Soil nitrous oxide emissions as affected by long-term tillage, cropping systems and nitrogen fer-tilization in Southern Brazil, Soil Till. Res., 146, 213–222, 2015. Bergström, L. F. and Jokela, W. E.: Ryegrass Cover Crop Ef-fects on Nitrate Leaching in Spring Barley Fertilized with (15)NH4(15)NO3, J. Environ. Qual., 30, 1659–1667, 2001. Chang, E. T. and Delzell, E.: Systematic review and meta-analysis
of glyphosate exposure and risk of lymphohematopoietic can-cers, J. Environ. Sci. Heal. B, 51, 402–434, 2016.
Danielson, R. E. and Sutherland, P. L.: Porosity, in: Methods of Soil Analysis. Part I. Physical and Mineralogical Methods, edited by: Klute, A., Agronomy Monograph 9, American Society of Agron-omy, Soil Science Society of America, Madison, WI, 443–461, 1986.
Davidson, E. A.: Fluxes of nitrous oxide and nitric acid from ter-restrial ecosystem, in: Microbial production and consumption of greenhouse gases: Methane, Nitrous oxide and Halomethane, edited by: Rogers, J. E. and Whitman, W. B., American Society of Microbiology, Washington, 219–236, 1991.
Davidson, E. A. and Kanter, D.: Inventories and scenarios of nitrous oxide emissions, Environ. Res. Lett., 9, 105012, doi:10.1088/1748-9326/9/10/105012, 2014.
De Klein, C., Novoa, R. S. A., Ogle, S., Smith, K. A., Rochette, P., Wirth, T. C., Mc Conket, B. G., Walsh, M., Mosier, A., Ryp-dal, K., and Williams, S. A.: IPCC guidelines for national green-house gas inventories, Volume 4, Chapter 11: N2O emissions from managed soils, and CO2 emissions from lime and urea
application, Technical Report 4-88788-032-4, Intergovernmental Panel on Climate Change, 2006.
Dendooven, L., Patino-Zúniga, L., Verhulst, N., Luna-Guido, M., Marsch, R., and Govaerts, B.: Global warming potential of agri-cultural systems with contrasting tillage and residue management in the central highlands of Mexico, Agr. Ecosyst. Environ., 152, 50–58, 2012.
Dunfield, P. and Knowles, R.: Kinetics of inhibition of methane ox-idation by nitrate, nitrite, and ammonium in a humisol, Appl. Environ. Microb., 61, 3129–3135, 1995.
Feyereisen, G. W., Wilson, B. N., Sands, G. R., Strock, J. S., and Porter, P. M.: Potential for a rye cover crop to reduce nitrate loss in southwestern Minnesota, Agron. J., 98, 1416–1426, 2006. Firestone, M. K. and Davidson, E. A.: Microbiological basis of NO
and N2O production and consumption in soil, in: Exchange of Trace Gases between Terrestrial Ecosystems and the Atmosphere Chichester, edited by: Andeae, M. O. and Schimel, D. S., Wiley, 7–21, 1989.
Frimpong, K. A. and Baggs, E. M.: Do combined applications of crop residues and inorganic fertilizer lower emission of N2O
from soil?, Soil Use Manage., 26, 412–424, 2010.
Frimpong, K. A., Yawson, D. O., Baggs, E. M., and Agyarko, K.: Does incorporation of cowpea-maize residue mixes influence ni-trous oxide emission and mineral nitrogen release in a tropical luvisol?, Nutr. Cycl. Agroecosys., 91, 281–292, 2011.
Gabriel, J. L. and Quemada, M.: Replacing bare fallow with cover crops in a maize cropping system: yield, N uptake and fertiliser fate, Eur. J. Agron., 34, 133–143, 2011.
Gabriel, J. L., Muñoz-Carpena, R., and Quemada, M.: The role of cover crops in irrigated systems: Water balance, nitrate leach-ing and soil mineral nitrogen accumulation, Agr. Ecosyst. Envi-ron., 155, 50–61, 2012.
Gabriel, J. L., Alonso-Ayuso, M., García-González, I., Hontoria, C., and Quemada, M.: Nitrogen use efficiency and fertiliser fate in a long-term experiment with winter cover crops, Eur. J. Agron., 79, 14–22, 2016.
Gao, J., Xie, Y., Jin, H., Liu, Y., Bai, X., Ma, D., Zhu, Y., Wang, C., and Guo, T.: Nitrous Oxide Emission and Denitrifier Abun-dance in Two Agricultural Soils Amended with Crop Residues and Urea in the North China Plain, Plos One, 11, e0154773, doi:10.1371/journal.pone.0154773, 2016.
García-Marco, S., Ravella, S. R., Chadwick, D., Vallejo, A., Gre-gory, A. S., and Cárdenas, L. M.: Ranking factors affecting emis-sions of GHG from incubated agricultural soils, Eur. J. Soil Sci., 65, 573–583, 2014.
Grossman, R. B. and Reinsch, T. G.: 2.1 Bulk density and linear extensibility. Methods of Soil Analysis. Part 4: Physical Meth-ods, Soil Science Society of America, Madison, USA, 201–228, 2002.
Hoben, J. P., Gehl, R. J., Millar, N., Grace, P. R., and Robertson, G. P.: Nonlinear nitrous oxide (N2O) response to nitrogen fertilizer in on-farm corn crops of the US Midwest, Glob. Change Biol., 17, 1140–1152, 2011.
IPCC: Climate change 2007. The Physical Science Basis. Contri-bution of Working Group I to the Fourth Assessment Report of the Intergovernmental Panel on Climate Change, edited by: Solomon, S., Qin, D., Manning, M., Chen, Z., Marquis, M., Av-eryt, K. B., Tignor, M., and Miller, H. L., Cambridge University Press, p. 996, 2007.
Justes, E., Mary, B., and Nicolardot, B.: Comparing the effective-ness of radish cover crop, oilseed rape volunteers and oilseed rape residues incorporation for reducing nitrate leaching, Nutr. Cycl. Agroecosys., 55, 207–220, 1999.
Kallenbach, C. M., Rolston, D. E., and Horwath, W. R.: Cover crop-ping affects soil N2O and CO2 emissions differently
depend-ing on type of irrigation, Agr. Ecosyst. Environ., 137, 251–260, 2010.
Kimani, S. K., Nandwa, S. M., Mugendi, D. N., Obanyi, S. N., Ojiem, J., Murwira, Herbert K., and Bationo, A.: Principles of integrated soil fertility management, in: Soil fertility manage-ment in Africa: A regional perspective, edited by: Gichuri, M. P., Bationo, A., Bekunda, M. A., Goma, H. C., Mafongoya, P. L., Mugendi, D. N., Murwuira, H. K., Nandwa, S. M., Nyathi, P., and Swift, M. J., Academy Science Publishers (ASP), Cen-tro Internacional de Agricultura Tropical (CIAT), Tropical Soil Biology and Fertility (TSBF), Nairobi, KE, 51–72, 2003. Lal, R.: Carbon emission from farm operations, Environ. Int. 30,
981–990, 2004.
Laughlin, R. J., Stevens, R. J., and Zhuo, S.: Determining nitrogen-15 in ammonium by producing nitrous oxide, Soil Sci. Soc. Am. J., 61, 462–465, 1997.
Li, N., Ning, T., Cui, Z., Tian, S., Li, Z., and Lal, R.: N2O emissions
and yield in maize field fertilized with polymer-coated urea under subsoiling or rotary tillage, Nutr. Cycl. Agroecosys., 102, 397– 410, 2015.
Li, X., Sørensen, P., Olesen, J. E., and Petersen, S. O.: Evidence for denitrification as main source of N2O emission from
residue-amended soil, Soil Biol. Biochem., 92, 153–160, 2016. López-Fernández, S., Diez, J. A., Hernaiz, P., Arce, A.,
García-Torres, L., and Vallejo, A.: Effects of fertiliser type and the pres-ence or abspres-ence of plants on nitrous oxide emissions from irri-gated soils, Nutr. Cycl. Agroecosys., 78, 279–289, 2007. MacKenzie, A. F., Fan, M. X., and Cadrin, F.: Nitrous oxide
emis-sion in three years as affected by tillage, corn-soybean-alfalfa ro-tations, and nitrogen fertilization, J. Environ. Qual., 27, 698–703, 1998.
Meijide, A., Cárdenas, L. M., Sánchez-Martín, L., and Vallejo, A.: Carbon dioxide and methane fluxes from a barley field amended with organic fertilizers under Mediterranean climatic conditions, Plant Soil, 328, 353–367, 2010.
Migliorati, M. D. A., Scheer, C., Grace, P. R., Rowlings, D. W., Bell, M., and McGree, J.: Influence of different nitrogen rates and DMPP nitrification inhibitor on annual N2O emissions from
a subtropical wheat–maize cropping system, Agr. Ecosyst. Envi-ron., 186, 33–43, 2014.
Mørkved, P. T., Dörsch, P., and Bakken, L. R.: The N2O product ratio of nitrification and its dependence on long-term changes in soil pH, Soil Biol. Biochem., 39, 2048–2057, 2007.
Nemecek, T., von Richthofen, J. S., Dubois, G., Casta, P., Charles, R., and Pahl, H.: Environmental impacts of introducing grain legumes into European crop rotations, Eur. J. Agron., 28, 380– 393, 2008.
Oorts, K., Merckx, R., Gréhan, E., Labreuche, J., and Nicolardot, B.: Determinants of annual fluxes of CO2and N2O in long-term
no-tillage and conventional tillage systems in northern France, Soil Till. Res., 95, 133–148, 2007.
Poeplau, C. and Don, A.: Carbon sequestration in agricultural soils via cultivation of cover crops – A meta-analysis, Agr. Ecosyst. Environ., 200, 33–41, 2015.
Quemada, M., Baranski, M., Nobel-de Lange, M. N. J., Vallejo, A., and Cooper, J. M.: Meta-analysis of strategies to control nitrate leaching in irrigated agricultural systems and their effects on crop yield, Agr. Ecosyst. Environ., 174, 1–10, 2013.
Quemada, M., Gabriel, J. L., and Zarco-Tejada, P.: Airborne hyper-spectral images and ground-level optical sensors as assessment tools for maize nitrogen fertilization, Remote Sens., 6, 2940– 2962, 2014.
Reeves, S. and Wang, W.: Optimum sampling time and frequency for measuring N2O emissions from a rain-fed cereal cropping system, Sci. Total Environ., 530, 219–226, 2015.
Rochette, P. and Janzen, H. H.: Towards a revised coefficient for es-timating N2O emissions from legumes, Nutr. Cycl. Agroecosys.,
73, 171–179, 2005.
Sanz-Cobena, A., Sánchez-Martín, L., García-Torres, L., and Vallejo, A.: Gaseous emissions of N2O and NO and NO−3
leach-ing from urea applied with urease and nitrification inhibitors to a maize (Zea mays) crop, Agr. Ecosyst. Environ., 149, 64–73, 2012.
Sanz-Cobena, A., García-Marco, S., Quemada, M., Gabriel, J. L., Almendros, P., and Vallejo, A.: Do cover crops enhance N2O,
CO2or CH4emissions from soil in Mediterranean arable
sys-tems?, Sci. Total Environ., 466, 164–174, 2014.
Sarkodie-Addo, J., Lee, H. C., and Baggs, E. M.: Nitrous oxide emissions after application of inorganic fertilizer and incorpora-tion of green manure residues, Soil Use Manage., 19, 331–339, 2003.
Schindlbacher, A., Zechmeister-Boltenstern, S., and Butterbach-Bahl, K.: Effects of soil moisture and temperature on NO, NO2,
and N2O emissions from European forest soils, J. Geophys.
Res.-Atmos., 109, D17302, doi:10.1029/2004JD004590, 2004. Senbayram, M., Chen, R., Mühling, K. H., and Dittert, K.:
Contri-bution of nitrification and denitrification to nitrous oxide emis-sions from soils after application of biogas waste and other fer-tilizers, Rapid Commun. Mass Sp., 23, 2489–2498, 2009.
Shan, J. and Yan, X.: Effects of crop residue returning on nitrous oxide emissions in agricultural soils, Atmos. Environ., 71, 170– 175, 2013.
Snyder, C. S., Bruulsema, T. W., Jensen, T. L., and Fixen, P. E.: Re-view of greenhouse gas emissions from crop production systems and fertilizer management effects, Agr. Ecosyst. Environ., 133, 247–266, 2009.
Soil Survey Staff: Keys to Soil Taxonomy, 12th Edn., USDA-Natural Resources Conservation Service, Washington DC, USA, 2014.
Spiertz, J. H. J.: Nitrogen, sustainable agriculture and food security. A review, Agron. Sustain. Dev., 30, 43–55, 2010.
Stehfest, E. and Bouwman, L.: N2O and NO emission from
agricul-tural fields and soils under naagricul-tural vegetation: summarizing avail-able measurement data and modeling of global annual emissions, Nutr. Cycl. Agroecosys., 74, 207–228, 2006.
Tate, K. R.: Soil methane oxidation and land-use change–from pro-cess to mitigation, Soil Biol. Biochem., 80, 260–272, 2015. Tonitto, C., David, M. B., and Drinkwater, L. E.: Replacing bare
fallows with cover crops in fertilizer-intensive cropping systems: A meta-analysis of crop yield and N dynamics, Agr. Ecosyst. Environ., 112, 58–72, 2006.
Ussiri, D. and Lal, R.: Soil emission of nitrous oxide and its mitiga-tion, Springer, the Netherlands, 2013.
Vallejo, A., Skiba, U. M., García-Torres, L., Arce, A., López-Fernández, S., and Sánchez-Martín, L.: Nitrogen oxides emis-sion from soils bearing a potato crop as influenced by fertiliza-tion with treated pig slurries and composts, Soil Biol. Biochem., 38, 2782–2793, 2006.
van Groenigen, J. W., Velthof, G. L., Oenema, O., van Groenigen, K. J., and van Kessel, C.: Towards an agronomic assessment of N2O emissions: a case study for arable crops, Eur. J. Soil Sci., 61,
903–913, 2010.
Vanlauwe, B., Kihara, J., Chivenge, P., Pypers, P., Coe, R., and Six, J.: Agronomic use efficiency of N fertilizer in maize-based sys-tems in sub-Saharan Africa within the context of integrated soil fertility management, Plant Soil, 339, 35–50, 2011.
Veenstra, J. J., Horwath, W. R., and Mitchell, J. P.: Tillage and cover cropping effects on aggregate-protected carbon in cotton and tomato, Soil Sci. Soc. Am. J., 71, 362–371, 2007.
Wagner-Riddle, C. and Thurtell, G. W.: Nitrous oxide emissions from agricultural fields during winter and spring thaw as affected by management practices, Nutr. Cycl. Agroecosys., 52, 151–163, 1998.
Wichern, F., Eberhardt, E., Mayer, J., Joergensen, R. G., and Müller, T.: Nitrogen rhizodeposition in agricultural crops: methods, es-timates and future prospects, Soil Biol. Biochem., 40, 30–48, 2008.