www.atmos-meas-tech.net/8/3701/2015/ doi:10.5194/amt-8-3701-2015
© Author(s) 2015. CC Attribution 3.0 License.
Measurement of atomic oxygen in the middle atmosphere using solid
electrolyte sensors and catalytic probes
M. Eberhart1, S. Löhle1, A. Steinbeck2, T. Binder1, and S. Fasoulas1 1Institute of Space Systems, University of Stuttgart, Stuttgart, Germany 2Airbus DS GmbH, Lampoldshausen, Germany
Correspondence to:M. Eberhart ([email protected])
Received: 26 January 2015 – Published in Atmos. Meas. Tech. Discuss.: 24 March 2015 Revised: 25 June 2015 – Accepted: 10 August 2015 – Published: 15 September 2015
Abstract.The middle- and upper-atmospheric energy budget is largely dominated by reactions involving atomic oxygen (O). Modeling of these processes requires detailed knowl-edge about the distribution of this oxygen species. Under-standing the mutual contributions of atomic oxygen and wave motions to the atmospheric heating is the main goal of the rocket project WADIS (WAve propagation and DISsipation in the middle atmosphere). It includes, amongst others, our instruments for the measurement of atomic oxygen that have both been developed with the aim of resolving density varia-tions on small vertical scales along the trajectory. In this pa-per the instrument based on catalytic effects (PHLUX: Pyro-metric Heat Flux Experiment) is introduced briefly. The ex-periment employing solid electrolyte sensors (FIPEX: Flux
φ(Phi) Probe Experiment) is presented in detail. These
sen-sors were laboratory calibrated using a microwave plasma as a source of atomic oxygen in combination with mass spec-trometer reference measurements. The specspec-trometer was in turn calibrated for O with a method based on methane. In order to get insight into the horizontal variability, the rocket payload had instrument decks at both ends. Each housed sev-eral sensor heads measuring during both the up- and downleg of the trajectory. The WADIS project comprises two rocket flights during different geophysical conditions. Results from WADIS-1 are presented, which was successfully launched in June 2013 from the Andøya Space Center, Norway. FIPEX data were sampled at 100 Hz and yield atomic oxygen den-sity profiles with a vertical resolution better than 9 m. This allows density variations to be studied on very small spatial scales. Numerical simulations of the flow field around the rocket were done at several points of the trajectory to assess the influence of aerodynamic effects on the measurement
re-sults. Density profiles peak at 3×1010cm−3 at altitudes of
93.6 and 96 km for the up- and downleg, respectively.
1 Introduction
measument techniques have been flown on sounding rockets to re-trieve profiles of atomic oxygen number densities. A method that is known to be very accurate is the use of cryogenic mass spectrometers where the shock front of the payload is “frozen out”, which minimizes the influence of the aerody-namics (e.g., Offermann et al., 1981). This accuracy comes at the cost of a very high system complexity. Several optical techniques have been used for in situ measurements on rock-ets that probe emission, absorption or fluorescence of atomic oxygen or species that are linked to it by a known reaction chain. Measurement of the so-called airglow is a method with a rather low instrumental complexity which determines the intensity of natural emissions involving O reactions at vari-ous wavelengths (e.g., Offermann and Drescher, 1973). This technique basically requires only photometers and appropri-ate filters. A key factor is the exact knowledge of the rappropri-ate constants associated with the relevant reactions. A method with good sensitivity and selectivity uses resonant fluores-cence of atomic oxygen in the vacuum ultraviolet (VUV) at 130 nm. The emission from a lamp is absorbed by O atoms, and the resonantly scattered photons are collected by a photo-multiplier (e.g., Thomas and Young, 1981). This instrument can be complemented with absorption measurements at the same wavelength (e.g., Gumbel et al., 1998). Improvements on the accuracy could be made by using O2 airglow mea-surements, carried out simultaneously, for calibration of the resonant fluorescence analysis (Hedin et al., 2009). A review of techniques for the determination of atomic oxygen den-sities aboard sounding rockets and satellites can be found in Osborne et al. (2001). In order to quantify the contribution both of dissipating gravity waves and of atomic oxygen to the atmospheric heating, the project WADIS (WAve propaga-tion and DISsipapropaga-tion in the middle atmosphere) has been set up (Gritzner and Rapp, 2011; Gritzner and Strelnikov, 2013). The project is led by the Leibniz Institute of Atmospheric Physics (IAP) under a grant from the German Aerospace Center (DLR). Several institutions provided rocket-borne ex-periments for the direct measurement of small-scale turbu-lences and various neutral and charged particles in combi-nation with ground-based observations using radar and li-dar. The project foresees two launches of sounding rockets in very different geophysical conditions, during winter- and summertime. The Institute of Space Systems (IRS) has con-tributed to this project with the development of two new sen-sor systems designed for the determination of atomic oxy-gen density profiles along the trajectory. The first instrument, called FIPEX (Fluxφ(Phi) Probe Experiment), is based on
solid electrolyte sensors, a technique that has been success-fully flown on a number of rocket missions. On TEXUS 34 (Technologische Experimente unter Schwerelosigkeit, 1996) a modified commercial lambda probe was employed to mea-sure O2 densities (Schrempp, 1996), followed by miniatur-ized sensors on the Russian capsules IRDT (Inflatable Reen-try and Descent Technology, 2000) and IRDT-2 (Fasoulas et al., 2001). The sensors used in these campaigns, however,
2 Solid electrolyte sensor FIPEX
The so-called lambda-probe presents the most prominent ex-ample of a solid electrolyte oxygen sensor. It measures the oxygen concentration in automobile exhaust gases in order to regulate the motor’s air / fuel ratio. This sensor type is based on a ceramic solid electrolyte, often yttria stabilized zirconia (YSZ). Due to the structure of its crystal lattice it is a conductor for oxygen anions, O2−. If a suitable interface
is provided, gas phase oxygen may be built into this lattice. This is accomplished by applying an electronically conduc-tive platinum electrode onto the electrolyte surface. Here a multi-step reaction occurs (e.g., Hertz, 2006, p. 24): gaseous O2is transported to the electrodes by bulk diffusion; it is ad-sorbed dissociatively on the surface; the O atoms are then driven to electrochemically active sites by surface diffusion; here oxygen is reduced in a charge transfer step to O2− by
electrons delivered by the electrode; and the ions are then built into vacant lattice sites of the electrolyte structure. The active sites are essentially found on the so-called triple-phase boundary where electrode, electrolyte and gas phase are in direct contact. As electrons are moved in the charge trans-fer reaction, the electrical potential of the electrode changes until an equilibrium is reached. The steady-state potential de-pends on the gas phase oxygen concentration. The potential difference 18 between two electrodes facing unequal gas
compositions is given by the Nernst equation (e.g., Oldham and Myland, 1994):
18=RT nF ln
c1
c2. (1)
R is the universal gas constant,T the absolute temperature, F Faraday’s constant andnthe number of electrons involved
in the reaction. The oxygen concentrations above two elec-trodes in different environments are given by c1 andc2. If one electrode is exposed to a defined reference atmosphere, then the oxygen concentration on the other side can be de-termined by measuring the steady-state value of18. Such a
sensor works according to the so-called potentiometric prin-ciple.
If an external voltageUS is applied to the electrodes,
su-perposing the Nernst potential, the system is forced out of equilibrium and oxygen ions are driven through the elec-trolyte from cathode to anode. This results in a net flow that is associated with an electrical currentIS measurable at the
electrodes. So-called amperometric sensors make use of this principle and show a wide measurement range over several orders of magnitude of oxygen partial pressure. The net flow of oxygen ions persists if both electrodes are brought to the same environment. Without the requirement of a reference atmosphere these sensors can be designed with a compact planar layout. Commonly a third electrode is employed as a reference and the voltage US regulated such that the
poten-tial difference between cathode and reference is a constant
value. The benefit of this is a linear dependence of the mea-sured sensor current on oxygen pressure over a wide range.
An important factor for the sensor behavior is the electrode material. Besides being a good electronic conductor and be-ing both thermally and chemically stable, it has to promote the dissociative adsorption of molecular oxygen. As stated before, platinum exhibits all these features (Schwandt and Weppner, 1997).
By contrast, O2 is not adsorbed on gold surfaces under high vacuum conditions, except in the case of impurities, e.g., silicon or calcium (Légaré et al., 1980; Pireaux et al., 1984), so that a sensor with gold electrodes responds to molecular oxygen to a much lesser degree. However, gas phase atomic oxygen is adsorbed directly here and may read-ily be incorporated into the described reaction chain. This provides the possibility of designing sensors with a selective response to atomic oxygen by using gold cathodes.
All the reaction mechanisms on the electrodes and in the electrolyte are temperature dependent. In particular the ion conductivity of YSZ rises exponentially with tempera-ture (Park and Blumenthal, 1989) and requires the sensor to be heated to about 500◦C. It should be noted that the
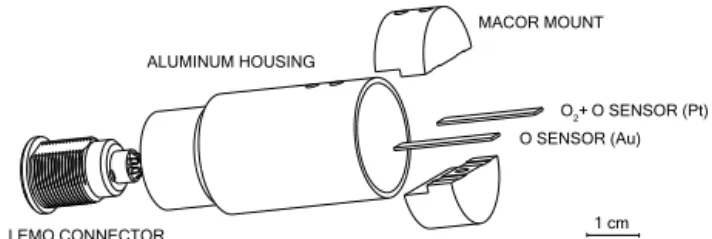
sen-sor currents for both molecular and atomic types are propor-tional to the flux of particles onto their surfaces and therefore respond to the total pressure if exposed to a moving medium. The design of the amperometric sensor elements used in this paper is shown in Fig. 1. A functional YSZ film was screen printed from a paste (Tosoh Corporation, Japan) onto an alumina substrate. Two electrodes with an interdigitated layout and a third reference electrode were screen printed on top of the YSZ layer. A resistance heater was applied to the back side of the alumina plate, again by means of screen printing. Platinum paste (Ferro 64120410, Germany) was used for both the electrodes and the heater; for the elec-trodes the paste was mixed with YSZ powder (Tosoh Cor-poration, Japan), giving a porous layer with an increased triple-phase boundary. Electrodes and the heater were con-tacted with gap-welded Pt-Ni leads. In order to obtain sen-sors selectively sensitive to atomic oxygen, the cathode was subsequently electroplated with gold. This was achieved by placing the sensors in an electrolyte solution (no. 530522, Dr. Ropertz GmbH, Germany), with a voltage of 3.0 V ap-plied between cathode and a stainless-steel counter electrode for 3 min at a current of 10 mA. The electrical circuit used to control and read out the sensors is shown in Fig. 2. A controller stabilizes the potential between cathode and ref-erence to 300 mV by adjusting theUS voltage. The sensor
signal is the currentIS measured between anode and
heat-Figure 1.Layout of a FIPEX sensor. Electrodes are made of
plat-inum; for atomic oxygen sensors the cathode is additionally gold coated.
Figure 2.Electrical circuit of a sensor with three-electrode design
and regulation of the reference voltage.
resistant ceramic elements hold the sensors in place, and the leads are soldered to a LEMO connector.
This ensemble with two different sensors makes up a sen-sor head; to ensure redundancy three of these heads were mounted on both the fore and aft deck of the payload. The sensors were operated by custom designed electronics, one on each deck, connected to the heads by a thoroughly shielded cable. The sampling frequency of the sensor data was 100 Hz. Considering the rocket speed along the trajec-tory, this results in a theoretical vertical resolution better than 9 m during the flight. The photograph given in Fig. 4 shows the final assembly of the instruments on the fore deck of the rocket, with both a FIPEX and PHLUX sensor head visible. Pairs of heads were distributed with a 120◦ spacing on an
Figure 3.FIPEX head with two sensors (O and O+O2) mounted in a common housing.
Figure 4.Payload on the fore deck of the rocket with both a FIPEX
and PHLUX sensor head visible and a sketch showing their arrange-ment. Other instruments in the photo are the particle detectors and the CONE ionization gauge, all from IAP. CONE is covered by an evacuated hood.
adapter ring. The FIPEX sensors were mounted parallel to the rocket axis so that their sensitive electrode surface is ori-ented perpendicular to the main component of the flight ve-locity. This orientation was chosen to minimize the influence of the rocket speed on the measured oxygen flux.
3 Catalytic Probe PHLUX
re-combination coefficientγ. The heat flux can be related to the
incident chemical heat and thus to the atomic oxygen den-sity. To account for varying and unknown heat transfer coef-ficients from the surface to the surroundings, a second inert probe is used. Its heat flux variations reflect all other heat transfer mechanisms, like convection and radiation. In the PHLUX probe head two Pt100 temperature sensors (Heraeus type L220P, sensor area 2×2 mm) with different coatings,
silicon dioxide (SiO2) and platinum, have been placed close to each other. Platinum is a highly catalytic material, while SiO2 is used as an inert reference withγ close to zero. In
order to minimize heat losses to the structure, the Pt100 ele-ments are embedded in an aerogel pad (Airloy from Aerogel Technologies Inc., USA) with extremely low thermal con-duction. To account for heat losses through the sensor lead wires, the temperature of the connector pins is measured by a thermocouple. Figure 5 shows the complete sensor head with a PEEK housing. Similar to FIPEX two heads are mounted on each payload deck for the sake of redundancy. Accord-ing to the original schedule WADIS-1 was planned in winter-time, in dim light or during night. Sunlight became an obsta-cle to the PHLUX measurements as plans had to be shifted to summer conditions. Solar radiative heat exceeds the chemi-cal contributions on both the coated and the uncoated surface. As the absorption coefficients and their dependence on wave-length and temperature are not known exactly, the concept was altered to rule out this source of error. One of the sensor heads was covered with a sapphire window, so that the sur-faces beneath do not receive any chemical heat and the tem-peratures represent the pure solar contributions. These val-ues can be subtracted from the results of the uncovered head, leaving the effect from atomic recombination if convection is assumed to be identical on both heads. This step was omitted on the aft deck as no direct sunlight was expected here. Cus-tom electronics were used to read the temperature of the ther-mocouples and the resistance of the Pt100 elements. Four-wire measurement eliminated uncertainties due to different cable lengths. Sensor data were sampled with a frequency of 1000 Hz.
4 Calibration
As no first-principles model can be employed for the inter-pretation of the sensor readings, a laboratory calibration is necessary. This applies especially to solid electrolyte sen-sors, for both molecular and atomic oxygen, but more gen-erally also to the catalytic probes. Here parameters like the catalytic efficiencies, absorption and emission coefficients or other thermo-physical properties of the sensor design are only known with high uncertainties. In the following the calibration method for the FIPEX sensors is detailed. The PHLUX sensors were calibrated for the incident heat flux density using the NISI (non-integer system identification) method (Löhle et al., 2013, 2007).
Figure 5.Design of the PHLUX sensor head.
A microwave generator (2.45 GHz, Sairem, France) is used to produce a low-pressure oxygen plasma as a source of atomic oxygen, a technique widely employed in various technical and scientific applications and well studied in the literature (Lebedev, 2010). The pure-oxygen plasma is sus-tained within a cylindrical quartz tube at an oxygen pres-sure of 1.0 mbar and an incident microwave power of up to 300 W. The tube has a length of 30 cm with an outer diame-ter of 50 mm and a wall thickness of 2.5 mm and is mounted onto a vacuum chamber. The atomic oxygen generated in the discharge is expanded into the vacuum through a small orifice (∅0.3 mm) along with undissociated molecular
atomic oxygen sensor to be calibrated. After the total flux profile has been determined the manipulator is turned about 180◦, so that the second sensor is exposed to the beam and
its response to the radially varying atomic flux (plasma on) can be recorded. This enables an almost simultaneous oper-ation of the O sensor and the QMS reference system with-out the need of opening the vacuum chamber between mea-surements. Calibration curves for atomic oxygen obtained by this procedure are given in Fig. 6 for the sensors used during WADIS-1. The different slopes of the curves are due to tol-erances in the manufacturing of the sensors. Slight variations in the heater geometry and the position of the electrodes on the substrate, for example, lead to temperature differences that directly affect the sensor signal. Variations in the spac-ing between the electrodes furthermore result in a differspac-ing conductance across the electrolyte.
Calibration for molecular oxygen is done by testing the sensors in a vacuum chamber under stationary conditions. The partial pressure of O2 is varied by a leak valve (Balz-ers UDV 235), and the sensor current is measured against a pressure gauge (Pfeiffer FullRange PKR251). Results for one sensor (C24) with platinum cathodes are plotted exemplar-ily in Fig. 7. Values for the gold-plated atomic oxygen sen-sor C15 are given additionally in this plot. All sensen-sors with gold cathodes showed almost no sensitivity towards molecu-lar oxygen in the relevant pressure range.
5 Aerodynamic considerations
It is important to consider that the measurements conducted on sounding rockets are intrusive because the rocket itself influences the flow field of the medium to be analyzed. The high velocities produce complex patterns of shock and rarefaction waves with regions of very different tempera-tures and densities than in the undisturbed atmosphere. Due to their different masses and thermal velocities the abun-dance of the various species may additionally be altered in the vicinity of the rocket walls (Bird, 1988). All such ef-fects have to be taken into account when making conclu-sions on atmospheric properties from the measurement re-sults. Exceptions are instruments with cryogenically cooled surfaces like the mass spectrometers flown on several mis-sions (Offermann et al., 1981). Here incident particles are trapped on the cold walls and the shock is “frozen out” as no reflections occur. This, however, requires intensive cool-ing with liquid helium to temperatures below 20 K, which dramatically increases the system complexity. Some meth-ods may operate on a boom deployed from the rocket to probe a volume well outside of the shock front (e.g., Hedin et al., 2009). Here aerodynamic simulations are required to reveal the position and extent of the disturbances to appro-priately design the detection system. In order to investigate the aerodynamic effects during the flight, we conducted sim-ulations of the flow field at distinct points of the trajectory.
C02 C17 BX2 C18 B22 C15 IS
/
n
A
0 500 1000 1500 2000 2500
pO / mbar 6×10⁻⁷
7×10⁻⁷
8×10⁻⁷
9×10⁻⁷
10−6
1.1×10⁻⁶
1.2×10⁻⁶
Figure 6. Calibration curves for the atomic oxygen sensors
la-beled C02–C15 flown on WADIS-1. Sensor currents are plotted over atomic oxygen partial pressure. The error bar represents the uncertainty due to the pressure measurement and shifted electron energy in the QMS ionizer.
These computations have to account for the transition of the flow regime from continuum to free molecular flow across the mesopause region, which cannot be treated by classical continuum mechanics. As indicated in Fig. 8, the WADIS payload had an almost vertical orientation throughout the whole experimentation phase, so three-dimensional aerody-namics have to be considered due to the horizontal veloc-ity component. The direct-simulation Monte Carlo method (DSMC) of the PICLas code, developed in collaboration be-tween IRS and the Institute of Aerodynamics and Gas Dy-namics (IAG) (Munz, 2014), was employed to simulate the flow conditions at five points on the downleg part of the tra-jectory. For collisions a pairing scheme including the natural-sample-size method with a nearest-neighbor search and a standard (variable hard sphere, VHS) model was applied in which the energy-dependent collision cross section is derived from viscosity data byµ∝Tω (ω= 0.75 used). The species
Ar, O, N2and O2were considered in the calculation, with a VHS reference temperature of 273 K. For the VHS reference diameters, values of 4.17 Å (Ar), 3.1 Å (O), 4.17 Å (N2) and 4.07 Å (O2) were used.
The internal degrees of freedom of the molecules were taken into account while neglecting chemical reactions. Each particle in the simulation represented between 1.5×10¹¹
and 2×10¹³real particles (macro-particle factor, MPF). The
maxi-C15
IS
/
n
A
(
C
1
5
)
0 100 200 300 400 500
C24 IS
/
n
A
0 5000 104 1.5×10⁴ 2×10⁴
pO2 / mbar
0 5×10⁻⁵ 10−4 1.5×10⁻⁴ 2×10⁻⁴ 2.5×10⁻⁴
Figure 7.Calibration curves for molecular oxygen sensor C24 with
platinum electrodes and for atomic oxygen sensor C15 with gold-plated cathode. Sensor currents are plotted over the O2partial pres-sure. The error bars indicate the uncertainty due to the pressure mea-surement.
Figure 8.Raw signals of the atomic oxygen sensors vs. flight time,
together with the altitude and rocket orientation during the experi-mentation phase.
mal and minimal particle density cases during one revolu-tion of the rocket. On the walls a diffusive reflecrevolu-tion with full accommodation and a temperature of 300 K were as-sumed, whereas specular reflection was set for the plane of symmetry. All other boundaries were open with an inflow from a virtual buffer layer filled with particles of a Maxwell– Boltzmann distribution corresponding to the free-stream con-dition. Steady state, i.e. start of averaging of macroscopic values, such as particle density, was assumed to be reached after 0.02 s. The gas composition at the different altitudes was taken from the standard MSIS-E-90 model and temper-atures from the CONE results, where it is derived by inte-grating the measured neutral air density profile (Rapp et al., 2001). Sensitivity analyses were conducted in terms of vary-ing boundary distances and MPFs. Computvary-ing time for the simulations ranged from 0.5 to 4 h on 96 cores of a CRAY XC40 for altitudes above 85 km and was 10 h on 192 cores
5.9
0.0 1 2 3 4 5
n/n∞
v∞ v∞
85 km 100 km
sensorheads sensorheads
22.9°
18.4°
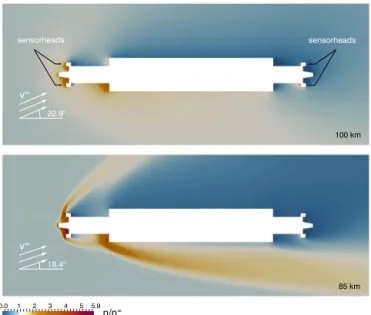
Figure 9.Distribution of the ratio between local and free-stream
number density during the downleg at two different altitudes. Re-sults from 3D DSMC calculations with the PICLas code.
for the 85 km case. Flow field results for 85 and 100 km altitude are given exemplarily in Fig. 9. Here the ratio of the local total number density (n) to the value of the
undis-turbed atmosphere (n∞) is plotted. At 85 km a distinct shock
is formed with pronounced ram and wake regions that are blurred towards higher altitudes. The values ofn/n∞on the
upwind side at the sensor position are given in Fig. 10 as a function of altitude, with one line each representing the ram and wake sensors. Then/n∞values were multiplied to the
measurement results to correct for aerodynamic effects. For computational reasons only the total number densities could be considered for this ratio; in previously published simu-lations, however, the relative abundance of O was shown to vary only slightly (Hedin et al., 2009).
6 Results
Figure 10.Ratios between local and free-stream total number
den-sity at the sensor position as a function of altitude. The ratios are obtained from numerical simulations made at the marked altitudes and are used as aerodynamic correction factors.
6.1 FIPEX – atomic oxygen profiles
An overview of the raw signals obtained from all atomic oxy-gen sensors is given in Fig. 8. The values are plotted vs. the duration of the flight, together with the altitude and signif-icant events. Additionally the orientation of the rocket pay-load with instrument decks on both ends is shown. Due to their alignment the sensors were affected by the horizontal component of the flight velocity. As the rocket was spin-stabilized, this resulted in a signal modulated with a 2.9 Hz component that was removed with a notch filter. One sensor on the lower deck showed unstable oscillations in the signal and was excluded from further analysis, so that in total re-sults from five O sensors could be used. After application of the respective calibration curves, atomic oxygen partial pres-sures were obtained. Number densities were calculated by dividing by k T, werek is Boltzmann’s constant andT the
local absolute temperature measured with high spatial reso-lution by the CONE instrument. Temperature data were not available for altitudes above 110 km. The apogee of the tra-jectory was 115 km.
6.1.1 Fore sensors
Data obtained from the fore sensors before aerodynamic cor-rection are given in Fig. 11. Corrected profiles are plotted in Fig. 14. In the initial phase, after nosecone separation at 53 km altitude, the sensors had to acclimatize to the low-density conditions of the free atmosphere. Gases that have been adsorbed on the electrodes under atmospheric pressure before liftoff desorb from the surface. This process leaves the sensors in unstable condition, and hence they show very dif-ferent results in the beginning. They measured in the rocket ram during ascent and stayed in the wake during descent. The profiles are plotted from an altitude of 80 km upwards, where they converge at 91 km to form a sharp rise in atomic oxygen
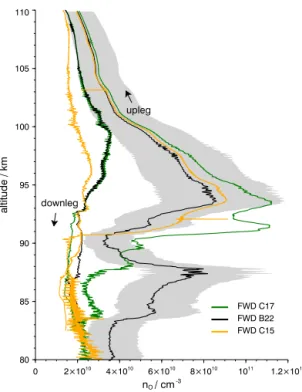
Figure 11.Measurement results for atomic oxygen number density
vs. altitude for sensors on the fore deck during the up- and downleg without aerodynamic correction. The shading shows the uncertainty from the calibration for fore sensor B22.
number density. From that point onwards the curves follow each other qualitatively with a maximum value at 93.6 km altitude. During the downleg variations in the O, density can still be resolved, with two profiles closely matching (C17 and B22), while the third one (C15) differs. The characteristics obtained by the first mentioned sensors are similar to the as-cent results while their magnitude is reduced, with fewer de-tails than during upleg.
6.1.2 Aft sensors
AFT BX2
downleg
upleg
AFT C02
altitude / km
80 85 90 95 100 105 110
nO / cm -3
0 2×10¹⁰ 4×10¹⁰
6×10¹⁰ 8×10¹⁰
1011 1.2×10¹¹
1.4×10¹¹ 1.6×10¹¹
Figure 12.Measurement results for atomic oxygen number density
vs. altitude for sensors on the aft deck during the up- and downleg without aerodynamic correction. The shading shows the uncertainty from the calibration for the aft sensor CO2.
6.2 FIPEX – molecular oxygen
Results for the molecular oxygen number density recorded by sensor C24 (fore deck) during the upleg and downleg af-ter aerodynamic correction with the ram and wake factors, respectively, are plotted exemplarily in Fig. 13. Here the cal-ibration curve given in Fig. 7 was applied to the raw signal after filtering out the spin modulations. This practice neglects the fact that the platinum electrodes also respond to atomic oxygen, although with a different characteristic than to O2 due to differing adsorption kinetics.
The probability of finding suitable neighboring adsorption sites on the surface for both atoms is lower than in the case of a single incident O atom. The complete calibration of a platinum sensor for mixtures of O2and O is therefore more complex than in the case of gold electrodes that do not re-spond to molecular oxygen. For this reason the results can-not be understood as pure O2profiles but represent in some way the sum of atomic and molecular oxygen number densi-ties. An approximate equation describing the total signal of a sensor with platinum electrodes as a sum of the contributions from O and O2is given in Förstner (2003). However, in order to separate the measured currents into their components, de-tailed knowledge of electrode properties such as their surface area, total number of adsorption sites or adsorption probabil-ities of the species is required. The fact that up- and downleg profiles are very close in their absolute values is an indication of realistic numerical modeling of the aerodynamics, result-ing in appropriate correction factors for both ram and wake sensors.
FWD C24 upleg
downleg
a
lt
it
u
d
e
/
k
m
80 85 90 95 100 105 110
nO2 / cm-3
0 1012 2×10¹² 3×10¹² 4×10¹² 5×10¹²
MSIS-E-90
Figure 13.Profile for the O2(+O) number density from fore sensor C24 after aerodynamic correction (ram for upleg, wake for down-leg) compared to MSIS-E-90.
7 Discussion
The FIPEX density profiles after application of the aerody-namic corrections are given in Fig. 14. Additionally, data is compared to the standard MSIS-E-90 model. Though having been measured in different geophysical conditions, profiles obtained during the NLTE-2 campaign – launched at the Es-range Space Center, northern Sweden, on 6 March 1998 – are additionally included for comparison (Hedin et al., 2009). A fair agreement is observed for the altitude of maximum O number densities between the FIPEX results and the MSIS and NLTE-2 data. FIPEX profiles peak at 93.6 and 96 km for the up- and downleg, respectively. The MSIS-E-90 curve shows a peak value at 93.5 km, and the NLTE-2 measure-ments recorded a maximum at 97.5 km altitude. The NLTE-2 results have a much higher spatial resolution (smoothed to 250 m on the vertical axis) than the MSIS profile and feature several distinct local extrema. The absolute peak values for
apogee. The surfaces would heat up due to an evolving bow shock releasing adsorbed particles, e.g., exhaust gases, that consume atomic oxygen in chemical reactions. However, the increase in surface temperature measured by the PHLUX sensors between apogee and 105 km was only about 0.5 K, so that outgassing does not seem to cause an atomic oxy-gen depletion. We favor an interpretation based on the elec-trode kinetics. As laid out before, the reference voltage of the sensor is regulated to a constant value by appropriately adjustingUS, the voltage between anode and cathode. With
increasing oxygen concentration US has to be raised which
leads to a linear characteristic of the sensor current over a wide pressure range. Under steady-state conditions a given oxygen density can be attributed to a certain ratio ofUSand
ISvalues. During the downleg a rise in this ratio along with a
decline in the absoluteUS value can be found in the aft
sen-sor data (see Fig. 15) exactly at the altitude where the dip in O density was observed. Although the gold coated cathode is not sensitive towards molecular oxygen, the platinum ref-erence electrode still dissociatively adsorbs O2. Its reduction to O2−consumes electrons, which increases the potential
dif-ference between redif-ference and cathode. SubsequentlyUS is
lowered by the controller to maintain a constant reference voltage, leading to a decrease inIS. This mechanism is
be-lieved to cause the dip in the signal after the sensors left the rocket wake with a very low O2density beyond apogee. At very low ambient pressures the coverage of the electrode sur-faces with adsorbed oxygen is also low. For two reasons the coverage on the cathode is further reduced compared to the other electrodes: firstly, gold prevents adsorption of molecu-lar oxygen with only very low O concentrations in the rocket wake; secondly, adsorbed O is pumped away by the applied voltageUS. Surface diffusion to the triple-phase boundary is
slowed down at these low coverages so that a steady state is reached only after long periods (Förstner, 2003, p. 106). The described slow kinetics may also explain the delayed onset of the effect some seconds beyond apogee. Further investi-gations into the transient reaction of the sensors at very low pressures have to be carried out; this will also help to im-prove the interpretation of high-frequency variations of the results in that regime.
Generally speaking, the results recorded in the ram, i.e. the fore-upleg and aft-downleg profiles, appear to reflect the actual variations better than their counterparts in the wake. In the ram the measurements are also influenced by aerody-namic effects, but the response to density variations is ob-viously more direct, showing fluctuations on a smaller scale with a better signal-to-noise ratio.
A comparison of the fore and aft results during the down-leg is given in Fig. 16, together with the MSIS-E-90 pro-file, which has been scaled by a factor of 0.5. The curves have been corrected by the aerodynamic factors for ram and wake, respectively. Though different in magnitude, the ob-tained profiles agree widely on a qualitative basis. Small-scale features are represented in all curves, e.g., the short dip
AFT BX2 AFT C02
a
lt
it
u
d
e
/
k
m
80 85 90 95 100 105 110
nO / cm -3
0 1010 2×10¹⁰ 3×10¹⁰ 4×10¹⁰
FWD C15 FWD B22
FWD C17
NLTE2 x 0.08 MSIS x 0.2
Figure 14.Profiles of O number density for FIPEX sensors on fore
and aft deck after aerodynamic ram correction. Downleg profile for aft sensors, upleg part for the fore sensors. Comparison to MSIS model and NLTE-2 measurements.
Figure 15.Ratio of voltage to current for an aft sensor during the
downleg. Raw values including 2.9 Hz modulation due to rocket spin.
C15 C17
altitude / km
80 90 100 110
US / mV
300 400 500
altitude / km
80 85 90 95 100 105 110
nO / cm-3
0 2.5×10¹⁰
5×10¹⁰
7.5×10¹⁰
1011
1.25×10¹¹
C17 B22 C15 BX2
C02
FWD AFT
MSIS x 0.5
Figure 16.Comparison of O number density profiles from sensors
on fore and aft deck during the downleg after aerodynamic correc-tion (ram factors for aft, wake factors for fore). The MSIS profile is scaled by 0.5 and plotted additionally. The inset shows the course of the sensor voltageUS(including 2.9 Hz modulation from rocket
spin) for two fore sensors.
the downleg is given in the inset of Fig. 16. These curves re-flect the large-scale differences obtained in the number den-sities from the single sensors. AUSvoltage control in
combi-nation with electrodes from different materials (golden cath-ode, platinum anode and reference) apparently accentuates deviations between the sensor properties that are due to the mentioned manufacturing tolerances. Variations in the ratios of the surfaces and of the triple-phase boundaries between the golden cathode and the other electrodes can thus lead to a different controlling behavior in a mixed O2/ O atmosphere. While the voltage control is a versatile instrument to maintain stable conditions on the cathode for sensors with electrodes made from identical materials, e.g., all-platinum electrodes for sensing pure O2, it seems to corrupt the measurements in the present case.
Uncertainties, sources of error and recommendations Several possible sources of errors and uncertainties in the cal-ibration procedure as well as during the flight experiment can be identified and are addressed in the following. During cal-ibration the sensors are exposed to atomic oxygen produced in a microwave discharge. The atoms might be accompanied
by other oxygen species influencing the sensor signal, with a focus on ozone (O3) and electronically excited molecular oxygen O∗
2, especially in its long-lived11gstate (so-called singlet oxygen). In both cases it is important to investigate whether the species can contribute to the measured sensor current and if they are actually present in the experiment. In order to answer the first question, the initial step of the electrode reactions, the adsorption on the gold surface, is re-garded. It can be found in the literature that ozone does ad-sorb on gold and hence will be part of the reaction chain forming the sensor signal (Saliba et al., 1998; Kim et al., 2006). For singlet oxygen, relevant literature is very rare; there are practically no publications that examine if O∗
2is, in contrast to ground state O2, adsorbed on gold surfaces or not. A hint is given in the work by Gottfried et al. (2002), where weakly bound physisorbed oxygen is adsorbed by electron bombardement. They discuss that a threshold electron energy of 3.5 eV is required for this process. The excitation energy of O211gis listed, on the other hand, as 0.98 eV (Herzberg, 1950). On that basis it could be speculated that this species does not possess the necessary activation energy for adsorp-tion, although the two underlying processes are different. The abundance of ozone during calibration was checked by recording the QMS signal at mass number 48. Only minute trace amounts of ozone could be found, although the cross section for electron impact ionization of O3in the QMS ion source is higher than for O2(McConkey et al., 2008). Ozone is not produced directly in the discharge but in its afterglow via recombination of atomic oxygen (Normand et al., 1995). In the present setup the afterglow is too short to release sig-nificant amounts of ozone into the vacuum chamber. The de-tection of O∗
2is, however, not straightforward. We employed a method that seeks to identify singlet oxygen in the thresh-old ionization curves obtained by scanning the electron en-ergy in the QMS ionizer (Herron and Schiff, 1958; Pulpytel et al., 2005). Excited molecules are already ionized at lower electron energies and so leave traces in the curves at ener-gies lower than the appearance potential of the ground state molecule. In order to avoid production of excited species from other sources, all ionization gauges were turned off dur-ing the experiments. Curves with scanndur-ing electron energies were recorded for both plasma-on and plasma-off conditions, with the energy scale calibrated against the appearance po-tential of argon. The curves were normalized to their value at 40 eV and averaged over about 100 single scans. In both cases the results were identical and did not confirm the pres-ence of O∗
about 1×10⁸and 3×109cm−3for ozone and O2(11g),
re-spectively (Gumbel et al., 1998). These species could then contribute to the uncertainties in the atomic oxygen measure-ments. It is therefore important to further investigate their ef-fect on the sensor signals.
It was revealed in recent experiments that the electron en-ergy in the QMS ionizer is influenced by the microwave plasma and thus can deviate from its nominal value. More precisely, it is shifted to lower energies when the discharge is turned on. This shift, however, affects the QMS results both for O2and for atomic oxygen. Their ratio is the relevant quantity for the calibration, and with an observed energy de-viation of 1.5 eV the measured atomic oxygen density would be lower by 8 %, based on the literature values for elec-tron impact ionization (Laher and Gilmore, 1990; McConkey et al., 2008). Calibration of the QMS is done by recording its readings at a series of partial pressures of O2and CH4, re-spectively, compared to the output from a cold cathode gauge (Pfeiffer PKR 251) with an accuracy of±30 %. The
correc-tion factor for CH4 of the cold cathode gauge was found with the aid of a precise, gas-type independent capacitance manometer (MKS Baratron 690A, accuracy±0.12 %) in the
pressure range above 10−6mbar. Linearity was assumed
be-low that point.
A shortcoming of the calibration method in its present form is its inability to cover the complete range of atomic oxygen number densities encountered during the flight ex-periment. The sensor currents measured along the trajectory (see Fig. 8) exceed the signals given in the calibration curves (see Fig. 6). Their linear characteristics had to be extrapo-lated by a factor of approximately 3.5. However, at a certain pressure the respective curves will become nonlinear. This is a gradual transition and depends on parameters such as ma-terial, surface, geometry and temperature of the electrodes and the electrolyte. If the flux of oxygen delivered by the electrodes via surface diffusion exceeds the rate at which it can be transported to the anode, the current–pressure curve flattens. For the molecular oxygen sensors this is observed at currents beyond 10 µA (see Fig. 7). The O sensors differ in a thin layer of gold on the cathode, which will only very slightly alter its total surface area or the length of the three phase boundary, so a linear behavior is assumed here up until the levels observed in the flight. Neglecting an actual nonlin-earity in the characteristics, however, would lead to an un-derestimation of the number densities. A major uncertainty during the flight is due to the sensor voltageUS. As laid out
before, the golden cathode is widely inert towards molecular oxygen, but the other electrodes are not. This means that the controller may adjust aUS different to the value during
cal-ibration if the O/O2ratios in both cases differ. Apart from the “dip” in the profiles discussed earlier this also affects the total signal level. In fact, sensor voltages of less than half of the value applied during calibration were observed. There is, however, no direct linear relation betweenUS andIS; this
depends largely on pressure and oxygen coverage of the
elec-trodes. It is therefore hardly possible to recover the true sig-nal based on the knowledge of the trueUS value.
Neverthe-less we estimate that the recorded signals could be lower by 50 % due to this effect. A clue about the total accuracy of the present methods can be obtained by comparing the abso-lute values of the results given in Fig. 16. If the uncertainties from the calibration are taken into account, then the atomic oxygen number densities at the 96 km peak differ by a max-imum factor of about 6.4 between the fore and aft sensors during the downleg. This includes the aerodynamic correc-tion based on the numerical simulacorrec-tions. The results from the fore sensors here suffer from a lower signal-to-noise ra-tio, and the rise in O density below 85 km most likely does not reflect the actual conditions. If the ram and wake factors are assumed to be correct, based on the consistent results of the O2sensor in Fig. 13, then the high signals in the ram ob-viously underestimate the true number density. As discussed before, this would be the case for an actual nonlinearity in the calibration curves. A further indication of such nonlinear characteristics can be found regarding the magnitude of the rise in O concentration between 80 km altitude and the peak values at about 95 km. The results at the lower end of the profiles coincide well with the values measured in the NLTE campaign. A more appropriate comparison is the NLC-93 campaign, launched in geophysical conditions similar to the WADIS-1 flight (July–August, nighttime but sunlight at a high latitude), which also shows corresponding results for the low altitudes (Gumbel et al., 1998). The values at 80 km are given as 3.2×109cm−3(NLTE) and 2.4×109cm−3
(NLC-93), and the present data read 3.4×109cm−3for the aft
sen-sors during the downleg. However, the rise in O density to the peak value is clearly smaller than in the mentioned ref-erences. A nonlinearity in the sensor characteristics could again be responsible for this underestimation of the high den-sities. The maximum difference in the results between the aft sensors alone is below 15 %, which leads to the conclusion that accurate measurements with the described technique are possible if the discussed sources of error can be ruled out in future experiments.
For upcoming missions the use of sensors with all-golden electrodes should be considered to eliminate the issues gener-ated by different reactions on different electrode materials. A further consequence of the findings described here might be an operation of sensors with a fixedUS, i.e. without
regulat-ing the reference voltage. This helps to maintain the electrical conditions used during laboratory calibrations at the expense of increased nonlinearity of the calibration curve.
8 Conclusions
The FIPEX instrument, based on solid electrolyte sensors, was for the first time used to measure atomic oxygen number densities on a sounding rocket and has successfully recorded profiles along the trajectory of WADIS-1. On a qualitative basis the results compare well with the MSIS standard atmo-sphere and the profiles obtained in the NLTE-2 campaign. Measurements with the PHLUX instrument were compli-cated by solar radiation and require further analysis. The ab-solute values derived from FIPEX data in the ram are by fac-tors of around 5 and 13 lower than the mentioned references. The wake results on the contrary peak at values reduced by factors of 1.8 and 4.6, respectively. This might be due to non-linearities in the sensor characteristics at higher atomic oxy-gen densities that could not be covered in the laboratory cal-ibration. Here further investigations are needed. Controlling of the sensor voltage in combination with electrodes made from different materials was identified as a key source of uncertainties during the flight. For upcoming missions the use of sensors with all golden electrodes should be consid-ered, which may eliminate disturbances through different re-actions of oxygen on platinum and gold electrodes. The mea-surements stand out due to a unprecedented high spatial res-olution, showing O density variations on very small vertical scales. The sensors are small and lightweight and thus enable symmetrical instrumentation on fore and aft deck in order to measure profiles both during the up- and downleg in the same ram or wake conditions. This facilitates the detection of O density variations on a horizontal scale.
Acknowledgements. This work has been funded by the German
Aerospace Center. We thank J. Hedin from MISU, Stockholm, for providing the NLTE data and B. Strelnikov, IAP Kühlungsborn, for the CONE temperature results. We appreciate the work from M. Hartling, IRS electronics lab, who designed the sensor elec-tronics. The efforts of DLR MORABA and the support during the launch campaign are highly recognized. The platinum electrode sensors have been produced by ESCUBE GmbH in collaboration with our institute.
Edited by: D. Heard
References
Agarwal, S., Quax, G., van de Sanden, M. C. M., Maroudas, D., and Aydil, E.: Measurement of absolute radical densities in a plasma using modulated-beam line-of-sight threshold ion-ization mass spectrometry, J. Vac. Sci. Technol. A, 22, 71–81, doi:10.1116/1.1627767, 2004.
Bird, G. A.: Aerodynamic Effects on Atmospheric Composi-tion Measurements from Rocket Vehicles in the Thermo-sphere, Planet. Space Sci., 36, 921–926, doi:10.1016/0032-0633(88)90099-2, 1988.
Fasoulas, S., Förstner, R., and Stöckle, T.: Flight Test of Solid Oxide Micro-Sensors on a Russian Reentry Probe, in: Space 2001 Con-ference & Exhibition, AIAA 2001-4724, doi:10.2514/6.2001-4724, 2001.
Förstner, R.: Entwicklung keramischer Festelektrolytsensoren zur Messung des Restsauerstoffgehalts im Weltraum, PhD thesis, In-stitut für Raumfahrtsysteme, Universität Stuttgart, 160 pp., 2003. Friedrich, M., Torkar, K. M., Hoppe, U.-P., Bekkeng, T.-A., Bar-jatya, A., and Rapp, M.: Multi-instrument comparisons of D-region plasma measurements, Ann. Geophys., 31, 135–144, doi:10.5194/angeo-31-135-2013, 2013.
Gottfried, J., Schmidt, K. J., Schroeder, S. L. M., and Christmann, K.: Spontaneous and electron-induced adsorption of oxygen on Au(110)-(1x2), Surf. Sci., 511, 65–82, doi:10.1016/S0039-6028(02)01555-8, 2002.
Gritzner, C. and Rapp, M.: ECOMA and WADIS, DLR Countdown, 15, 2011.
Gritzner, C. and Strelnikov, B.: Rough Seas in the Middle Atmo-sphere, DLR Countdown, 23, 2013.
Gumbel, J., Murtagh, D. P., Espy, P. J., Witt, G., and Schmidlin, F. J.: Odd oxygen measurements during the Noctilucent Cloud 93 rocket campaign, J. Geophys. Res.-Space, 103, 23399–23414, doi:10.1029/98JA02155, 1998.
Hammer, B., Hansen, L. B., and Norskov, J. K.: Improved adsorp-tion energetics within density-funcadsorp-tional theory using revised Perdew-Burke-Ernzerhof functionals, Phys. Rev. B, 59, 7413– 7421, doi:10.1103/PhysRevB.59.7413, 1999.
Hedin, J., Gumbel, J., Khaplanov, M., Witt, G., and Stegman, J.: Optical studies of noctilucent clouds in the extreme ultravio-let, Ann. Geophys., 26, 1109–1119, doi:10.5194/angeo-26-1109-2008, 2008.
Hedin, J., Gumbel, J., Stegman, J., and Witt, G.: Use of O2airglow for calibrating direct atomic oxygen measurements from sound-ing rockets, Atmos. Meas. Tech., 2, 801–812, doi:10.5194/amt-2-801-2009, 2009.
Herdrich, G., Auweter-Kurtz, M., Fertig, M., Löhle, S., Pidan, S., and Winter, M.: Present Design of the Flight Instrumentations Pyrex, Phlux and Respect for the Capsule Expert, in: Fifth Eu-ropean Symposium on Aerothermodynamics for Space Vehicles, edited by: Danesy, D., vol. 563 of ESA Special Publication, 401– 408, 2005.
Herron, J. T. and Schiff, H. I.: A Mass Spectrometric Study of Nor-mal Oxygen and Oxygen subjected to Electrical Discharge, Can. J. Chemistry, 36, 1159–1170, doi:10.1139/v58-170, 1958. Hertz, J. L.: Microfabrication Methods to Improve the Kinetics of
the Yttria Stabilized Zirconia-Platinum-Oxygen Electrode, PhD thesis, Massachusetts Institute of Technology, 194 pp., 2006. Herzberg, G.: Molecular spectra and molecular structure. Vol.1:
Spectra of diatomic molecules, Van Nostrand Reinhold, New York, 686 pp., 1950.
Kim, J., Samano, E., and Koel, B. E.: Oxygen adsorption and oxida-tion reacoxida-tions on Au(211) surfaces: Exposures using O2at high pressures and ozone (O3) in UHV, Surf. Sci., 600, 4622–4632, doi:10.1016/j.susc.2006.07.057, 2006.
Lebedev, Y.: Microwave discharges: generation and diagnos-tics, J. Phys. Conf. Ser., 257, 012016, doi:10.1088/1742-6596/257/1/012016, 2010.
Légaré, P., Hilaire, L., Sotto, M., and Maire, G.: Interaction of oxy-gen with Au surfaces: A LEED, AES and ELS study, Surf. Sci., 91, 175–186, doi:10.1016/0039-6028(80)90078-3, 1980. Löhle, S., Battaglia, J.-L., Batsale, J.-C., Enouf, O., Dubard, J.,
and Filtz, R.-R.: Characterization of a Heat Flux Sensor Using Short Pulse Laser Calibration, Rev. Sci. Instrum., 78, 053501, doi:10.1063/1.2736388, 2007.
Löhle, S., Fuchs, U., Digel, P., Hermann, T., and Battaglia, J.-L.: Analysing Inverse Heat Conduction Problems by the Analysis of the System Impulse Response, Inverse Probl. Sci. En., 22, 297– 308, doi:10.1080/17415977.2013.780170, 2013.
McConkey, J. W., Malone, C. P., Johnson, P. V., Winstead, C., McKoy, V., and Kanik, I.: Electron impact dissociation of oxygen-containing molecules – A critical review, Physics Re-ports, 466, 1–103, doi:10.1016/j.physrep.2008.05.001, 2008. Mlynczak, M. G.: Energetics of the Middle Atmosphere: Theory
and Observation Requirements, Adv. Space Res., 17, 117–126, doi:10.1016/0273-1177(95)00739-2, 1996.
Munz, C.-D.: Coupled Particle-In-Cell and Direct Simulation Monte Carlo method for simulating reactive plasma flows, C. R. Mécanique, 342, 662–670, doi:10.1016/j.crme.2014.07.005, 2014.
Normand, F., Granier, A., Leprince, P., Marec, J., Shi, M. K., and Clouet, F.: Polymer Treatment in the Flowing Afterglow of an Oxygen Microwave Discharge: Active Species Profile Concen-trations and Kinetics of the Functionalization, Plasma Chem. Plasma P., 15, 173–198, 1995.
Offermann, D. and Drescher, A.: Atomic oxygen densities in the lower thermosphere as derived from in situ 5577-A night air-glow and mass spectrometer measurements, J. Geophys. Res., 78, 6690–6700, doi:10.1029/JA078i028p06690, 1973.
Offermann, D., Friedrich, V., Ross, P., and von Zahn, U.: Neutral Gas Composition Measurements between 80 and 120 km, Planet. Space Sci., 29, 747–764, doi:10.1016/0032-0633(81)90046-5, 1981.
Oldham, K. B. and Myland, J. C.: Fundamentals of Electrochemical Science, Academic Press, San Diego, 496 pp., 1994.
Osborne, J. J., Harris, I. L., Roberts, G. T., and Chambers, A. R.: Satellite and rocket-borne atomic oxygen sensor techniques, Rev. Sci. Instrum., 72, 4025–4041, doi:10.1063/1.1406928, 2001.
Park, J. H. and Blumenthal, R. N.: Electronic Transport in 8 Mole Percent Y2O3-ZrO2, J. Electrochem. Soc., 136, 2867–2876, doi:10.1149/1.2096302, 1989.
Perov, S. P. and Rakhmanov, A. S.: Atomic Oxygen Concentration Measurements by a Rocket Near the Mesopause, in: Space Re-search XVII, vol. 17, 261–264, 1977.
Pireaux, J. J., Chtaïb, M., Delrue, J. P., Thiry, P. A., Liehr, M., and Caudano, R.: Electron spectroscopic characterization of oxy-gen adsorption on gold surfaces: I. Substrate impurity effects on molecular oxygen adsorption in ultra high vacuum, Surf. Sci., 141, 211–220, doi:10.1016/0039-6028(84)90206-1, 1984. Pulpytel, J., Arefi-Khonsari, F., and Morscheidt, W.: Threshold
ion-ization mass spectrometry study of singlet molecular oxygen in the deposition of SnO2by PACVD, J. Phys. D, 38, 1390–1395, doi:10.1088/0022-3727/38/9/010, 2005.
Rapp, M., Gumbel, J., and Lübken, F.-J.: Absolute density measure-ments in the middle atmosphere, Ann. Geophys., 19, 571–580, doi:10.5194/angeo-19-571-2001, 2001.
Reddy, M. R.: Effect of low earth orbit atomic oxygen on spacecraft materials, J. Mater. Sci., 30, 281–307, doi:10.1007/BF00354389, 1995.
Saliba, N., Parker, D. H., and Koel, B. E.: Adsorption of oxygen on Au(111) by exposure to ozone, Surf. Sci., 410, 470–482, 1998. Schmiel, T.: Entwicklung, Weltraumqualifikation und erste
Ergeb-nisse eines Sensorinstruments zur Messung von atomarem Sauer-stoff im niedrigen Erdorbit, PhD thesis, Universität Dresden, 154 pp., 2009.
Schrempp, C.: Direct Measurement of Oxygen during a Ballis-tic Flight on a Sounding Rocket, in: 19th Advanced Mea-surement and Ground Testing Technology, AIAA-96-2231, doi:10.2514/6.1996-2231, 1996.
Schwandt, C. and Weppner, W.: Kinetics of Oxygen Platinum-Stabilized Zirconia and Gold-Platinum-Stabilized Zirconia Electrodes un-der Equilibrium Conditions, J. Electrochem. Soc., 144, 3728– 3738, doi:10.1149/1.1838083, 1997.
Singh, H., Coburn, J. W., and Graves, D. B.: Appearance potential mass spectrometry: Discrimination of dissociative ionization products, J. Vac. Sci. Technol. A, 18, 299–305, doi:10.1116/1.582183, 2000.