An analysis of tacrolimus-related complications in
the first 30 days after liver transplantation
Lucas Souto Nacif, Andre´ Ibrahim David, Rafael Soares Pinheiro, Marcio Augusto Diniz, Wellington Andraus, Ruy Jorge Cruz Junior, Luiz A. Carneiro D9Albuquerque
Faculdade de Medicina da Universidade de Sa˜o Paulo, Department of Gastroenterology, Liver and Gastrointestinal Transplant Division, (LIM 37), Sa˜o Paulo/SP, Brazil.
OBJECTIVES: Orthotopic liver transplantation has improved survival in patients with end-stage liver disease; however, therapeutic strategies that achieve ideal immunosuppression and avoid early complications are lacking. To correlate the dose and level of Tacrolimus with early complications, e.g., rejection, infection and renal impairment, after liver transplantation. From November 2011 to May 2013, 44 adult liver transplant recipients were studied in this retrospective comparative study.
RESULTS:The most frequent indication for liver transplantation was hepatitis C cirrhosis (47.7%), with a higher prevalence observed in male patients (68.18%). The ages of the subjects ranged from 19-71 and the median age was 55.5 years. The mean length of the hospital stay was 16.1¡9.32 days and the mean Model for End-stage Liver Disease score was 26.18¡4.28. There were five cases of acute cellular rejection (11.37%) and 16 cases of infection (36.37%). The blood samples that were collected and analyzed over time showed a significant correlation between the Tacrolimus blood level and the deterioration of glomerular filtration rate and serum creatinine (p,0.05). Patients with infections had a higher serum level of Tacrolimus (p= 0.012). The dose and presence of rejection were significantly different (p= 0.048) and the mean glomerular filtration rate was impaired in patients who underwent rejection compared with patients who did not undergo rejection (p= 0.0084).
CONCLUSION:Blood Tacrolimus levels greater than 10 ng/ml were correlated with impaired renal function. Doses greater than 0.15 mg/kg/day were associated with the prevention of acute cellular rejection but predisposed patients to infectious disease.
KEYWORDS: Liver Transplantation; Renal Failure; End-Stage Liver Disease; Tacrolimus; Rejection.
Nacif LS, David AI, Pinheiro RS, Diniz MA, Andraus W, Cruz-Junior RJ, et al. An analysis of tacrolimus-related complications in the first 30 days after liver transplantation. Clinics. 2014;69(11):745-749.
Received for publication onFebruary 25, 2014;First review completed onApril 14, 2014;Accepted for publication onAugust 14, 2014 E-mail: [email protected]
Tel.: 55 11 2661-3323
& INTRODUCTION
Orthotopic liver transplantation (OLT) has markedly improved survival in patients with end-stage liver disease, especially due to advances in surgical techniques, anesthesia and immunosuppressive therapy. Calcineurin inhibitors (CNIs) (1-3) have dramatically improved patient survival after OLT; however, nephrotoxicity, renal dysfunction with chronic renal injury and end-stage kidney disease occur in 3-20% of recipients taking CNIs post-transplant and these conditions contribute to the high morbidity and mortality associated with this course (2-4). Thus, CNI therapy must be closely monitored. Furthermore, the development of
ther-apeutic strategies that achieve effective immunosuppression while limiting early complications, such as infection, rejection or renal failure, remains a real challenge after OLT (5,6).
The purpose of this study was to determine the relation-ship between the dose and blood level of Tacrolimus with early complications post-OLT.
& MATERIALS AND METHODS
Study design
We analyzed 44 adult OLT recipient patients in the Liver GI Transplant Division within the Department of Gastroen-terology, University of Sa˜o Paulo School of Medicine during the first 30 post-operative days, from November 2011 to May 2013. We retrospectively studied their demographic, clinical and laboratory data. Rejection episodes were biopsied and defined by the Banff criteria (7). Complications from bacterial, fungi or viral infections at any site were determined. Blood samples were collected daily during hospitalization and at least weekly during the first month after OLT to analyze the creatinine level and glomerular filtration rate (GFR). GFR was estimated according to the Cockcroft-Gault equation (8). Copyrightß2014CLINICS– This is an Open Access article distributed under
the terms of the Creative Commons Attribution Non-Commercial License (http:// creativecommons.org/licenses/by-nc/3.0/) which permits unrestricted non-commercial use, distribution, and reproduction in any medium, provided the original work is properly cited.
No potential conflict of interest was reported.
Inclusion and exclusion criteria
The following parameters were excluded from analysis: living donor recipients, severe acute hepatitis, combined liver-kidney transplantation, split liver, use of immunosup-pressants other than Tacrolimus and prednisone, very ill patients (MELD.40) and those who died before the 30-day follow-up. These patients exhibited multifactorial variables and no linear use of immunosuppression. Demographic parameters were evaluated in these patients. The mean, standard deviation, median, range, number and percentage were calculated for each parameter. The graphics were analyzed over time and compared with the blood level and dose of Tacrolimus, GFR and serum creatinine.
Immunosuppression regime, diagnostic criteria and group definitions
In all cases, transplants were performed via thepiggyback
technique (9). The preservation solutions most commonly used were ViaspanH and CustodiolH. These immunosup-pressive regimens followed a general protocol, but each was customized as necessary. All patients received a steroid (ST) bolus during the anhepatic phase (500 mg), which was decreased to 20 mg/day and tapered to a complete stop within 3 to 6 months of transplantation. Tacrolimus was orally administered and maintained in all patients (0.10-0.15 mg/kg/day administered via two daily doses admi-nistered every 12 hours). All patients with acute cellular rejection (n = 5) were included in the rejection group with established evidence in laboratory analysis, histological findings (Banff criteria) and the treatment used. Episodes of infection were confirmed in patients (n = 16) by positive cultures from any site and laboratory abnormalities (leuko-cytosis and increased C-reactive protein).
Statistical analysis
Results are expressed using descriptive measures (means
¡ standard error) for the following variables: Tacrolimus
dose (mg/kg/day), serum level of Tacrolimus (ng/ml) and GFR (ml/min). The Student t-test and Mann-Whitney test were used to compare quantitative and categorical vari-ables, respectively, among groups. These variables were compared between groups with and without occurrence of infection or between groups with or without rejection by analysis of variance (ANOVA) with repeated measures using a nonparametric statistical program in R (Version
2.15.1). Differences were considered statistically significant whenp,0.05.
Ethical aspects
The study was approved by the Ethics Committee of Human Experimentation.
& RESULTS
Clinical and Demographic Population Profile We observed a higher prevalence of male gender (68.18%) compared with female gender. The mean age of the patients was 52.43 years old (¡12.33); the median age was 55.5 years
old and the range was 19-71 years old. The mean weight was 75.15 kg (¡18.61); the mean of body max index (BMI) was 25.94¡4.58 and the mean length of hospital stay was 16.1¡9.32
days. The major cause for transplantation was hepatitis C virus-induced cirrhosis (47.7%), followed by alcoholic cirrhosis (13.6%), primary sclerosing cholangitis (6.8%), cryptogenic cirrhosis (6.8%), autoimmune hepatitis (6.8%), hepatitis B virus cirrhosis (6.8%), nonalcoholic fatty liver disease (4.7%) and other (6.8%). The mean MELD score was 26.18¡4.28 (Table 1).
Overall patient characteristics
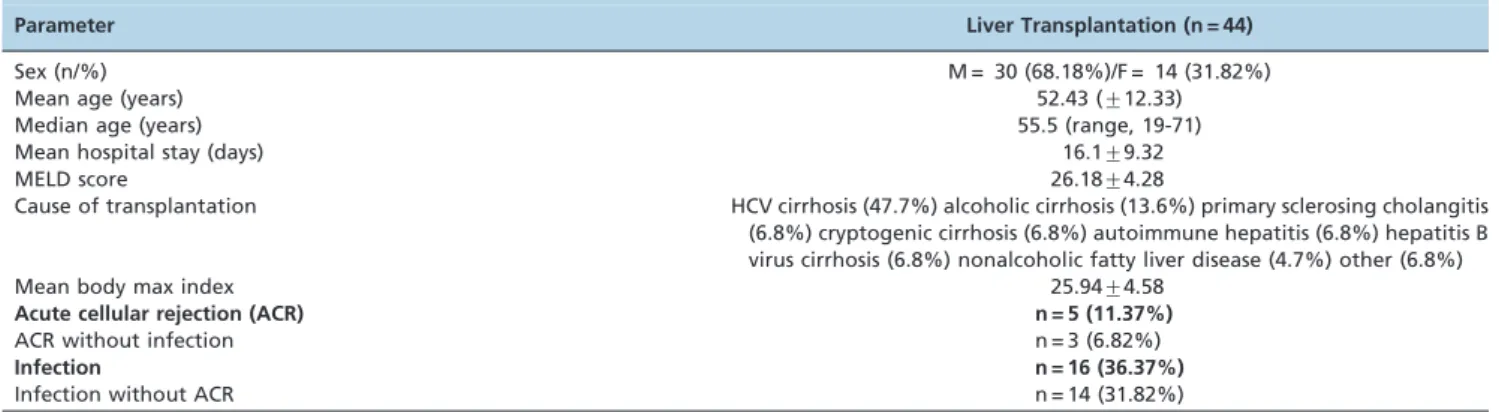
The patients were evaluated over time (3, 5, 7, 10 and 15 days post-transplant) and then divided into groups based on the presence or absence of infection or rejection. The number and percentage of patients in each group are as follows: infection (n = 16/36.37%), no infection (n = 28/63.63%), rejec-tion (n = 5/11.37%) and no rejecrejec-tion (n = 39/88.64%) (Table 2). We observed that the mean age of patients with rejection was lower than that of the other groups and the weight of this group was higher than that of the other groups. The mean hospital stay was longer in patients with infection than in those without infection (p= 0.003) and those with rejection (p= 0.043). Patients without early complications (rejection or infection) had a mean hospital stay of 12 days after OLT. A higher MELD score was observed in patients with infection (27.14¡6.05) compared with those without infection.
Comparison groups - early complication
The mean dose of Tacrolimus was lower on the third day after transplantation in both groups with early complications (infection and rejection), marking a statistically significant level of difference (p,0.05). However, when the blood level
Table 1 -Demographic parameters for all liver transplantation patients.
Parameter Liver Transplantation (n = 44)
Sex (n/%) M = 30 (68.18%)/F = 14 (31.82%)
Mean age (years) 52.43 (¡12.33)
Median age (years) 55.5 (range, 19-71)
Mean hospital stay (days) 16.1¡9.32
MELD score 26.18¡4.28
Cause of transplantation HCV cirrhosis (47.7%) alcoholic cirrhosis (13.6%) primary sclerosing cholangitis (6.8%) cryptogenic cirrhosis (6.8%) autoimmune hepatitis (6.8%) hepatitis B virus cirrhosis (6.8%) nonalcoholic fatty liver disease (4.7%) other (6.8%)
Mean body max index 25.94¡4.58
Acute cellular rejection (ACR) n = 5 (11.37%)
ACR without infection n = 3 (6.82%)
Infection n = 16 (36.37%)
Infection without ACR n = 14 (31.82%)
of Tacrolimus was higher than 10 ng/ml in the infection group (11.38 ng/ml), a decrease in GFR (p= 0.048) on day 15 after OLT (Table 2) was observed.
Infection x No infection
Differences in the mean dose of Tacrolimus over time were found between the groups with and without infection (p,0.001), as shown in Figure 1A. The mean dose was increased until day 7 and was subsequently reduced.
There were differences in the mean blood level of Tacrolimus over time in both groups (p,0.001), as shown in Figure 1B. We observed a constant increase in the level of Tacrolimus in the group with infection, which differed from the group without infection on day 10 after LT.
Rejection x No rejection
There were differences in the mean dose of Tacrolimus over time between these groups (p= 0.0314, Figure 1C). An increase in the Tacrolimus dose was followed by a reduction after the seventh day in the group without rejection and after the tenth day for the group with rejection.
There were differences in the mean level of Tacrolimus over time between the groups (p= 0.0314, Figure 1D). Notably, there was an increase in the level of Tacrolimus in the rejection group after the tenth day.
Differences between the mean GFR for the groups with and without rejection were observed over all time points (p= 0.0084). We observed a significant decrease in GFR when the blood level of Tacrolimus increased to more than 10 ng/ml (Figure 1F) or the dose increased to greater than 0.15 mg/kg/day (Figure 1E). This decrease was followed by an improvement in GFR after the reduction of both the Tacrolimus dose and level.
& DISCUSSION
An analysis of the graphics over time shows a significant correlation between the serum or dose level of Tacrolimus and the deterioration of the GFR and serum creatinine.
Rodrı´guez-Pera´lvarez et al. (10) performed a systematic review and meta-analysis on this topic. Their aim was to determine how lower than currently recommended Tacrolimus concentrations affect acute rejection rates and renal impairment. Among randomized trials, the mean Tacrolimus trough concentration during the first month positively correlates with renal impairment within 1 year post-transplant. A meta-analysis of randomized trials directly comparing Tacrolimus trough concentrations showed that "reduced Tacrolimus’’ levels (,10 ng/ml) within the first month after liver transplan-tation were associated with less renal impairment at 1 year (10). In this study, we observed a significant correlation between Tacrolimus blood level and decreased GFR.
The curve of the Tacrolimus levelversus GFR showed an increase until the fifteenth day, followed by a brief drop until the twenty-fifth day and, finally, a sudden rise on the thirtieth day. This late rise may be due to the small number of individuals assessed on the last day of the study. This Tacrolimus curve is similar to the doseversusGFR curve. There was an increase in the mean dose until the seventh day, which, when considering the measurement delay, likely corresponds to the increase in GFR observed until the tenth day post-LT. This increase was followed by reductions in both curves.
Kong et al. (4) showed that, in a CNI minimization group (lower CNI dose than in a routine CNI regimen group), creatinine levels were significantly decreased. However, creatinine clearance was not significantly higher in the CNI minimization group. Both acute rejection episodes and patient survival were comparable between the groups. Therefore, the current CNI minimization protocols may be accompanied by a greater number of infections (4). Lower trough concentrations of Tacrolimus (6-10 ng/ml during the first month) would be more appropriate after OLT (10). In our study, we observed that patients with Tacrolimus levels up to 10 ng/ml had fewer early complications.
Despite the recommendations, in this study, we observed that a decreased serum level of Tacrolimus was better at preventing infection and acute cellular rejection. However, Table 2 -Comparison of the variables among the groups over time.
Variable
Infection (n = 16/36.37%)
Mean (SD)
No Infection (n = 28/63.63%)
Mean (SD) p-value
Rejection (n = 5/11.37%)
Mean (SD)
No Rejection (n = 39/88.64%)
Mean (SD) p-value
Age 53.93¡9.71 52.52¡13.62 NA 42.67¡15.53 52.52¡13.62 0.352
Weight 72.57¡26.39 75.44¡12.99 0.151 82.17¡18.94 75.44¡12.99 0.602
H. stay 22.21¡12.95 12.28¡4.2 0.003 18¡4.36 12.28¡4.2 0.043
MELD 27.14¡6.05 25.44¡3.2 0.806 25.67¡2.89 25.44¡3.2 NA
Dose.t3 0.55¡0.33 0.068¡0.32 0.044 0.066¡0.33 0.06¡0.32 0.048
Dose.t5 0.096¡0.30 0.130¡0.31 0.057 0.066¡0.33 0.067¡0.32 0.824
Dose.t7 0.174¡0.31 0.117¡0.32 0.044 0.198¡0.39 0.147¡0.32 0.960
Dose.t10 0.107¡0.41 0.187¡0.44 0.266 0.188¡0.53 0.149¡0.38 0.261
Dose.t15 0.089¡0.48 0.117¡0.58 0.421 0.129¡0.70 0.097¡0.52 0.857
Level.t3 3.62¡3.47 3.76¡1.98 0.452 8.00¡5.80 3.76¡1.98 0.231
Level.t5 4.23¡2.42 5.4¡2.47 0.192 7.37¡5.04 5.4¡2.47 0.630
Level.t7 6.21¡4.56 7.94¡3.25 0.068 9.20¡2.74 7.94¡3.25 0.470
Level.t10 8.41¡5.86 9.67¡3.61 0.140 15.43¡10.67 9.67¡3.61 0.396
Level.t15 11.31¡3.8 7.6¡3.140 0.012 12.37¡2.63 7.6¡3.14 0.030
GFR.t3 59.95¡25.71 82.93¡42.56 0.105 110.2¡8.52 82.93¡42.56 0.125
GFR.t5 67.79¡41.22 80.53¡39.95 0.176 88.23¡5.06 80.53¡39.95 0.353
GFR.t7 71.96¡36.21 84.03¡54.19 0.314 95.23¡27.25 84.03¡54.19 0.219
GFR.t10 75.39¡49.22 88.21¡53.84 0.416 103.53¡29.44 88.21¡53.84 0.351
GFRt15 58.96¡29.33 83.29¡34.47 0.048 102.63¡14.48 83.29¡34.47 0.248
Note: Mean and standard deviations (SD).
Figure 1 -Comparisons of different parameters after liver transplantation.A -Tacrolimus dose and infection rate over 15 days.B
we only evaluated nephrotoxicity and did not examine neurotoxicity or diabetes mellitus as additional endpoints. Other studies have shown that (11) a Tacrolimus concentra-tion of 5 to ,8 ng/ml is associated with the least overall toxicity, neurotoxicity and ACR. The neurotoxicity was lowest in the trough range from 5 to,8 ng/ml and diabetes mellitus was present in 11% to 18% of patients across the various trough ranges, including the extremes (mean trough level, 8.4¡4.4 ng/dl) (11).
In conclusion, when the average Tacrolimus serum level was above 10 ng/ml and the dose was greater than 0.15 mg/kg/day acute cellular rejection was prevented; however, this dose was also associated with reduced renal function and, occasionally, infectious disease.
& ACKNOWLEDGMENTS
The authors wish to thank all other members of the Epidemiologic Department and contributors to the achievement of this work. Laboratory of Epidemiology and Statistics of Department of Gastroenterology, School of Medicine - University of Sa˜o Paulo, SP, Brazil.
& AUTHOR CONTRIBUTIONS
Nacif LS was responsible for the references, background, data collection, analysis and manuscript preparation. David AI was responsible for the formulation of hypotheses, references, background, analysis and review. Pinheiro RS was responsible for the references, background, analysis and review. Diniz MA was responsible for the statistical analysis. Andraus W was responsible for the analysis and review. Cruz-Junior RJ was responsible for the references, background, analysis and review. D9Albuquerque LA was responsible for the analysis and review.
& REFERENCES
1. Sanchez EQ, Melton LB, Chinnakotla S, Randall HB, McKenna GJ, Ruiz R, et al. Predicting renal failure after liver transplantation from measured
glomerular filtration rate: review of up to 15 years of follow-up. Transplanta-tion. 2010;89(2):232-5, http://dx.doi.org/10.1097/TP.0b013e3181c42ff9. 2. Gonwa TA, Mai ML, Melton LB, Hays SR, Goldstein RM, Levy MF, et al.
End-stage renal disease (ESRD) after orthotopic liver transplantation (OLTX) using calcineurin-based immunotherapy: risk of development and treatment. Transplantation. 2001;72(12):1934-9, http://dx.doi.org/ 10.1097/00007890-200112270-00012.
3. Weber ML, Ibrahim HN, Lake JR. Renal dysfunction in liver transplant recipients: evaluation of the critical issues. Liver Transpl. 2012;18(11): 1290-301, http://dx.doi.org/10.1002/lt.23522.
4. Kong Y, Wang D, Shang Y, Liang W, Ling X, Guo Z, et al. Calcineurin-inhibitor minimization in liver transplant patients with calcineurin-inhibitor-related renal dysfunction: a meta-analysis. PLoS One. 2011;6(9):e24387, http://dx.doi.org/10.1371/journal.pone.0024387. 5. Charlton MR, Wall WJ, Ojo AO, Gine`s P, Textor S, Shihab FS, et al.
Report of the first international liver transplantation society expert panel consensus conference on renal insufficiency in liver transplantation. Liver Transpl. 2009;15(11):S1-34, http://dx.doi.org/10.1002/lt.21877. 6. Morard I, Mentha G, Spahr L, Majno P, Hadengue A, Huber O, et al.
Long-term renal function after liver transplantation is related to calcineurin inhibitors blood levels. Clin Transplant. 2006;20(1):96-101, http://dx.doi.org/10.1111/j.1399-0012.2005.00447.x.
7. Demetris A, Adams D, Bellamy C, Blakolmer K, Clouston A, Dhillon AP, et al. Update of the International Banff Schema for Liver Allograft Rejection: working recommendations for the histopathologic staging and reporting of chronic rejection. An International Panel. Hepatology. 2000;31(3):792-9.
8. Brown DL, Masselink AJ, Lalla CD. Functional range of creatinine clearance for renal drug dosing: a practical solution to the controversy of which weight to use in the Cockcroft-Gault equation. Ann Pharmacother. 2013;47(7-8):1039-44, http://dx.doi.org/10.1345/aph.1S176.
9. Moreno-Gonzalez E1, Meneu-Diaz JG, Fundora Y, Ortega P, Moreno Elola-Olaso A, Garcı´a Garcı´a I, et al. Advantages of the piggy back technique on intraoperative transfusion, fluid compsumption, and vasoactive drugs requirements in liver transplantation: a comparative study. Transplant Proc. 2003;35(5):1918-9.
10. Rodrı´guez-Pera´lvarez M, Germani G, Darius T, Lerut J, Tsochatzis E, Burroughs AK. Tacrolimus trough levels, rejection and renal impairment in liver transplantation: a systematic review and meta-analysis. Am J Transplant. 2012;12(10):2797-814.