*e-mail: [email protected]
Assessement of Tensile Strength of Graphites by the Iosipescu Coupon Test
Luis Guilherme Borzani Manhania, Luiz Claudio Pardinib*, Flamínio Levy Netoc a
Centro Técnico Aeroespacial, Depto. Eng. Aeronáutica e Mecânica,
Instituto Tecnológico de Aeronáutica – ITA, 12228-900 São José dos Campos - SP, Brazil
b
Centro Técnico Aeroespacial, Instituto de Aeronáutica e Espaço – IAE,
Divisão de Materiais – AMR, 12228-904 São José dos Campos - SP, Brazil
c
Universidade de Brasília, Departamento de Engenharia Mecânica – UnB/FT/ENM,
70910-900, Brasília - DF, Brazil
Received: August 2, 2006; Revised: August 3, 2007
Polycrystalline graphites are widely used in the metallurgical, nuclear and aerospace industries. Graphites are particulated composites manufactured with a mixture of coke with pitch, and changes in relative proportions of these materials cause modifications in their mechanical properties. Uniaxial tension tests must be avoided for mechanical characterization in this kind of brittle material, due to difficulties in making the relatively long specimens and premature damages caused during testing set-up. On other types of tests, e.g. bending tests, the specimens are submitted to combined stress states (normal and transverse shear stresses). The Iosipescu shear test, is performed in a beam with two 90° opposite notches machined at the mid-length of the specimens, by applying two forces couples, so that a pure and uniform shear stress state is generated at the cross section between the two notches. When a material is isotropic and brittle, a failure at 45° in relation to the beam long axis can take place, i.e., the tensile normal stress acts parallel to the lateral surface of the notches, controls the failure and the result of the shear test is numerically equivalent to the tensile strength. This work has evaluated a graphite of the type used in rocket nozzles by the Iosipescu test and the resulted stress, ∼11 MPa, was found to be equal to the tensile strength. Thus, the tensile strength can be evaluated just by a single and simple experiment, thus avoiding complicated machining of specimen and testing set-up.
Keywords: polycrystalline graphites, mechanical properties, tensile strength, shear strength, weibull modulus
1. Introduction
Synthetic graphites are widely used in many engineering ap-plications, such as those in the metallurgical, nuclear and aerospace industries, and as electrodes for ion-lithium batheries1. They are
manufactured using a blend of coke and pitch in different proportions. Graphites can be classified according to the raw material as coarse, medium or fine grain, and depending on their processing technique as extruded or molded grades2. This will lead to microstructures
characterized as being anisotropic in the case of extruded grades and isotropic in the case of molded grades. During processing, heat treatment temperature lead to changes in mechanical and thermal properties. If the constituent phases, coke and binder coke have dif-ferent properties, and the properties of the graphite are difdif-ferent from properties of the constituents, then graphites can be recognized as a particulated composites. Due to their excellent thermo-mechanical properties and low density (<2 g.cm-3) graphites are suitable for use
as high temperature components.
Mechanical properties, such as tensile strength, flexural strength, shear strength, among others, are commonly used to characterize materials which will give their mechanical finger-printing. These test methods are acceptable for determining design allowables, for comparative purposes and also for quality control. The test data depends on the test method, specimen design, fabrication method, and microstructure3. Among all the mechanical tests that are used to
characterize materials the uniaxial tension test should be avoided,
particularly for brittle materials, which is the case of graphites, due to difficulties in making the relatively long specimens (they are prone to fail during machining) and possible damages caused during testing set-up. In some other types of tests, e.g. bending tests, the specimens are submitted to combined stress states, i.e. simultaneous normal and transverse shear stresses, and the results for strength and modulus can be misleaded. Although there are many test methods to measure shear properties of materials, still none of them are ideal for introduc-ing real pure shear stresses in the specimens. This difficulty must be overcome by materials scientists involved in the development and characterization of materials.
The most uniform and pure shear-stress state can be achieved in a material by applying torsional loading to a thin-walled tube specimen. However, this kind of specimen is usually expensive to be produced and the testing procedure is not straightforward, because buckling failure along ±45° can take place. In the early sixties, N. Iosipescu, from Romania, developed a simple test to determine shear strength and shear modulus for metals, but the first published work in English language appeared only in the late sixties4,5. Since then, the new
eas-ily fabricated specimens, and enables very accurate and reproducible results for shear modulus and shear strength6,7. Since then, Iosipescu
shear test has became very popular for the determination of shear strength and shear modulus for a broad range of materials8.
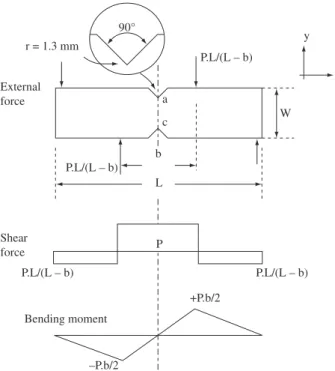
In the Iosipescu specimen a pure transverse shear stress state occurs in the cross section between the two 45° opposite notches machined at the mid-length of the specimen (points a and c in Fig-ure 1). By applying two forces couples that generate two opposite bending moments, a pure shear stress state is generated between two notches of the beam, as shown by the external force, shear-force and bending-moment diagrams of Figure 1. According to the Mohr circle diagram corresponding to this resulting stress state that acts in the specimen, the principal normal stresses act parallel to the lateral surface of the notches (i.e at 45° with respect to the longitudinal direction of the specimen, x). If the failure occurs perpendicular to this direction, which is caused by a principal normal tensile stress its value can be used to evaluate tensile strength. This behavior is typical for brittle materials in which the deformations as well as the distortions are particularly small, up to the failure load, and eventual geometric changes during the tests are negligible. Finite-element analysis of the test configuration has been object by several authors to investigate the influence of stress distributions and for validation of the Iosipescu test6,9.
Cracks and pores are common features that are found in graphite microstructure. These defects are, in fact, undesirable structural pa-rameters that significantly reduces the mechanical properties of the material, mainly the tensile strength. Since they can not be avoided, these microstructural features and the inherent brittleness of graphites gives rise to an appreciable scatter in the results of strength properties. Weibull distribution statistics is currently a well established statisti-cal tool to evaluate the significant variability of the mechanistatisti-cal test results which takes place in brittle materials and will be applied to the data collected from the Iosipescu shear test.
2. Experimental
2.1. Material
The graphite used in the work was provided by SGL Carbon Ltd - USA, trade name HLM 85. It is extruded in ∼20 cm cylinder blocks. The apparent density of HLM graphite is 1.73 g.cm-3. All the sample
specimens were taken parallel to extrusion direction.
Optical microscopy was carried out in a Leica DM RxP opti-cal microscope. The amount of porosity was analysed by mercury intrusion porosimetry in a Autoscan-33 Quantachrome Porosimeter. Surface of the fractured specimens were analysed by an Oxford Leo 435 Vpi scanning electron microscope. The HLM 85 graphite is suitable for use at high temperature applications and it is extensively used as rocket nozzle throat inserts.
2.2 Tensile test
Tensile tests were performed on HLM graphite, with the applied load parallel to extrusion direction, following procedure described in the ASTM C 749 Standard by using the Instron universal testing machine10. Dimensions of the tensile coupon are shown in Figure 2
and the cross head speed was set at 0.5 mm/min. Longitudinal and transverse strains were measured by using 90° rosette FCA-I-23 strain gages from Tokyo Sokki Kenkyujo Co. Ltd, attached at center of the specimen, Equation 1, using the experiemental values of the transverse and the longitudinal strains (e), as following:
n e
e = - transverse
longitudinal
(1)
2.3. The Iosipescu test set-up
The Iosipescu shear specimens were machined and the test was performed according to ASTM D 5379M standard, using an Instron 430111. As for the tensile coupons, the Iosipescu shear specimens
were machined parallel to the extrusion direction (x) of the graphite cylinders, as seen in Figure 3. Thirty two identical specimens were tested to failure. The cross head speed was 0.5 mm/min. The average shear stress, in the region where the shear force V = P is maximum, is defined by the Equation 212:
txy P d t = . (2) 90°
P.L/(L – b)
P.L/(L – b) P.L/(L – b)
–P.b/2 +P.b/2 External force Shear force Bending moment r = 1.3 mm
P.L/(L – b)
W y x a c b L P
Figure 1. Loading configuration showing the free-body, the external force diagram, the shear-force diagram, and the bending moment diagrams along the longitudinal axis of the specimen.
16.5 3.2 120 22.5 22.5 R3.0 20 10 16.5 y x Extrusion direction
Figure 2. Dimensions for tensile test specimen according to ASTM C-749 Standard. Units in milimeters.
a SG1 (–45°)
SG2 (+45°) c y x Extrusion direction
where: P = applied load; d = distance between roots of notches (seg-ment from a to c in Figure1); and t = specimen thickness.
The sketch of the strain-gage position in the Iosipescu specimen is show in Figure 3. During testing a pure shear loading is gener-ated in the zero bending moment section of the beam and the shear stress has its maximum value at the cross section ac. To prevent non-perpendicularity of fixture-sample contacts to the Iosipescu rig, all specimens were machined with 13 mm thickness, following sug-gestion of Pierron6. Strain-gages of the type 90° rosette FCA-I-23,
from Tokyo Sokki Kenkyujo Co. Ltd were properly attached to in the samples, as shown in Figure 3.
2.4. Weibull modulus
The Weibull modulus from the Iosipescu shear results was calculated. The determination of Weibull modulus (m) considers the assumption of a constant volume for all samples tested, and the results is a straight line equation, when plotting experimental failure stress values (σ) as a function of cumulative probability of failure (P), according to Equation 313 :
lnln (1/1 – P) = m.ln σ – m.ln σo (3)
where σo is the intrinsic strength of the material, which corresponds to a stress level associated with a probability of failure of about 73% (or a survival probability of 37%).
The Weibull modulus (m) corresponds to the inclination of a straight line which is obtained by plotting lnln (1/(1 – P) as function of ln σ. When the failure stresses (σi) are ranked from the highest to the lowest results, the probability of failure from an intermediate position (Pi), corresponding to the i-th observation, is given by Pi = i/ N + 1, where N is the number of samples. The Weibull modulus (m) is obtained by linear regression. The Weibull modulus is a parameter that can indicates the level and how homogeneous is the distribution of the failure stresses (σi) in a material. Ductile materials, in which the defects are reduced and homogeneously distributed, present a high Weibull modulus (e.g. m = 100, for an annealed SAE 1020 steel), whereas for brittle materials m is low (e.g. m ≅ 5, for carbon fibers). So, the lower is the scatter in the failure stresses, the higher is the Weibull modulus of a material.
3. Results and Discussion
The Figure 4 shows a typical optical micrography of a polished surface of the HLM graphite. HLM graphite is formed by a binder phase and elongated needled-coke grains. As a consequence HLM graphite is anisotropic in nature. A broad range of pores and micro-cracks can be found in the microstructure and they are represented by the dark areas in Figure 4. The reflection interference colors in graphites shows that the binder phase contains regions of common basal plane orientation and they exhibits a broad variation in size and shape. This is the case for HLM 85 graphite. A typical size of these anisotropic components is ∼125 µm, which is in the range of 1-500 µm as described by Forest and Marsh14. In fact, the initial
medium grain size for this graphite from manufacturer’s data sheet is 0.8382 mm.
Mercury intrusion porosimetry shows that a 12% open pore vol-ume is present in the HLM graphite. The IUPAC boundary for mes-opores and macrmes-opores is at pore radius ∼25 µm. The pore distribution size is broad, ranging from 1-2 to 250 µm, as shown in Figure 4.
As any other ceramic-like material, the mechanical properties for graphites are mainly influenced by raw materials (grain size and dis-tribution, porosity, viscosity, etc), processing conditions and preferred orientation of crystallites. Figure 5 shows plots of the tensile stress as a function of strain for the tensile coupons in the direction
paral-lel to extrusion (x, which corresponds to the sample long axis). The stress-strain curves are non-linear, and they show that elastic modulus decrease with an increase in stress. The average for tensile strength (with the corresponded standard deviation) was 10.9 ± 2.1 MPa, and deformation up to failure was 0.2 ± 0.05%.
Data for Young’s modulus were calculated from the slope of the initial part of the stress-strain curve, which was taken up to ∼2 MPa, resulting in 11.5 ± 0.9 GPa. Longitudinal strain was 0.0962 ± 0.05 and transverse strain was –0.018 ± 0.006 resulting in a Poisson’s ratio of 0.187. These data confirms figures for tensile strength and elastic modulus found in literature and manufacturer’s data, which are in the range 8-12 MPa15. Tensile coupons failed sharply at the value of
maximum stress, in two pieces within the gage length region. Typical shear stress-strain curves are given in Figures 6 and 7. The curves are reasonably quadratic. Figure 8 shows a curve for shear stress, calculated from Equation 2, as a function of strain for the Iosipescu shear testing. As for tensile stress-strain curve, the shear stress-strain curve is also non-linear, and the stress grows monotonically up to maximum when an abrupt decrease in strength related to brittle failure occurs. The measured shear stress up to failure of the HLM graphite, calculated from Equation 2, was 11.7 ± 1.7 MPa. At the peak stress the average deflection of the
speci-250µm
Figure 4. Optical microscopy of the HLM graphite. Dark areas represent pores.
0 2 4 6 8 10 12 14
0 200 400 600 800 1000 1200 1400 Strain (10-6 m/m)
T
ensile stress (MP
a)
testing for the HLM 85 happened in a 45° inclination in relation to the applied forces.
Early work carried out by Taylor16 on mechanical properties of
reactor graphites found a shear strength in the range of 22-33 MPa, measured by the double shear apparatus. The tensile strength reported in the same work was in the range of 10.7-14.0 MPa, giving a tensile strength/shear strength ratio of ∼0.5. It is obvious that an incongru-ence exists on results for shear strength found by Taylor and in the present work. Also, the failure mode does not correspond to a pure shear failure mode (which, in such situation, should de parallel to the line between the notches, ac, in Figure 3).
To explain the results and behavior found in this work during Iosipescu shear test it is necessary the help of mechanics of materials. A general Mohr circle diagram, as shown in Figure 10, represents all the possible normal (σ) and shear (τ) stresses, along any direction, for a typical bi-dimensional (2-D) stress state in a point of a material. Thus, we can apply this concept in the notch region of the Iosipescu shear speciment. From the concepts of materials mechanics, in the planes associated with the points Q and P in the Mohr circle, where the normal stresses assume their maximum (σ1) and minimum (σ2) values, respectively, the shear stresses are zero. These planes are the principal planes and the normal stresses at them are the principal stresses, defined as σ1 and σ2 at the points P and Q, respectively17.
0 2 4 6 8 10 12 14 16
0 250 500 750 1000 1250 1500 1750 2000 2250 2500 Strain (10-6 m/m)
Shear stress (MP
a)
Figure 6. Typical shear stress-strain for SG1 strain gage (–45°) for the Iosipescu coupon.
0 2 4 6 8 10 12 14 16
–300 –275 –250 –225 –200 –175 –150 –125 –100 –75 –50 –25 0
Shear stress (MP
a)
Strain (10-7 m/m)
Figure 7. Typical shear stress-strain for SG2 strain gage (+45°) for the Iosipescu coupon.
0 2 4 6 8 10 12 14 16
0 500 1000 1500 2000 2500 3000 3500 4000 4500
Shear stress (MP
a)
Strain (10-6 m/m)
Figure 8. Plot of the curve of Iosipescu shear stress as a function of strain. Sample long axis (x) is parallel to extrusion.
men was 0.75 ± 0.09 mm, which corresponds to a strain to failure of 0.38 ± 0.04%. Shear modulus calculated in the elastic region of the shear stress-strain curve resulted in a value of 3.02 ± 0.6 GPa.
The Iosipescu test procedure states that pure shear stress should occurs in the ac section (Figure 1) leading to a failure in between notch tips and shear strength can be calculated by Equation 2. However, as could be seen in Figure 9, the failure mode after Iosipescu shear
Figure 10. Mohr circle for general bi-dimensional stress state15.
P
C
Q 2
σx + τxy
σ1
σ σ2
τmax
σy – τxy
τmax
σx + σy)
τ
Figure 9. Fracture specimen of HLM graphite showing the characteristic failure mode at 45° in relation to the applied stress.
0 5 cm
Direction of applied force
y
Due to the fact that in the circle of Mohr presented in Figure 10, the magnitudes of the principal normal stresses are identical to the maximum shear stresses (in particular, σ1 = τmax and σ2 = –τmax) and, in addition, the principal directions 1 and 2 are coincident to orientations of the strain gauges 1 and 2, in Figure 3 (SG1 and SG2), respectively. The shear stress-strain plots indicate that tensile stresses are normal to the upper left hand side V-notch, corresponding to the SG1 strain-gage deformation. On the other hand, compressive stresses are normal do the lower right hand side V-notch face, corresponding to the SG2 strain-gage deformation. In the Mohr circle, the stresses σ1 and σ2 can be obtained by the Equations 4 and 5, as following:
s1 s 2s s s 2 t2 1
2 4
= x+ y+ ( x- y) + xy (4)
s2 s 2s s s 2 t2 1
2 4
= x+ y- - +
x y xy
( ) (5)
where σ1 and σ2 are mathematically the maximum and minimum principal normal stresses.
The maximum shear stress in a point can be expressed by Equa-tion 6, as following :
tsmax= ± (sx-sy) + txy
1
2 4
2 2 (6)
Subtracting Equation 4 from Equation 5, Equation 7 is ob-tained:
s1-s2= ± (sx-sy)2+4t2xy (7)
As a result Equation 8 can be obtained as following :
tsmax= (s -s ) 1
2 1 2 (8)
The Mohr circle of Figure 10 refers to a general 2-D stress state. However, in the region between the notches (ac, in Figure 3), in particular, there is pure shear along the directions x and y, and so
σx = σy = 0 (as shown in the Mohr circle of Figure 11, at point A), it
is clear from Equations 4 and 6 that:
σ1 = τmax (9)
During Iosipescu shear testing, depending on the direction which is considered, components of normal and shear stress are present in the
region (ac) between notches. The principal normal stresses are located at ±45° relatively to the longitudinal direction (x) of the specimens and they act parallel (or perpendicular) to the specimen notch lateral surfaces, according to Figures 3 and 9. In addition, along the direc-tions x and y there is pure shear, according to Figure 1, and a failure occurring perpendicular to the direction –45° (≡ SG1), as shown in Figure 9 will take place with the same stress value obtained from Equation 2, due to the fact that σ1 = τmax, according to Equation 9.
As stated earlier, for a ductile material, the failure mode for the Iosipescu specimen in pure shear would correspond to a fracture at the cross section, and the tensile strength would be higher than the shear strength. The Morh circle construction in Figure 11 shows that the shear force applied to the specimen coupon leads to a state of pure shear (τxy = τyx) in the cross section. So, if the material is ductile, the failure plane would be in the plane of maximum shear. However, since graphite is a brittle and porous material and its tensile strength is low, the failure will occur perpendicular to the direction 1 (≡ SG1) where the tensile stresses are maximum. The fracture surface is at an angle of 45° with the cross-sectional plane of the specimen, as shown schematically in Figure 11. So, the brittle failure mode of the specimen at 45° (Figure 9) to the ac section (Figure 1), indicates pure tension failure occurring and the result from Equation 2 is in fact the longitudinal tensile strength of the material. Thus, if the failure is perpendicular to the principal normal stresses the value of shear strength, determined by Iosipescu shear, as in Equation 2, would be approximately the tensile strength determined from standard static tensile tests. Working with a particular polymer composite materials made of epoxy resins and glass microspheres, D´Almeida18 found a
similar fracture pattern for the failure mode tested by Iosipescu ap-paratus, and the equivalence between values for Iosipescu shear stress at failure and tensile strength of the tested material. Brittle failure mode under shear testing was also observed for this material.
All failure models for graphites recognize the key role of pores during initiation of fracture when graphite is stressed10,20,21. Pores in
graphites are mainly in the coke particles or as crack-like porosity which is embedded in binder material. The cracks tend to lie either in regions of well-orientated binder phase material or along the interfaces between the filler particles and the binder. Similarly to other particulate composites, graphite fracture mechanisms and crack development can mainly take part in the matrix or breaking through the particle themselves, or even splitting the interfaces between binder and particles22. It is not easy to determine at each stress level one
specific mechanism is more likely to occur than the other. Moreover,
τmax
τmax
τmax
σ2 σ1
σ1 σ2
τmax A
Plane of fracture
σ2 σ σ
1
τ
τ 1
A
τ
Figure 11. Representation of the failure mode of the HLM grafite associated with the Mohr circle.
A
Mag 704x 30 m
shear stresses can also lead to deformation of pores during testing. In any case fractured graphites surfaces exhibit a coarse microstructure, as it can be seen in shear failure region of Figure 12.
According to Tucker21, crack development occurs by various
means. It starts from pre-existing defects and can propagates by means of crystallite cleavage linking with another pores and other cracks, and by splitting the interfaces between binder and particles or by breaking through the particles themselves, region A seen in Figure 12. As a result subcritical defects form randomly throughout the mate-rial, increasing in size and density as the load is applied until failure occurs. Shear stresses can also induce sliding of basal planes within well-oriented structures developing fracture cleavage of crystallites. Cleavage is more likely to occur in pore-free regions.
Unlike metals and plastics, graphites exhibit the presence of a large number of inhomogeneities, such as cracks and voids, due to their manufactured process. These features causes an appreciable scatter in the maximum failure strength values which is a consequence of the probability to find the critical defect. This critical defect is the one that is the most favourable to crack propagation, and causes failure, as a function of its position in relation to load direction. Defects in materials are randomly distributed and it is necessary to use statistical tools to cope with the variability in properties of these class of materials.
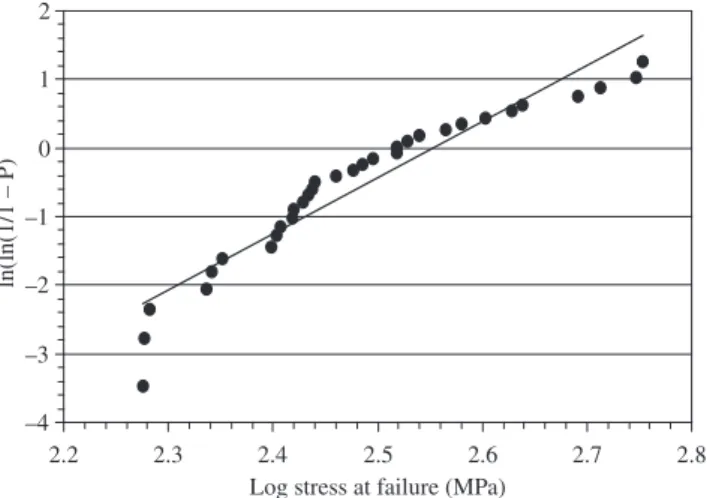
The Weibull distribuition is one of the most used statistical tools for materials that exhibit brittle failure and a probabilistic distribution of defects. Moreover, because it provides a probabilistic description the theory behind the Weibull distribution recognises the inherent variability in graphite strength due to the complexites of its micro-structure. The Weibull plot for HLM graphite calculated from shear data is shown in Figure 13. A sample batch over twenty five gives a consistent Weibull modulus value22. The Weibull modulus “m” found
for maximum shear stress from 32 tested HLM graphite samples was
∼8,5. This value is in between those of glass fibers (m =10) and carbon fibers (m = 5), which are also brittle materials23.
By testing over a hundred samples of HLM graphite having various cross-sections from different batches under flexure loading, Muller24 found a similar value for the Weibull modulus (m = 9) which
is a very close to the result that was found in this work. It is worth to mention that the present work used several samples from the same graphite block, whereas in Muller’s work the samples were taken from regular block production of a certain size, over a time of one year.
4. Conclusion
This work reported an easy shear test used for graphites. The calculated shear strength of HLM graphite was 11.7 MPa. The graphite failure mode showed a 45° crack in between the notch sec-tion. Graphite is nearly macroscopically isotropic and exhibit low strain to failure. Mohr’s circle for the Iosipescu shear coupon shows that principal normal stresses (σ1 = τmax) are laid perpendicular to the fracture surface and, as a consequence, act parallel to the lateral surface of the notches. This situation is caused by a pure normal stress tensile state, and the shear failure test could be used to evaluate the tensile strength of a brittle material. In resume, Iosipescu shear testing is a useful tool to estimate, with a good accuracy, the tensile strength of graphites. Shear fracture surface is coarse and rather jag-ged because the crack propagation has to penetrate into the coarse structure of graphite. Weibull modulus for HLM graphite taken from maximum shear strength values is m = 8.5, which is typical for com-mon ceramic materials.
Acknowledgments
The authors thanks to FAPESP, Proc. Nº 00/04359-3.
References
1. Aurbach D, Teller H, Koltypin M, Levi E. On the behavior of dif-ferent types of graphite anodes. Journal of Power Sources. 2003; 119-121:2-7.
2. Hutcheon JM. Manufacturing Technology of Baked and Graphitized Carbon Bodies. In: Blackman CF, editor. Modern Aspects of Graphite Technology. New York: Academic Press; 1968. p. 49-78.
3. Munjal AK. Test Methods for Determining Design Allowabies for Fiber Rein-forced Composites. In: Chamis CC, Reifsnider KL, editor. Test Methods for Design AIlowables for fiber Composites. ASTM STP 1003. Philadelphia: American Society for Testing and Materials; 1989. p. 93-110.
4. Sullivan JL. The use of Iosipescu specimens. Experimental Mechanics. 1988; 28(3):326-328.
5. Walrath DE, Adams DF. The Iosipescu shear test as applied to composite materials. Experimental Mechanics. 1983, 23(1):105-110.
6. Pierron F, Vautrin A, Harris B. The Iosipescu In-plane Shear Test: Validation on na Isotropic Material. Experimental Mechanics. 1995; 35(2):130-136.
7. Tarnopol´skii YM, Arnautov AK, Kulakov VL. Methods of determina-tion of shear properties of textile composites. Composites-Part A. 1999; 30(7):879-885.
8. Tsotsis TK, Rugg KL, Cox BN. Towards rapid screening of new composite matrix resins. Composites Science and Technology. 2006; 66(11-12):1651-1670.
9. Pindera MJ, Ifju P, Post D. Iosipescu shear characterization of poly-meric and metal matrix composites. Experimental Mechanics. 1990; 30(1):101-108.
10. ASTM C759 – Standard Test Method for Tensile Stress-strain of Carbon and Graphite. American Society for Testing of Materials.
11. ASTM D5379M-98 – Standard Test Method for Shear Properties of Composite Materials by the V-Notched Beam Method. American Society for Testing of Materials.
12. Iosipescu N. New Accurate Procedure for Single Shear Testing of Metals. Journal of Materials. 1967; 2(3):537-566.
13. Weibull W. A statistical distribution function of wide applicability. Journal of Applied Mechanics-Transtions of the ASME. 1951; 18(3):293-297.
14. Forest RA, Marsh H. Reflection Interference Colours in Optical Micro-scopy of Carbon. Carbon. 1977; 15(5):349-350.
15. Mantel CL. Carbon and Graphite Handbook. New York: Interscience Publisher; 1968.
–4 –3 –2 –1 0 1 2
Log stress at failure (MPa)
ln(ln(1/1 – P)
2.3
2.2 2.4 2.5 2.6 2.7 2.8
16. Taylor R, Brown RG, Gilchrist K, Hall E, Hodds AT, Kelly BT, Morris F. The mechanical properties of reactor graphite. Carbon. 1967; 5(5):519-531.
17. Behanm PP, Crawford RJ. Mechanics of Engineering Materials. London: Longman Scientific & Technical; 1987.
18. D’Almeida JRM, Monteiro SN. The Iosipescu test method as a method to evaluate the tensile strength of brittle materials. Polymer Testing. 1999; 18:407-408.
19. Blocklehrst JE. Fracture in polycrystalline graphite. In: Walker PL, Thrower Jr PA, editor. Chemistry and Physics of Carbon. Vol. 13. New York: Marcel Dekker; l975. p. 145-279.
20. Pickup IM, McEnaney B, Cooke RG. Fracture processes in graphite and the effects of oxidation. Carbon. 1986; 24(5):535-543.
21. Tucker MO, Rose APG, Burchell TD. The Fracture of Polygranular Graphites. Carbon. 1986; 24(5):581-602.
22. van der Zwaag S. The concept of filament strength and the Weibull modulus. Journal of Testing Evaluation. 1989; 17(5):292-298.
23. Hull D, Clyne TW, editor. An Introduction to Composite Materials. Cambridge: Cambridge University Press; 1996.