*e-mail: [email protected]
Infrared and Chemical Characterization of
Natural Amethysts and Prasiolites Colored by Irradiation
Fernando Soares Lameirasa*, Eduardo Henrique Martins Nunesb, Wander Luiz Vasconcelosc
a
Centro de Desenvolvimento da Tecnologia Nuclear – CDTN (Nuclear Materials),
31270-901 Belo Horizonte - MG, Brazil
b
Lamil Lage Minérios Ltda. (Development), 35660-970 Pará de Minas - MG, Brazil
c
Departamento de Engenharia Metalúrgica e de Materais,
Universidade Federal de Minas Gerais,
30160-030 Belo Horizonte - MG, Brazil
Received: December 23, 2008; Revised: May 8, 2009
The infrared bands of amethyst and prasiolite samples from different origins were correlated to the trace elements contents. Amethysts have an iron content greater than 20 ppm and a low content of sodium and potassium. Prasiolites have an aluminum content greater than 120 ppm and a higher overall trace elements content, which accounts for a strong absorption between 3200 and 3600 cm–1. Colorless samples of quartz that become amethysts
and prasiolites after irradiation have infrared spectra at room temperature with a broad band at 3441 cm–1 and a
sharp band at 3595 cm–1. The broad band splits in several bands at low temperatures that are related to Al Si and
FeSi. The color of amethysts and prasiolites are assigned to [AlSiO4/h+]0 and [Fe
SiO4/h+]0 centers formed by the
exposure to ionizing irradiation and to the influence of lattice distortions due to the content of iron as a substitute for silicon and a high content of trace elements of large ionic radius like potassium.
Keywords: amethyst, prasiolite, infrared spectrum, irradiation, trace elements
1. Introduction
Amethyst is a violet variety and prasiolite is a green variety of natural quartz. They are appreciated as gemstones. These colors can be bleached by heating or exposure to intense ultraviolet radiation. The heating of amethyst and prasiolite may also produce yellow colors. Some occurrences of natural colorless quartz may be transformed in amethyst or prasiolite by exposure to high energy ionizing radiation (e. g., gamma rays, X-rays, or electron beam). They are routinely exposed to ionizing radiation to produce amethyst and prasiolite for jewelry. This is a well-established economic activity in the states of Minas Gerais and Rio Grande do Sul in Brazil. The understanding of the color formation mechanism is necessary for the control of the extraction and irradiation of natural colorless quartz to produce amethyst and prasiolite.
The causes of color of amethyst have been investigated since 18991. The violet color have been explained in association with trace
elements in small inclusions in the quartz matrix, or as substitutes for silicon, or in interstitial positions in the quartz crystal lattice, and to the exposure of quartz to natural ionizing irradiation2,3,4,5.
Synthetic amethyst and prasiolite samples were grown in auto-claves in aqueous medium with alkaline and iron ions6. Aluminum
and iron are the trace elements usually assigned as substitutes for silicon in the quartz lattice. Since Al3+ or Fe3+ replace Si4+ in the
center of a SiO4 tetrahedron (designated as AlSi3+ or Fe Si3+), the
charge deficiency requires an interstitial positive monovalent ion in the vicinity to neutralize the electric charge. H+, Li+, and Na+ are
usually considered as charge compensators7-14. Interstitial Fe3+ was
also proposed as charge compensator for FeSi3+[3]. The formation of
Fe2O3 microinclusions and the presence of oxygen vacancies were also used to explain the formation of yellow colors after the heating
of some amethysts15. These [Al
SiO4/M+]0 or [FeSiO4/M+]0 centers (M+ is
the charge compensator) are supposed to have a relation to the color formation in quartz by exposure to irradiation and heat. The relation of [AlSiO4/h+]0 center to smoky quartz is well accepted in the literature
(h+ is an electron hole). This center is also noted as [AlO 4]0.
The infrared spectrum of natural colorless quartz between 2400 and 4000 cm–1 is correlated to the potential of color development
by irradiation and heating16,17. Bands related to hydroxyl between
3200 and 3600 cm–1 are influenced by the trace elements. The bands
at room temperature at 3381, 3433, and 3483 cm–1 are respectively
related to AlSi-OH, AlSi-OH/Na+, and Al
Si-OH/Li+ 8,11,18. Colorless
samples that produce amethyst and prasiolite after irradiation show at room temperature a broad band at 3441 cm–1 and a sharp band
at 3585 cm–1. The nature of these bands is not yet resolved.
Prasiolite usually occurs in nature in geodes, like amethyst. It is common to find both prasiolite and amethyst in the same place. The irradiation of colorless quartz may also produce prasiolite and amethyst. Due to these similarities, prasiolite is occasionally designated as “green amethyst”. The infrared spectra also support the similarities between these quartz.
This paper presents comparative results of the characterization of amethyst and prasiolite in order to establish the differences between these varieties of quartz and to discuss the nature of the infrared bands between 3200 and 3600 cm–1.
2. Experimental
Lameiras et al.
Materials Resear
ch
Table 1. Trace elements contents (ppm) of amethysts and prasiolites.
Al Co Cr Fe K
Li
Mn Na Ni TiV
Amethyst-Felício dos Santos, Minas Gerais, Brazil 104.00 <2.00 <4.00 30.00 <10.00
4.55
3.53 30.90 <4.00 7.00<1.00
Amethyst-Espírito Santo, Brazil 93.60 <2.00 <4.00 136.30
12.90
13.40 2.36 <5.00 <4.00 4.71<1.00
Amethyst-Brumado, Bahia, Brazil <10.00 <2.00 <4.00 28.70
20.90
0.68 2.45 33.60 <4.00 <1.00<1.00
Amethyst-Santa Maria, Rio Grande do Sul,Brazil 13.10 <2.00 <4.00 132.10
36.30
4.46 2.63 45.30 <4.00 1.38<1.00
Amethyst-Brejinho das Ametistas, Bahia, Brazil 11.80 <2.00 <4.00 51.10
29.50
3.40 2.68 19.50 <4.00 <1.00<1.00
Amethyst-Nova Era, Minas Gerais, Brazil 108.60 <2.00 <4.00 50.60
20.30
18.90 2.58 32.60 <4.00 <1.00<1.00
Prasiolite-Marabá, Pará, Brazil 171.70 <2.00 <4.00 <3.00
67.50
5.13 2.56 46.80 <4.00 1.83<1.00
Prasiolite-Montezuma, Minas Gerais, Brazil 155.60 <2.00 <4.00 3.21
30.00
4.77 2.56 86.40 <4.00 1.74<1.00
Prasiolite-Santa Cruz, Bolívia 137.80 <2.00 <4.00 16.80
50.20
9.14 2.62 48.20 <4.00 2.78<1.00
Prasiolite-Uberlândia, Minas Gerais, Brazil 224.20 <2.00 <4.00 13.80
93.10
11.20 2.52 113.20 <4.00 <1.00<1.00
Prasiolite-Tocantins, Brazil 313.40 <2.00 <4.00 9.65
153.50
6.86 2.67 175.50 <4.00 <1.00<1.00
Table 2. Low temperature infrared bands of amethysts and prasiolites after heating to complete bleaching of the color. Band at (cm–1) Amethyst
Felício dos Santos
Amethyst Espírito Santo
Amethyst Brumado
Amethyst Santa Maria
Amethyst Brejinho das Ametistas
Amethyst Nova Era
Prasiolite Marabá
Prasiolite Montezuma
Prasiolite Bolívia
Prasiolite Uberlândia
Prasiolite Tocantins
3593.6 to 3598.9 X O X X ? X X X X X X
3579.1 to 3580.5 X X X X ? X X X X X X
3437.3 to 3440.2 X X X X X X X X X X X
3395.4 to 3415.2 X X X X X X X X X X X
3365.5 to 3367.4 O O O O O X O O X X O
3351.5 to 3354.4 X X X X O X O O O O O
3296.5 to 3308.6 X X X O X X O O O O O
3223.3 to 3232.4 X X X O X X O O O O O
2686.6 to 2691.9 X X X X X X X X X X X
2607 to 2612.8 X X X X X X X X X X X
2509 to 2513.5 X X X X X X X X X X
X
emission spectrometry using a Perkin Elmer spectrometer model ICP Optima 3000. The samples were sonicated in distilled and deion-ized water for surface cleaning. After drying in air, the samples were heated to 973 K and quenched in cold water to promote their fracture to help the grinding. This step is also important to crackle the fluid inclusions and to promote their leaching to the aqueous medium19.
The grinding to a fine granulometry was performed in a mortar with a pestle, both made of high purity quartz. The powder was sonicated in distilled and deionized water and filtered in a Büchner vacuum funnel. The solubilization was performed in a polytetrafluoroethylene beaker with fluoridric, chloridric, and perchloric acids. The solution was dried at 373 K. This procedure was repeated three times. Then sulfuric and chloridric acids were added and dried at 373 K. The residue in the beaker was transferred to a volumetric flask with chloridric acid and distilled and deionized water. The trace contents were measured in two samples to verify the possibility of contamination and errors in the procedure above described. The trace contents were calculated accord-ing to Guzzo20. Fractions of the samples were ground and analyzed
by X-ray powder diffraction to assure that all samples were quartz crystals. The diffractograms were taken using a Philips®-PANalytical
model PW-1710 (scan speed of 0,060 degrees per second).
Thin sheets about 1 × 1 cm and 1 mm thickness were cut from the samples with a low speed rim diamond wafering blade, with the c axis perpendicular to the square faces. The sheets were ground and polished on both sides up to the diamond paste of 1 µm. They were heated in air up to 723 K until the complete bleaching of the colors.
The irradiation of the colorless sheets was performed in a Cobalt®-60 Nordion GB-127 panoramic dry gamma irradiator up
to a dosis of 600 kGy. The temperature in the irradiation room was about 300 K. The dose rate was not controlled, but it varied from 0.5 to 20 kGy/hour.
Infrared absorption spectra of the sheets were measured using an ABB Bomem spectrometer model MB 102 (spectral range from 400 to 4000 cm–1, 128 scans, and a resolution of 1 cm–1). Both room
and low temperature spectra were measured. Since the bands are higher and thinner in the low temperature spectrum21, the observation
of details not visible at room temperature is possible at low tempera-ture. The low temperature measurements were performed with the same spectrometer and a variable temperature cell (88 to 298 K) from Specac with NaCl windows and liquid nitrogen under low pressure (about 1.3 Pa).
Infrared spectra of samples of colorless quartz that become black after irradiation and greenish yellow to brown after heating or grayish olive green after irradiation and olive green after heating were also measured.
3. Results and Discussion
The X-ray diffraction revealed that all samples were high purity alpha quartz (content higher than 98%).
Table 1 shows the trace contents in the samples. The main trace elements are, as expected, aluminum, iron, lithium, sodium, and potas-sium7-14,22. The hydrogen content could not be measured. Amethysts
have higher contents of iron (>20 ppm) and lower contents of sodium plus potassium, whereas prasiolites have higher contents of aluminum (>120 ppm) and sodium plus potassium.
A background of infrared absorption that rises, falls, or is constant for wavenumbers above 3000 cm–1 was observed. It was
attributed to internal turbidity of the samples for the rising back-ground22 or to micro inclusions. Many samples show a noise between
3600 and 4000 cm–1 that was also attributed to micro inclusions. The
Table 2 shows the bands observed in the infrared spectrum at low temperature. The position of these bands may vary within 10-20 cm–1.
The last three bands are present in all samples of quartz. They were used to normalize the spectra by considering the absorption in one of them equal to 1 (the band at around 2690 cm–1 was chosen). A
third order polynomial was fitted to the baseline in the range of 4100 to 5300 cm–1, where no bands are observed, and subtracted
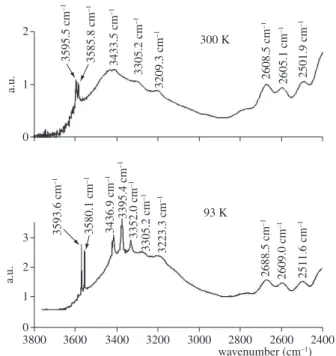
Figure 1. Infrared spectra at 300 and 93 K of the amethyst from Brumado,
Bahia, Brazil after heating to colorless state.
from the normalized spectra. The spectra presented in the following were obtained according to this procedure.
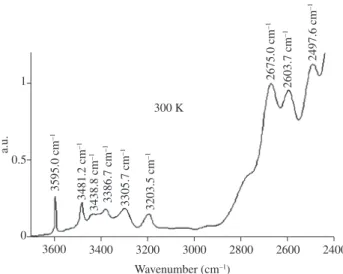
Figures 1 and 2 show typical infrared spectra of the samples measured at room and at low temperature. The prasiolites show a stronger absorption between 3200 to 3600 cm–1. At low temperature
the bands in this range appear decomposed in different bands. Only the amethyst sample from Espírito Santo didn’t show the band at 3593.6 to 3598.9 cm–1. This sample has the lowest
so-dium and potassium content. The band at 3437.3 to 3440.2 cm–1 is
attributed to AlSi-OH/Na, and the bands at 3365.5 to 3367.4 cm–1 and
3296.5 to 3308.6 cm–1 are attributed to Al
Si-OH. The bands at 3579.1 to
3580.5 cm–1, 3395.4 to 3415.2 cm–1, and 3351.5 to 3354.4 cm–1 are
probably related to iron. The band at 3593.6 to 3598.9 cm–1 may
also be observed in samples of colorless quartz that become smoky or black after irradiation and greenish yellow to brown after heating (Figure 3). The bands related to AlSi-OH/Li, AlSi-OH/Na, or AlSi-OH are observed in these samples, but the bands attributed to iron are not observed. This band is probably related to AlSi-OH/K or AlSi-OH/Na. It is apparently not correlated to the development of colors after ir-radiation. Karampelas at al.23 proposed that this band can be used to
help the distinguishing of natural from synthetic amethyst, because it is present in most natural but absent in most synthetic amethyst, but they didn’t discuss its nature.
Figure 4 shows the infrared spectra before and after ir-radiation. One observes a decrease of the absorption between 3200 and 3600 cm–1, which is probably related to the dissociation of
AlSi-OH and FeSi-OH centers. The amethysts recovered their original colors and the prasiolites become smoky green after irradiation. The smoky color of the prasiolites can be bleached by short exposition to ultraviolet rays, so that the original color can be obtained.
Smoky quartz is explained by the interaction of [AlSiO4/M+]0
centers with the radiation (M+ is the charge compensator, H+, Li+, or
Na+). These centers are dissociated according to
[AlSiO4/M+]0→ [Al
SiO4/h+]0 + M+ + e (1)
where h+ is an electron hole24. The [Al
SiO4/h+]0 center is
respon-sible for the formation of the smoky quartz. After the dissociation of the [AlSiO4/M+]0 the M+ is free to diffuse in the crystal lattice of
quartz. The bands related to [AlSiO4/H+]0 show a small decrease after
irradiation, because the H+ has a high mobility in the quartz lattice.
It may diffuse away very fast from the [AlSiO4/h+]0 center, but may
also meet another [AlSiO4/h+]0 center so that the [Al
SiO4/H+]0 is formed
again with a high frequency. The bands related to [AlSiO4/Na+]0 also
show a small decrease after irradiation, because the Na+ has a low
mobility in the quartz lattice. It remains near the [AlSiO4/h+]0 center
so that the [AlSiO4/Na+]0 is formed again with a high frequency. Only
the band related to [AlSiO4/Li+]0 decreases after irradiation, because
lithium has a moderate mobility in the quartz lattice. It may diffuse to an intermediate distance from the [AlSiO4/h+]0 center, so that the
formation of [AlSiO4/Li+]0 is a less probable event. The same processes
should work in the case of iron as a substitute for silicon in the quartz lattice, so that the reaction
[FeSiO4/M+]0→ [Fe
SiO4/h+]0 + M+ + e (2)
should also takes place under irradiation. Potassium can also work as a charge compensator with a very low mobility due to its large ionic radius. Considering that the band related to [AlSiO4/Li+]0 was
not observed in the samples, it is expected that the absorption in the infrared spectra should show, as observed, a nearly uniform decrease after irradiation, due to the formation of [AlSiO4/h+]0 and [FeSiO
4/h+]0
centers. The [FeSiO4/h+]0 is probably responsible for the formation of
the violet color in amethyst and a high concentration of [AlSiO4/h+]0
should play a role in the formation of the green color of prasiolite. Lattice distortions may also contribute for the formation of color. They are expected if an iron atom replaces a silicon one. The ionic radius of the iron is large enough to cause distortions in the tetrahedral configuration of the quartz lattice. The iron also has an electronic configuration very different from the one of silicon. Its outer electrons are 3d64s2, whereas the aluminum outer electrons are 3s22p1, like the
silicon ones, 3s22p2. This difference causes additional distortions in
the lattice in the vicinity of an iron atom, because the tetrahedral configuration causes crystal field splitting of the 3d-orbitals of iron into two groups, with a lower energy splitting difference, which accounts for absorption of light by the [FeSiO4/h+]0 center in longer
wavelengths in comparison to the [AlSiO4/h+]0 center. The large ionic
radius of potassium should also cause lattice distortions. The result Figure 3 . Infrared spectrum at 300 K of a colorless sample of quartz from São José da Safira, Minas Gerais, Brazil that becomes smoky or black after irradiation and greenish yellow to brown after heating.
Figure 4. Infrared spectra at 93 K of a) amethyst from Brumado, Bahia,
is an overall shift of light absorption to longer wavelengths, which result in the violet or green colors instead of a smoky color.
There are samples of quartz that become smoky olive green after irradiation and olive green after heating. These samples have the spectrum shown in Figure 5. One notices a band at 3392.5 cm–1
(at-tributed to iron), a band at 3473.5 cm–1 (attributed to Al-OH/Li), and
bands at 3504 and 3515.9 cm–1. The bands at 3595 cm–1 is observed,
but the band at 3579.1 to 3580.5 cm–1 is not observed. The band at
3395.4 to 3415.2 cm–1 is observed in the amethysts and prasiolies,
but the bands at 3473.5, 3504 and 3515.9 cm–1 are not observed. The
bands at 3504 and 3515.9 cm–1, like the band at 3473.5 cm–1 (related
to Al-OH/Li), decrease after irradiation, probably because they are related to Fe-OH/Li. The band at 3392.5 cm–1 may be related to Fe-OH
or Fe-OH/Na. Due to these characteristics of both the amethyst and the greenish yellow to brown quartz, we name this kind of quartz “heminefite”, from the greek “hemo” (half) and “nepho” (sober), that means “the stone of the one that is half sober”. Amethyst in ancient greek means “the stone of the one that is sober”. Table3 summarizes the relations of the infrared bands.
4. Conclusions
The amethyst samples have a content of iron greater than 20 ppm and low contents of sodium and potassium. The prasiolites samples have a content of aluminum greater than 120 ppm and a high contents sodium and potassium. The overall content of trace elements is higher in the prasiolite samples.
Colorless samples of natural quartz that become amethyst and prasiolite after irradiation have infrared spectra at room temperature with a broad band at around 3441 cm–1 and a band at 3585 cm–1.
The samples that become prasiolites show a strong absorption between 3200 and 3600 cm–1, which may be related to their higher
content of trace elements. The broad band at around 3441 cm–1
ap-pears decomposed in several bands at low temperature. Some of them are bands related to Al-OH/Na (3437.3 to 3440.2 cm–1) and
Al-OH (3365.5 to 3367.4 cm–1) reported in the literature. The band
at 3593.6 to 3598.9 cm–1 is usually observed in samples that show
only bands related to Al-OH, Al-OH/Li, and Al-OH/Na. This band is also probably related to aluminum. The other bands respectively at 3395.4 to 3415.2 cm–1 and 3351.5 to 3354.4 cm–1 are probably
related to iron.
The irradiation decreases the absorption between 3200 and 3600 cm–1 in a nearly uniform way. This is expected due to the absence
of an Al-OH/Li band in the infrared spectrum of the colorless samples than become amethysts or prasiolite after irradiation.
Heminefites show bands related to Al-OH/Li, Al-OH/Na, and Al-OH together with bands at 3515.9, 3504.4, and 3392.5 cm–1. The
bands at 3515.9 and 3504.4 cm–1 are not observed in the amethyst and
prasiolite samples. They are probably related to Fe-OH/Li, so that the band at 3392.5 cm–1 is probably related to Fe-OH or Fe-OH/Na.
The color of amethysts and prasiolites are the result of the forma-tion of [AlSiO4/h+]0 and [Fe
SiO4/h+]0 centers formed by the exposure
to ionizing irradiation and the influence of lattice distortions caused by the iron as a substitute for silicon and a high content of trace ele-ments of large ionic radius like potassium.
Acknowledgements
To CNPq (Project number 305811/2006-1) and FAPEMIG (Project number APQ-7097-5.07/07).
References
1. Nabl A. The coloring constituents of amethyst, citrine, and burnt amethyst. Sitzungberichte der Akademie der Wissenschaften Wien Math.-naturw. Cl. 1899; 108(2):48–57.
2. Lehmann G, Moore WJ. Color center in amethyst quartz. Science. 1966; 152(3725):1061-1062.
3. Lehmann G. Yellow color centers in natural and synthetic quartz. Zeitschrift für Physik B Condensed Matter. 1971; 13(4):297-306. 4. Cohen AJ, Makar LN. Models for color centers in smoky quartz. Physica
Status Solidi (a). 1982; 73(2):593-596.
5. Partlow DP, Cohen AJ. Optical studies of biaxial Al-related color centers in smoky quartz. American Mineralogist. 1986; 71(3-4):589-598. 6. Gunnarsson CFGA. Distinguishing between natural and synthetic quartz.
[Master thesis]. Luleå: Luleå University of Technology; 2008. 7. Bahadur H. Infrared characterization of natural and cultured quartz: the
effect of electrodiffusion and irradiation. Journal of Applied Physics. 1989; 66(10):4973-4982.
8. Bahadur H. Hydroxyls defects and electrodiffusion (sweeping) in natural quartz crystals. Journal of Applied Physics. 1993; 73(11):7790-7797. 9. Bahadur H. Sweeping and irradiation effects on hydroxyls defects
in crystalline natural quartz. IEEE Transactions on Ultrasonics, Ferroelectrics, and Frequency Control. 1994; 41(6):820-833.
10. Bahadur H. Sweeping investigations on as grown Al-Li+ and Al-OH centers in natural crystalline quartz. IEEE Transactions on Ultrasonics, Ferroelectrics, and Frequency Control. 1995; 42(2):153-158.
11. Guzzo PL, Iwasaki F, Iwasaki H. Al-related centers in relation to
γ-irradiation. Response in natural quartz. Physics and Chemistry of Minerals. 1997; 24(4):254-263.
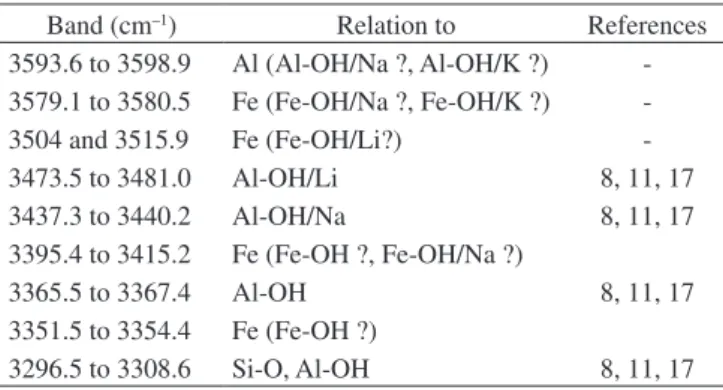
Table 3. Bands observed in the infrared spectrum of natural quartz. Band (cm–1) Relation to References
3593.6 to 3598.9 Al (Al-OH/Na ?, Al-OH/K ?) -3579.1 to 3580.5 Fe (Fe-OH/Na ?, Fe-OH/K ?)
-3504 and 3515.9 Fe (Fe-OH/Li?)
-3473.5 to 3481.0 Al-OH/Li 8, 11, 17 3437.3 to 3440.2 Al-OH/Na 8, 11, 17 3395.4 to 3415.2 Fe (Fe-OH ?, Fe-OH/Na ?)
3365.5 to 3367.4 Al-OH 8, 11, 17
3351.5 to 3354.4 Fe (Fe-OH ?)
3296.5 to 3308.6 Si-O, Al-OH 8, 11, 17 Figure 5. Infrared spectrum at 93 K of a sample of quartz from Marabá,
12. Bachheimer JP. An investigation into hydrogen stability in synthetic, natural and air-swept synthetic quartz in air temperatures up to 1100 °C. Journal of Physics and Chemistry of Solids. 1998; 49(5):831-840. 13. Bahadur H. Radiation-induced modifications of point defects in
quartz crystals and their application in radiation dosimetry. Radiation Measurements. 2003; 36(1-6):493-497.
14. Bahadur H. Radiation induced modification of impurity-related point defects in crystalline quartz: a review. Crystal Research and Technology. 2006; 41(7):631-635.
15. Dotto CT, Osotani S. Irradiation and heating effects in amethyst crystals from Brazil. Radiation Effects and Defects in Solids. 1991; 117(4):355-361. 16. Nunes EHM, Lameiras FS. The optical absorption of gamma irradiated and
heat-treated natural quartz. Materials Research. 2005; 8(3):305-308. 17. Lameiras FS, Nunes EHM, Melo VAR, Liz OR. Identificação de
quartzos incolores para joalheria. REM: Revista Escola de Minas. 2006; 59(1):129-133.
18. Martin JJ. Electrodiffusion (sweeping) of ions in quartz: a review. IEEE Transactions on Ultrasonics, Ferroelectrics, and Frequency Control. 1988; 135(3):288-296.
19. Pasquali MA, Iwasaki H, Suzuki CK. Metodologia aplicada à separação de diferentes estados de impureza no quartzo. In: IX Congresso Brasileiro
de Engenharia e Ciência dos Materiais; Águas de São Pedro: CNEN/
SP-IPEN e UFSCAR; 1990. p. 652-655.
20. Guzzo PL. Caracterização de impurezas estruturais e de centros de defeitos relacionados ao A1 e OH no quartzo natural. [Máster thesis]. Campinas: Universidade Estadual de Campinas; 1992.
21. Fitzgerald SA, Churchill HOH, Korngut PM, Simmons CB, Strangas YE. Low-temperature infrared spectroscopy of H-2 in crystalline C-60. Physical Review B. 2006; 73(15):155409-1 – 155409-7.
22. Hebert LB, Rossmann GR. Greenish quartz from the Thunder Bay amethyst mine panorama, Thunder Bay, Ontario, Canada. The Canadian Mineralogist. 2008; 46(1):61-74.
23. Karampelas S, Fritsch E, Zorba T, Paraskevopoulos KM, Sklavounos S. Distinguishing natural from synthetic amethyst: the presence and shape of the 3595 cm-1 peak. Mineralogy and Petrology. 2005; 85(1-2):45-52. 24. Itoh N, Stoneham D, Stoneham AM. Ionic and electronic processes in