UNIFORMIZATION OF FRONTIERS IN NON-RADIAL ZSG-DEA MODELS: AN APPLICATION TO AIRPORT REVENUES
Aline Bandeira de Mello Fonseca Mestrado em Engenharia de Produção Universidade Federal Fluminense (UFF) Niterói – RJ
João Carlos Correia Baptista Soares de Mello* Departamento de Engenharia de Produção
Universidade Federal Fluminense (UFF) Niterói – RJ
Eliane Gonçalves Gomes
Empresa Brasileira de Pesquisa Agropecuária (Embrapa) Brasília – DF
Lidia Angulo Meza
Departamento de Engenharia de Produção Universidade Federal Fluminense (UFF) Volta Redonda – RJ
* Corresponding author / autor para quem as correspondências devem ser encaminhadas
Recebido em 10/2008; aceito em 07/2009 após 1 revisão Received October 2008; accepted July 2009 after one revision
Abstract
We propose in this paper an extension to the Zero Sum Gains Data Envelopment Analysis model (ZSG-DEA). The proposed approach takes into account, simultaneously, non-radial projections and cone-ratio weights restrictions. We developed an iterative approximate algorithm to solve this model, as in the case study it is oriented only to the constant sum output. The theoretical approach is applied to the concession of discounts and surcharges problem, in terms of airport fees.
Keywords: DEA; zero sum gains; non-radial projections; airport fees.
Resumo
É proposta neste artigo uma extensão do modelo de Análise de Envoltória de Dados com Ganhos de Soma Zero (DEA-GSZ). Esta extensão considera simultaneamente projeções não radiais e restrições do tipo cone-ratio. Mostra-se necessário para a resolução do modelo proposto, o uso de um algoritmo iterativo aproximado. Isto se deve ao fato de o modelo ser orientado a somente um dos outputs, o de soma constante. O modelo teórico desenvolvido é exemplificado a um problema de concessão de descontos e sobretaxas em tarifas aeroportuárias.
1. Introduction
One of the most studied applications for measurements obtained using DEA is the distribution or redistribution of resources. Research in this area has been conducted, for example, by Yan et al. (2002), Beasley (2003), Korhonen & Syrjänen (2004), Lozano & Villa (2004, 2005), Soares de Mello et al. (2006), Gomes et al. (2007), Fang & Zhang (2008), Haidi-Vencheh et al. (2008) and Asmild et al. (2009).
In the past few years, DEA models have been developed following the concept that resources are limited and, therefore, in order to attribute more resources to a DMU one needs to remove them from another. These models seek to obtain a frontier with the maximum number of efficient DMUs (ideally all should be efficient).
One of these models parameterizes a final frontier that is obtained when all DMUs are efficient. Avellar et al. (2005, 2007) and Guedes et al. (2009) arbitrated a spherical form for this frontier. The Spherical Frontier DEA Model, as it is called, deals with the distribution of both new and existing resources.
Another class of models solve problems of the same type without the need to choose a function for the frontier. This type of model was primarily applied in cases where the production of the DMUs was not independent. It was first developed to establish Olympic
medal goals at the Sydney Olympic Games (Lins et al., 2003) and is named Zero Sum Gains
DEA model (ZSG-DEA). Initially, the condition for zero sum gains was only applied to the
DEA BCC model, proposed by Banker et al. (1984).
Gomes et al. (2003) have adapted the ZSG-DEA model to the uniformization of the frontier
with a redistribution of outputs. For this they have used a modelling of iso-efficiency layers (Barr et al., 2000; Gomes et al., 2009b). Gomes et al. (2004) used the ZSG-DEA model for a redistribution of outputs and inputs with the uniformization of the frontier in a different way: instead of reducing the production and preserving the resources of initially efficient DMUs, they forced them to diminish outputs as well as reduce inputs. In order to solve the mathematical problem of determining one equation for each facet of the frontier, they used the smoothed frontier developed by Soares de Mello et al. (2002, 2004) and Nacif et al. (2009).
Gomes et al. (2005) extended the use of ZGS-DEA models to constant returns to scale
(Charnes et al., 1978), still with the redistribution of inputs. Gomes & Lins (2008), apply the uniformization of frontier techniques in the ZGS-DEA model to the distribution of an undesirable output, modelled as an input, in a case of environmental interest.
In radial projection cases, the uniformization does not represent major problems given that theorems already exist, which guarantee the methods in use – as stated in the articles mentioned hereabove. In case there are any restrictions in relation to weight, the success of the uniformization will depend on the validity of a conjecture formulated by Gomes (2003). Although it has not yet been demonstrated, this conjecture has been valid in previous case studies.
only conducted in an empirical form, not concerning itself with the theoretical foundations of the method for the moment.
The result of the approach developed here is applied to a case of establishing fee criteria at airports. The modelling of this problem requires ZSG-DEA models with weights restrictions and non-controlled variables. Given the lack of data, due to the natural state of secrecy of commercial airliners, a simulation was made in order to exemplify the problem. This simulation makes use of fictitious companies and is based on the average values of real companies from a few years back, so as to avoid confusion between our results and the real values of airline companies.
2. Zero Sum Gains DEA Models
2.1 General Concepts and Radial Projections
The classic DEA models, both the CCR model and the BCC model, in all their variants, assume total freedom of production. This means that the production of one DMU does not interfere with the production of the others. However, in some cases this freedom does not exist. In the case of competition, for example, if one considers as output the final result or an index that aggregates its results (Lins et al., 2003; Villa & Lozano, 2004), a gain of position for any competitor implies a loss of position for one or more of its adversaries.
To deal with this type of situation, the so-called Zero Sum Gains DEA models (ZSG-DEA) were proposed. These represent a situation similar to that of a zero sum game, in which all that is gained by one player is lost by the other(s) (Gomes, 2003; Gomes et al., 2003, 2004, 2005; Lins et al., 2003; Gomes & Lins, 2008). In other words, the net sum of gains must be zero. In contrast to what occurs in traditional models, the way in which a DMU reaches its target on the frontier can result in the alteration of the shape of the efficient frontier. In Lins
et al. (2003) the authors propose strategies for the radial search of targets, highlighting the proportional reduction strategy. Applications of the ZSG-DEA model, other than those presented in the previously cited articles, can be seen in Gomes et al. (2007, 2008), Gomes & Soares Mello (2009), Hu & Fang (2010).
In the proportional strategy, the DMU that seeks efficiency (seeks the frontier) needs to gain certain units of output (or lose input). So that the sum remains constant, other DMUs must lose (or gain) in proportion to their levels of output (input). In this way, whichever has the lowest level of output (input) loses (gains) less; whichever has the highest level of output (input) loses (gains) more.
It may occur that more than one DMU will seek to maximise efficiency, which can be done in competition or cooperation. The most interesting case in ZSG modelling is that in which inefficient DMUs form a cooperation group. In the ZSG-DEA paradigm, the search for cooperation means that DMUs from this group try to allocate a certain amount of input (or to remove an amount of output) only to the DMUs that do not belong to this group.
In a general case of multiple inefficient DMUs operating in a cooperation regime, the
ZSG-DEA model is a Multi-objective Nonlinear Programming Problem (Gomes et al.,
in cooperation in the search for targets with proportional strategy, the efficiencies of the DMUs in the ZSG-DEA model are directly proportional to their efficiencies in the classic DEA model.
In a case where all the inefficient DMUs form a single cooperation group and seek efficiency in the classic DEA efficiency frontier, the application of the ZSG-DEA model brings about the redistribution of input or of the constant sum output. After this redistribution, all DMUs will belong to the efficient frontier; in other words, all will be 100% efficient.
This new DEA frontier, referred to here as the uniform DEA frontier or maximum efficiency frontier, is located at lower levels than the those of the classic DEA model, as efficient DMUs gain input units (or lose output units) to compensate the loss (or gain) of inefficient units, so as to maintain a constant sum. This situation of uniform efficiency can be seen as desirable by regulatory agencies, since what will be presented to the decision-maker is a distribution of resources (or products) that makes all units 100% efficient. This is the approach followed by Gomes & Lins (2008).
In order to build a uniform frontier directly, in which inefficient DMUs form one single group of cooperation W, Gomes et al. (2003) demonstrated the Target Determination Theorem, which was used by Gomes & Lins (2008). This theorem states that the target of the DMU under analysis in the ZSG-DEA model with proportional strategy is equal to the target in the classic case multiplied by the reduction coefficient. This theorem, together with the Proportional Efficiencies in the Proportional Strategies Theorem, allows us to reduce the solution to the Nonlinear Programming Problem to one single nonlinear equation. For the CCR and BCC models, with input orientation, we have equation (1), where hRo and ho are, respectively,
the measurements of efficiency in the ZSG-DEA and classic DEA models for DMU o;
W is the group of DMUs (j) in cooperation; roj=ho I− hj I− is the factor of proportionality resulting from employing the proportional strategy, with input orientation. Equation (2) is valid for output oriented models, in which qoj =ho O− hj O− is the proportionality factor.
(
1)
1
j oj Ro
j W
Ro o
j j W
x r h
h h x ∈ ∉ ⎛ ⎡⎣ − ⎤⎦⎞ ⎜ ⎟ = ⎜ + ⎟ ⎜ ⎟ ⎝ ⎠
∑
∑
(1)(
1)
1
j oj Ro j W
Ro o
j j W
y q h
h h y ∈ ∉ ⎛ ⎡⎣ − ⎤⎦⎞ ⎜ ⎟ = ⎜ − ⎟ ⎜ ⎟ ⎝ ⎠
∑
∑
(2)2.2 Non-Radial Projections
The ZSG-DEA models presented so far impose the constant sum restriction only to the output or to the single input of the model, or to all of the outputs or inputs of constant sum. These are radial models, namely, they consider the proportional reduction or increase of inputs or of outputs, and do not assume simultaneous alterations.
the projections are not radial, in other words, the variations of inputs and outputs are not proportional. There follows a description of how to treat ZSG-DEA in such a situation.
Take a ZSG-DEA problem modelled with i=1...r inputs and k=1...s outputs, in which
only the output f is of constant sum. The remaining variables are not restricted, as in the classic DEA models. For an output-oriented model, the zero sum gains ‘game’ will be valid only for the output f. As there will be no redistribution or relocation of the other outputs present in the model, these can be assumed as analogous to the non-controllable variables (Cooper et al., 2000).
Equation (3) presents the non-radial CCR ZSG-DEA model, output oriented, in which the efficiency is measured only by the alteration of one of the outputs (namely, of which a constant sum is imposed). In this model hRo is the inverse of the efficiency of the DMU o;
ji
x and yjk are the values of inputs i and outputs k of the DMUs j, respectively; λj
represents the contribution of the DMUs j in the composition of the target of DMU o; y'jf
represents the new values of output f after reallocation.
Non-radial BCC ZSG-DEA models are analogous, with one exception: the addition of the
convexity constraint j 1
j λ =
∑
.Max subject to
,
'
,
0, Ro
i j ji
j
Ro of j jf
j
k j jk
j
j
h
x x i
h y y
y y k f
j
λ
λ
λ
λ
≥ ∀
≤
≤ ∀ ≠
≥ ∀
∑
∑
∑
(3)
2.3 Weights Restrictions
The classic DEA models allow for total freedom in the choice of weights that will give the maximum efficiency value to a given DMU. This freedom is important in the identification of inefficient units, in other words, of those DMUs that present a poor performance including with their own set of multipliers.
The flexibility in the choice of weights is one of the advantages appointed to DEA modelling. Nevertheless, the calculated weights can be inconsistent with the knowledge in relation to the relative values of inputs and outputs, what can generate the need to introduce additional constraints.
When there are preferences between inputs and/or outputs among the decision agents, these value judgements are incorporated into the DEA models by means of restrictions to the weights (or multipliers) associated with inputs and/or outputs of the assessed units. Allen et al. (1997) and Thanassoulis et al. (2004), present a survey on the evolution of
value judgements incorporation through weights restrictions. Lins et al. (2007) show how
restrictions. Joro & Viitala (2004) study the relationship between weights restrictions and specialist opinions. Podinovski (2005) analyses the role of limits to the weights in DEA.
Halme et al. (1999) present an alternative proposal for incorporating preferences in DEA
without the use of weights restrictions.
Angulo Meza & Lins (2002) consider that the use of weights restrictions is one of the techniques that improve discrimination in DEA with decision-makers subjective opinions.
Adler et al. (2002) also include weights restrictions within discrimination improvement
techniques and present various types of restrictions. The main ones, according to Angulo Meza & Lins (2002), are: (a) direct restrictions on multipliers; (b) input-output level adjustments observed for capturing value judgements; (c) restriction to virtual inputs and outputs.
Lins et al. (2003) present the radial ZSG-DEA model with weights restrictions, output oriented,
with k multiple outputs, all of constant sum. According to Gomes’s (2003) conjecture, the
Reference DMUs Contribution Equality Theorem and the Target Value Determination Theorem remain valid for the radial ZSG-DEA models with weights restrictions. This means that in the ZSG-DEA model with weights restrictions, as in the case without these restrictions, the values of the reference DMUs contributions are equal to those obtained from classic DEA models with weights restrictions, as long as the proportional reduction strategy is adopted. Consequently, the uniformization of the frontier can be achieved.
Nevertheless, as previously mentioned, there could be situations where only one of the outputs in the model must have constant sum and, furthermore, restrictions must be imposed to the output variables weights. In these cases, the corresponding model must be the non-radial ZSG-DEA with weights restrictions. This model (CCR, output oriented) is presented in (4), in which output f is of constant sum and the remaining variables are not restricted.
T
A γ represents the coefficients matrix of the outputs weights restrictions, Au≤0.
Analogous models can be derived for input orientation and the BCC situation.
Max subject to
,
'
,
, 0, ,
Ro
i j ji
j
T
Ro of j jf i
j
T
k j jk i
j
j i
h
x x i
h y y A
y y A k f
j i λ λ γ λ γ λ γ ≥ ∀ ≤ − ≤ − ∀ ≠ ≥ ∀
∑
∑
∑
(4)3. Case Study
3.1 Air Transport and Fees
Air transport is responsible for a large part of domestic (in countries of great size like Brazil) and international travel. According to Ashford et al. (1991), the airport is an essential part of the tourist transport system, because it is the physical location where a transfer is made: from air transport to land and sea transport. One must also observe that, as stated by Martin-Cejas (2006), “the quality of the journey begins at the airport”.
In 2000, the Brazilian Airport Infrastructure Company (Infraero) adopted the vision that airports represent much more than simply the air entrance to cities. They must be seen as essential elements in the economic development of the urban regions where they are installed and in the development of tourism (Palhares, 2001). Non-aeronautical revenue is becoming increasingly important to the revenue of airports, so that these do not become overly dependent on strictly aeronautical fees. A study of non-aeronautical revenues in the efficiency of airports can be seen in Soares de Mello & Gomes (2004).
The importance of airline companies in generating non-aeronautical revenue for airports is clear. The more passengers are transported, the more revenue will be generated in services. This is because the consumption of products that are commercialised inside the airport tends to increase with the larger movement of passengers and their companions. In this way, airline companies contribute directly to greater returns in non-aeronautical revenue.
We propose here a fee discount concession model to airline companies as an incentive to increase the occupation of their airplanes and a stimulus to increase the number of passengers and visitors at airports. As a consequence, there would be an increase in non-aeronautical revenue, with a tendency to bring the airport closer to a self-sustainable operation. Aligned with this proposition, the more passengers an airline company brings to the airports, the larger the discount it will have on airport landing and ground stay fees. However, the discounts given to the ‘more efficient’ companies in terms of passenger transportation should be compensated with a type of surcharge on the companies with a smaller number of transported passengers. In this way, there is a need for both the discount and the surcharge to be calculated for each flight individually. For this purpose, the non-radial Zero Sum Gains DEA models based on the original proposal of ZSG-DEA, as discussed in Lins et al. (2003), Gomes et al. (2003, 2004, 2005) and Gomes & Lins (2008)
are proposed and presented. For a presentation of the main airport fees see Fonseca et al.
(2004).
Some work has already been done in the field of air transport in respect of the use of the DEA model to evaluate airports. Without any pretence to an exhaustive list, some of these works are mentioned herebellow.
Gillen & Lall (1997) recommend the use of DEA in these cases due to its non-parametric characteristics and due to the fact that DEA takes into account different factors
simultaneously, although not including operational costs and revenues. Pels et al. (2001)
Fernandes (2003) use DEA to study the same 35 airports so that, under financial aspects and physical dimensions, they can identify means of improving performance. Pestana & Dieke (2007) use DEA to evaluate Italian Airports.
3.2 Modelling
The new concept of attributing discounts in proportion to the quantity of passengers airline companies transport to each airport can be modelled through ZSG-DEA. In this paper, one airport will be analysed and the occupation rate of each flight at a given time on a weekday will be considered. Initially, according to the model proposed here, the discounts and surcharges, for each flight, focus only on the landing fee, so as to guarantee that the Infraero airport- related income remains constant in the airport under study. For this airport a model is applied where the DMUs are the flights operated in one day.
The model used is the non-radial CCR ZSG-DEA, output oriented. In this model, from the point of view of the airport administrator, the inputs are the maximum take-off weight (MTOW) of the aircraft, contained in its navigation certificate and measured in tons, and the duration of ground stay of the aircraft at the airport. The outputs are the non-airport-related revenue generated by the flight and the total fee paid.
The MTOW input indicates the maximum take-off weight of the aircraft. Generally, the greater this value, the larger the size of the aircraft and the greater the number of seats it offers. This implies that a larger number of passengers can be transported, which contributes to a greater collection of non-aeronautical related revenue by the airport’s administration in its dependencies. As the landing and ground stay fee values depend on the MTOW of the aircraft, the greater the MTOW, the greater the amount charged by the airport for an aircraft to land. The amount charged by the hour for the aircraft to remain in the manoeuvre locations is also greater.
The input, length of stay of the aircraft in the manoeuvre location, measures the time spent by the aircraft in the manoeuvre location of the airport between flights. As in the point of view of the airline company ‘aircraft on the ground make a loss’, this variable measures the capacity of the airline company to prepare the aircraft for a new flight. The boarding and disembarking of passengers, the cleaning of the aircraft, the loading and unloading of luggage, and refuelling are some of the activities carried out by the company’s team while the aircraft is on the ground. The shorter this time, the better the possibility that this aircraft will make more flights, and consequently, transport more passengers, bringing them to airports and therefore, increasing the collection of non-airport-related revenue. From the airport point of view this variable measures the unavailability of this space, which could be used by another aircraft. In other words, the shorter this time, the greater the possibility that more aircrafts will use this space and bring more passengers to the airport.
The output, non-aeronautical-related revenue generated by the flight, is virtually impossible to measure directly. Therefore, to substitute it, the number of passengers effectively transported was used, because it maintains a causal relationship with the non-aeronautical income.
The model proposed here fits into a total reformulation of fees and has the objective of measuring the efficiency of each flight in generating non-aeronautical revenue for the airports. Based on this efficiency, discounts and surcharges are attributed to the value of the total fee (landing and ground stay), so that the amount collected by the airport administration remains constant.
The constant sum output is, therefore, the total landing fee, in other words, after the execution of the model there will be an increase of output to the least efficient flights and a decrease of output to the most efficient flights, maintaining the total of this variable unchanged. Besides verifying which flights were most efficient in generating revenue for the airport administration, it is necessary to identify how much should really have been paid and, thus obtain the discount or surcharge. For this, a new value was calculated for the total landing fee output, for all DMUs (flights) in such a way that, with this new value, all are efficient.
The DMUs analysed in the model are domestic flights operated at a given airport. As there is difficulty obtaining real data, the data here was simulated. The difficulty in accessing trustworthy data about air transport has already been mentioned, for example, in Soares de Mello et al. (2005).
A total of 26 flights were considered spread through three different fictitious companies, C1, C2, C3. We supposed that all companies were of similar size, one of them being slightly larger than the other two. In this way, 13 flights were considered for company C1, 13 for company C2 and 10 flights for company C3.
Some aircraft were chosen, from among the ones that operate within the Brazilian air network (and which, therefore, had easily available data) to make up the fleet of these fictitious companies. This fleet is presented in Table 1, where the MTOW and the number of seats of each aircraft for each airline company appear.
Table 1 – Aircraft, MTOW and seats.
Aircraft MTOW (in tons) Number of seats
767-300 181 196
737-800 77 156
737-700 68 132
737-500 52 117
C1
737-300 61 132
A-320 70 162
A-319 64 132
C2
Fokker 100 44 108
737-700 62 144
C3
737-800 62 177
3.3 Data
aircraft operating a flight (Prob). The probability of each aircraft operating a flight is given by the ratio between the number of aircraft of each type and the total number of aircraft from each company.
Table 2 – Probability of each aircraft in the fleet of airline companies.
C1 C2 C3
Aircrafts N Prob Aircraft N Prob Aircraft N Prob
767-300 8 0,1356 A-320 31 0,4769 737-700 21 0,8750
737-800 2 0,0339 A-319 13 0,2000 737-800 3 0,1250
737-700 3 0,0508 Fokker 100 21 0,3230
737-500 14 0,2373
737-300 32 0,5423
A discreet distribution is carried out with this data, where the discreet variables are the aircraft types. The probability of each aircraft operating a flight is also inserted. This is performed for each airline company, in other words, for company C1 five discreet variables are considered with their respective probabilities and 13 random numbers are generated. For C2 three discreet variables are considered and 13 random numbers are also generated. For C3 two discreet variables are considered and 10 random numbers generated.
To obtain the number of passengers transported it is necessary to generate values for the occupation of flights. These values are obtained by a triangular distribution, where the values for the averages are the ones available on the website of the former Civil Aviation Department. For each fictitious company the average data of each of three real companies was used. The calculation of the effective number of passengers transported is given by the ‘occupation of each flight’ multiplied by the ‘number of seats available in the aircraft that operates the flight’.
As the landing and ground stay fees depend on the MTOW of the aircraft, the values for the
total paid fee are obtained at Portaria N.º 33/DGAC. According to the Portaria
N.º 440/SOP, the standard MTOW for aircraft classified in group I, for the charging of use of services supplied by the aeronautical infrastructure, is calculated based on the weighted average of the fleet of each company, by type of aircraft. The individual MTOW of each aircraft is considered for the purposes of charging landing and ground stay fees. This is justified by the fact that airline companies with a larger number of smaller sized aircrafts benefit from the value of these fees. In addition, it is because the standard MTOW does not make sense, as the discounts will be given by flight to the airline company. The values charged by category I airports are considered for the landing and ground stay fees.
The data for the ground stay of each aircraft after landing is also simulated through empirical observation.
airports in the country, the value of the fees becomes quite significant. According to the values of the case study presented here, each airline company fictitiously pays the following values for the flights they operate: C1 = R$ 1,870.29; C2 = R$ 1,469.74; C3 = R$ 1,117.24.
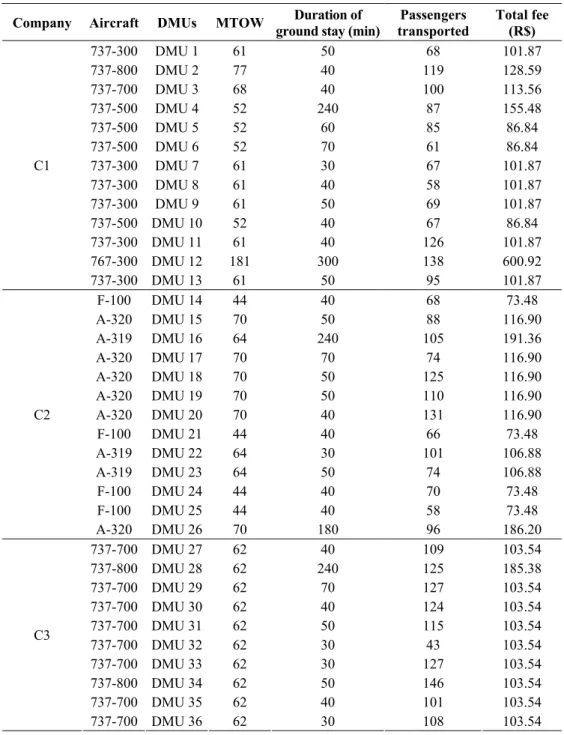
Table 3 – Model data.
Company Aircraft DMUs MTOW Duration of
ground stay (min)
Passengers transported
Total fee (R$)
737-300 DMU 1 61 50 68 101.87
737-800 DMU 2 77 40 119 128.59
737-700 DMU 3 68 40 100 113.56
737-500 DMU 4 52 240 87 155.48
737-500 DMU 5 52 60 85 86.84
737-500 DMU 6 52 70 61 86.84
737-300 DMU 7 61 30 67 101.87
737-300 DMU 8 61 40 58 101.87
737-300 DMU 9 61 50 69 101.87
737-500 DMU 10 52 40 67 86.84
737-300 DMU 11 61 40 126 101.87
767-300 DMU 12 181 300 138 600.92
C1
737-300 DMU 13 61 50 95 101.87
F-100 DMU 14 44 40 68 73.48
A-320 DMU 15 70 50 88 116.90
A-319 DMU 16 64 240 105 191.36
A-320 DMU 17 70 70 74 116.90
A-320 DMU 18 70 50 125 116.90
A-320 DMU 19 70 50 110 116.90
A-320 DMU 20 70 40 131 116.90
F-100 DMU 21 44 40 66 73.48
A-319 DMU 22 64 30 101 106.88
A-319 DMU 23 64 50 74 106.88
F-100 DMU 24 44 40 70 73.48
F-100 DMU 25 44 40 58 73.48
C2
A-320 DMU 26 70 180 96 186.20
737-700 DMU 27 62 40 109 103.54
737-800 DMU 28 62 240 125 185.38
737-700 DMU 29 62 70 127 103.54
737-700 DMU 30 62 40 124 103.54
737-700 DMU 31 62 50 115 103.54
737-700 DMU 32 62 30 43 103.54
737-700 DMU 33 62 30 127 103.54
737-800 DMU 34 62 50 146 103.54
737-700 DMU 35 62 40 101 103.54
C3
4. Results and Discussion
The non-radial ZSG-DEA CCR model, oriented to outputs, with weights restrictions is calculated. It is desired that the output number of passengers transported has a greater weight than the output total fee. However, as the two variables are measured in different units, the previous statement, by itself, is meaningless (Allen et al., 1997; Gomes et al., 2009a). For it to make sense, it would be necessary to normalise the data, which would bring problems of interpreting the results of the redistribution of the total fee output. Thus, the option was made to perform a normalisation by the sum, incorporated not to the data, but to the weights restriction of these variables. In this way, the restriction added is u1−1, 2991u2≥0. This value corresponds to the ratio between the sum of the values of the total fee of all the DMUs and the sum of the values of passengers transported by all of the DMUs.
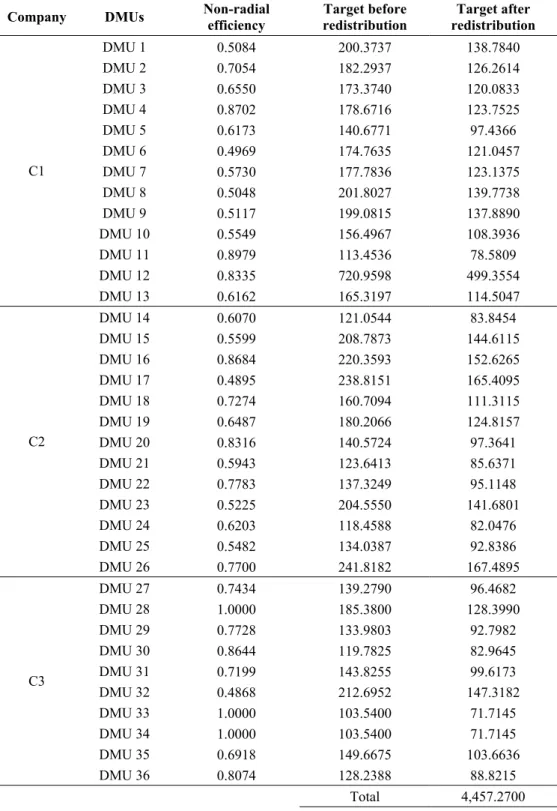
The first step is to run the non-radial model with weights restrictions so as to obtain the efficient measurements of each DMU. To obtain the uniformised frontier, the DMUs targets for the variable of constant sum, total fee, are determined. The values of the efficiency measurements and the targets are found in Table 4.
It was confirmed that the DMUs 28, 33 and 34 are efficient by the non-radial model. The DMUs 16, 26 and 28 present high values of efficiency, even though they possess high ground stay times. This is because a large aircraft operates them. They also have a reasonably high rate of occupation and, consequently, they transported a number of passengers greater than the average. They also have an increased total fee value due to the ground stay fee, even with the use of weights restrictions. These factors mean that these flights have relatively high efficiency values.
After that, the proportional reduction strategy is applied to the target output and, in this way, new values for the total fee for each DMU are obtained, according to Table 4.
Table 4 – Values of each DMU efficiencies and their targets before and after the redistribution.
Company DMUs Non-radial
efficiency
Target before redistribution
Target after redistribution
DMU 1 0.5084 200.3737 138.7840
DMU 2 0.7054 182.2937 126.2614
DMU 3 0.6550 173.3740 120.0833
DMU 4 0.8702 178.6716 123.7525
DMU 5 0.6173 140.6771 97.4366
DMU 6 0.4969 174.7635 121.0457
DMU 7 0.5730 177.7836 123.1375
DMU 8 0.5048 201.8027 139.7738
DMU 9 0.5117 199.0815 137.8890
DMU 10 0.5549 156.4967 108.3936
DMU 11 0.8979 113.4536 78.5809
DMU 12 0.8335 720.9598 499.3554
C1
DMU 13 0.6162 165.3197 114.5047
DMU 14 0.6070 121.0544 83.8454
DMU 15 0.5599 208.7873 144.6115
DMU 16 0.8684 220.3593 152.6265
DMU 17 0.4895 238.8151 165.4095
DMU 18 0.7274 160.7094 111.3115
DMU 19 0.6487 180.2066 124.8157
DMU 20 0.8316 140.5724 97.3641
DMU 21 0.5943 123.6413 85.6371
DMU 22 0.7783 137.3249 95.1148
DMU 23 0.5225 204.5550 141.6801
DMU 24 0.6203 118.4588 82.0476
DMU 25 0.5482 134.0387 92.8386
C2
DMU 26 0.7700 241.8182 167.4895
DMU 27 0.7434 139.2790 96.4682
DMU 28 1.0000 185.3800 128.3990
DMU 29 0.7728 133.9803 92.7982
DMU 30 0.8644 119.7825 82.9645
DMU 31 0.7199 143.8255 99.6173
DMU 32 0.4868 212.6952 147.3182
DMU 33 1.0000 103.5400 71.7145
DMU 34 1.0000 103.5400 71.7145
DMU 35 0.6918 149.6675 103.6636
C3
DMU 36 0.8074 128.2388 88.8215
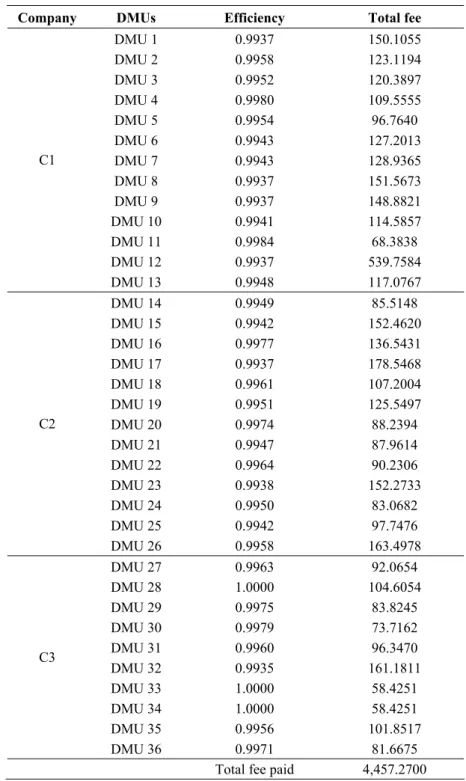
Table 5 – Final result: efficiency and total fee.
Company DMUs Efficiency Total fee
DMU 1 0.9937 150.1055
DMU 2 0.9958 123.1194
DMU 3 0.9952 120.3897
DMU 4 0.9980 109.5555
DMU 5 0.9954 96.7640
DMU 6 0.9943 127.2013
DMU 7 0.9943 128.9365
DMU 8 0.9937 151.5673
DMU 9 0.9937 148.8821
DMU 10 0.9941 114.5857
DMU 11 0.9984 68.3838
DMU 12 0.9937 539.7584
C1
DMU 13 0.9948 117.0767
DMU 14 0.9949 85.5148
DMU 15 0.9942 152.4620
DMU 16 0.9977 136.5431
DMU 17 0.9937 178.5468
DMU 18 0.9961 107.2004
DMU 19 0.9951 125.5497
DMU 20 0.9974 88.2394
DMU 21 0.9947 87.9614
DMU 22 0.9964 90.2306
DMU 23 0.9938 152.2733
DMU 24 0.9950 83.0682
DMU 25 0.9942 97.7476
C2
DMU 26 0.9958 163.4978
DMU 27 0.9963 92.0654
DMU 28 1.0000 104.6054
DMU 29 0.9975 83.8245
DMU 30 0.9979 73.7162
DMU 31 0.9960 96.3470
DMU 32 0.9935 161.1811
DMU 33 1.0000 58.4251
DMU 34 1.0000 58.4251
DMU 35 0.9956 101.8517
C3
DMU 36 0.9971 81.6675
Using this final result, a calculation is made of how much each airline company, fictitiously should pay after the redistribution of the total fees values in each flight: C1 = R$ 1,996.36; C2 = R$ 1,548.84; C3 = R$ 912.11.
It was confirmed that the total value to be paid by company C1 for the flights analysed here would be 6.7% greater. Company C2 would pay an amount approximately 5.4% greater and C3 would receive a discount in the total value paid for its flights of approximately 18.4%.
It was also noted that 18 flights would receive a discount and another 18 would have to pay a surcharge. The flights referring to the DMUs 8, 17 and 32 would receive a greater percentage increase in their fees: 49%, 53% and 56%, respectively. It was also observed that they are all flights that transport few passengers. However, the flights referring to the DMUs 28, 33 and 34 would receive a greater percentage discount in their fees: 44%. These are flights that transport a greater number of passengers.
Airline company C3 would receive the most discounts in its flights, 9 flights with discounts; company C2 received discounts in 5 flights, and C1 in 4 flights. It was also observed that there was an average occupation of 0.57 for the flights that are surcharge. For the 18 flights that would obtain discounts, the average occupation is 0.78.
5. Conclusions
This article dealt, solely in an empirical way, with an extension of the ZSG-DEA that considers simultaneous weights restrictions and non-controllable variables. This non-radial model does not permit the uniformization of the frontier by the method of clustering all the inefficient DMUs in a single group of cooperation. This shows that the extension of the Gomes (2003) conjecture is no longer valid for the present case. Nevertheless, previous numerical experiments, both with the conjecture and its extension for a non-radial model without weights restrictions, have been shown to be valid. Although it is still necessary to demonstrate the conjecture (which may, possibly, not be valid in the simple case for which it was stated), it is necessary to understand the reason why, when two simple situations are joined, it is no longer possible to use the target proportionality theorem and a single group of cooperation for the uniformization of the frontier. This study is left as a suggestion for future work.
Regarding the algorithm proposed here (successive iterations) there is also no guarantee that this will work in all cases. In the numerical experiments carried out, there was always apparent convergence, although it was not always fast. The properties of this algorithm, including its theoretical validation, should also be the subject of new research.
As regards the case study, the proposal to attribute discounts on the airline fees according to the number of passengers transported signifies a means by which the airport administrators encourage the airline companies to become more efficient, review their costs and, consequently, the price of the airline tickets. In this way, as well as encouraging competition between the airline companies, the concept presented here can result in a greater movement of passengers (and companions) in the airports which opt to use it. In turn, this greater movement will generate greater non-aeronautical revenue. For this to occur, it is necessary that the administrators of Brazilian airports fully realise the importance of this type of revenue as well as investment in shopping and leisure options, also in such a way as to attract diverse visitors. A small beginning of awareness of the non-aeronautical revenue
fundamental importance can be notice by the increasing presence of AeroShoppings in the
American and European airports, most of them privatised and with a more commercial philosophy, have noticed the importance of the ever increasing non-aeronautical revenues. Privatisation, in turn, requires regulation of prices. Discussion over single till or dual till divides the opinions of air transport specialists and researchers. See for example, Czerny (2006). The model proposed here presents hybrid characteristics of dual till and single till.
References
(1) Adler, N.; Friedman L. & Sinuany-Stern, Z. (2002). Review of ranking methods in the
data envelopment analysis context. European Journal of Operational Research, 140(2), 249-265.
(2) Adler, N. & Berechman, J. (2001). Measuring airport quality from the airlines’ viewpoint: An application of data envelopment analysis. Transport Policy, 8(3), 171-181.
(3) Allen, R.; Athanassopoulos, A.; Dyson, R.G. & Thanassoulis, E. (1997). Weights
restrictions and value judgements in data envelopment analysis: evolution, development and future directions. Annals of Operations Research, 73, 13-34.
(4) Angulo Meza, L. & Lins, M.P.E. (2002). Review of methods for increasing
discrimination in data envelopment analysis. Annals of Operations Research, 116,
225-242.
(5) Ashford, H.; Stanton, H. & Moore, C. (1991). Airport Operations. Pitman, London.
(6) Asmild, M.; Paradi, J.C. & Pastor, J.T. (2009). Centralized resource allocation BCC
models. Omega, 37(1), 40-49.
(7) Avellar, J.V.G.; Milioni, A.Z. & Rabello, T.N. (2005). Modelos DEA com variáveis
limitadas ou soma constante. Pesquisa Operacional, 25(1), 135-150.
(8) Avellar, J.V.G.; Milioni, A.Z. & Rabello, T.N. (2007). Spherical frontier DEA model
based on a constant sum of inputs. Journal of the Operational Research Society, 58(9), 1246-1251.
(9) Banker, R.D.; Charnes, A. & Cooper, W.W. (1984). Some models for estimating
technical scale inefficiencies in Data Envelopment Analysis. Management Science,
30(9), 1078-1092.
(10) Barr, R.S.; Durchholz, M.L. & Seiford, L. (2000). Peeling the DEA onion: Layering
and rank-ordering DMUs using tiered DEA. Technical Report, Southern Methodist University.
(11) Beasley, J.E. (2003). Allocating fixed costs and resources via data envelopment
analysis. European Journal of Operational Research, 147(1), 198-216.
(12) Charnes, A.; Cooper, W.W. & Rhodes, E. (1978). Measuring the Efficiency of
Decision-Making Units. European Journal of Operational Research, 2(6), 429-444.
(13) Cooper, W.W.; Seiford, L.M. & Tone, K. (2000). Discretionary, non-discretionary and
categorical variables. In: Data envelopment analysis: a comprehensive text with
(14) Czerny, A.I. (2006). Price-cap regulation of airports: Single-till versus dual-till. Journal of Regulatory Economics, 30(1), 85-97.
(15) Fang, L. & Zhang, C.-Q. (2008). Resource allocation based on the DEA model. Journal of the Operational Research Society, 59(8), 1136-1141.
(16) Fernandes, E. & Pacheco, R.R. (2002). Efficient use of airport capacity. Transportation Research Part A, 36(3), 225-238.
(17) Fonseca, A.B.M.; Soares de Mello, J.C.C.B. & Espírito Santo Jr, R.A. (2004). Um estudo sobre tarifas aeroportuárias. Relatórios de Pesquisa em Engenharia de Produção, 4(15).
(18) Gillen, D. & Lall, A. (1997). Developing measures of airport productivity and
performance: an application of data envelopment analysis. Transportation Research
Part E: Logistic and Transportation Review, 33(4), 261-273.
(19) Gomes, E.G. (2003). Modelos de Análise de Envoltória de Dados com Ganhos de Soma
Zero. Tese (Doutorado em Engenharia de Produção) – COPPE, Universidade Federal do Rio de Janeiro. Rio de Janeiro.
(20) Gomes, E.G. & Lins, M.P.E. (2008). Modelling undesirable outputs with zero sum
gains data envelopment analysis models. Journal of the Operational Research Society,
59(5), 616-623.
(21) Gomes, E.G. & Soares de Mello, J.C.C.B. (2009). Distribuição de bolsas de iniciação
científica com algoritmo híbrido baseado em eficiências DEA. Pesquisa Operacional
para o Desenvolvimento, 1(2), 169-177.
(22) Gomes, E.G.; Soares de Mello, J.C.C.B. & Angulo Meza, L. (2008). Large discreet
resource allocation: a hybrid approach based on DEA efficiency measurement.
Pesquisa Operacional, 28(3), 597-608.
(23) Gomes, E.G.; Soares de Mello, J.C.C.B. & Lins, M.P.E. (2003). Busca seqüencial de
alvos intemediários em modelos DEA com soma de outputs constante. Investigação
Operacional, 23(2), 163-178.
(24) Gomes, E.G.; Soares de Mello, J.C.C.B. & Lins, M.P.E. (2004). Redistribuição de
inputs e outputs em modelos de análise de envoltória de dados com ganhos de soma zero. Pesquisa Operacional, 24(2), 269-284.
(25) Gomes, E.G.; Soares de Mello, J.C.C.B. & Lins, M.P.E. (2005). Uniformização da
fronteira eficiente em modelos de análise de envoltória de dados com ganhos de soma zero e retornos constantes de escala. Pesquisa Operacional, 25(2), 261-277.
(26) Gomes, E.G.; Soares de Mello, J.C.C.B. & Mangabeira, J.A.C. (2009a). Estudo da
sustentabilidade agrícola em um município amazônico com análise envoltória de dados.
Pesquisa Operacional, 29(1), 23-42.
(27) Gomes, E.G.; Soares de Mello, J.C.C.B.; Souza, G.S.; Angulo Meza, L. & Mangabeira,
J.A.C. (2009b). Efficiency and sustainability assessment for a group of farmers in the Brazilian Amazon. Annals of Operations Research, 169, 167-181.
(28) Gomes, E.G.; Souza, G.S.; Lima, S.M.V. & Fonseca, C.E.L. (2007). Alocação de
(29) Guedes, E.C.C.; Freitas, G.M.; Avellar, J.V.G. & Milioni, A.Z. (2009). On the allocation of new inputs and ouputs with DEA. Engevista, 11(1), 4-7.
(30) Hadi-Vencheh, A.; Foroughi, A.A. & Soleimani-Damaneh, M. (2008). A DEA model
for resource allocation. Economic Modelling, 25(5), 983-993.
(31) Halme, M.; Joro, T.; Korhonen, P.; Salo, S. & Wallenius, J. (1999). A value efficiency approach to incorporating preference information in data envelopment analysis.
Management Science, 45(1), 103-115.
(32) Hu, J-L. & Fang, C-Y. (2010). Do market share and efficiency matter for each other?
An application of the zero-sum gains data envelopment analysis. Journal of the
Operational Research Society, 61(4), 647-657.
(33) Joro, T. & Viitala, E.J. (2004). Weight-restricted DEA in action: from expert opinions to mathematical models. Journal of the Operational Research Society, 55(8), 814-821.
(34) Korhonen, P. & Syrjänen, M. (2004). Resource allocation based on efficiency analysis.
Management Science, 50(8), 1134-1144.
(35) Lins, M.P.E.; Gomes, E.G.; Soares de Mello, J.C.C.B. & Soares de Mello, A.J.R.
(2003). Olympic ranking based on a zero sum gains DEA model. European Journal of
Operational Research, 148(2), 312-322.
(36) Lins, M.P.E.; Silva, A.C.M. & Lovell, C.A.K. (2007). Avoiding infeasibility in DEA
models with weight restrictions. European Journal of Operational Research, 181(2),
956-966.
(37) Lozano, S.N.; & Villa, G. (2005). Centralized DEA models with the possibility of
downsizing. Journal of the Operational Research Society, 56(4), 357-364.
(38) Lozano, S.N. & Villa, G. (2004). Centralized resource allocation using data
envelopment analysis. Journal of Productivity Analysis, 22(1-2), 43-161.
(39) Martin-Cejas, R.R. (2006). Tourism service quality begins at the airport. Tourism
Management, 27(5), 874-877.
(40) Nacif, F.B.; Soares de Mello, J.C.C.B. & Angulo Meza, L. (2009). Choosing weights in optimal solutions for DEA-BCC models by means of a n-dimensional smooth frontier.
Pesquisa Operacional, 29(3), 623-642.
(41) Pacheco, R.R. & Fernandes, E. (2003). Managerial efficiency of Brazilian airports.
Transportation Research Part A: Policy and Practice, 37(8), 667-680.
(42) Palhares, G.L. (2001). Transporte aéreo e turismo: gerando desenvolvimento
socioeconômico. Editora Aleph, São Paulo.
(43) Pels, E.; Nijkamp, P. & Rietveld, P. (2001). Relative efficiency of European airports.
Transport Policy, 8(3), 183-192.
(44) Pestana, C.B. & Dieke, P.U.C. (2007). Performance evaluation of Italian airports:
A data envelopment analysis. Journal of Air Transport Management, 13(4), 184-191.
(45) Podinovski, V. (2005). The explicit role of weight bounds in models of data
(46) Soares de Mello, J.C.C.B.; Lins, M.P.E. & Gomes, E.G. (2002). Construction of a smoothed DEA frontier. Pesquisa Operacional, 22(2), 183-201.
(47) Soares de Mello, J.C.C.B. & Gomes, E.G. (2004). Eficiências aeroportuárias: uma
abordagem comparativa com análise de envoltória de dados. Revista de Economia e
Administração, 3(1), 15-23.
(48) Soares de Mello, J.C.C.B.; Gomes, E.G.; Biondi Neto, L. & Lins, M.P.E. (2004).
Suavização da fronteira DEA: O caso BCC tridimensional. Investigação Operacional,
24(1), 89-107.
(49) Soares de Mello, J.C.C.B.; Gomes, E.G.; Gomes, L.F.A.M.; Biondi Neto, L. & Angulo
Meza, L. (2005). Avaliação do tamanho de aeroportos portugueses com relações multicritério de superação. Pesquisa Operacional, 25(3), 313-330.
(50) Soares de Mello, J.C.C.B.; Gomes, E.G.; Leta, F.R. & Soares de Mello, M.H.C. (2006). Algoritmo de alocação de recursos discretos com análise de envoltória de dados.
Pesquisa Operacional, 26(2), 225-239.
(51) Thanassoulis, E.; Portela, M.C.S. & Allen, R. (2004). Incorporating value judgments
in DEA. In: Handbook on data envelopment analysis [edited by W.W. Cooper, L.M.
Seiford and J. Zhu], Kluwer Academic Publishers, Boston, 99-138.
(52) Villa, G. & Lozano, S.A. (2004). Constant Sum of Outputs DEA model for Olympic
Games target setting. In: 4th International Symposium on DEA. Proceedings of the
4th International Symposium on DEA, Aston University, US, p. 36.
(53) Yan, H.; Wei, Q. & Hao, G. (2002). DEA models for resource reallocation and