*e-mail: [email protected]
Article presented at the XV CBECIMAT, Natal - RN, November/2002
Sintering of Ni-Zn Ferrite Nanopowders By the
Constant Heating Rate (Chr) Method
Ana Cristina Figueiredo de Melo Costaa*, Edener Tortellab, Elias Fagury Netob, Márcio Raymundo Morellib, Ruth Herta Goldschmidt Aliaga Kiminamib
aDepartment of Materials Eng., Federal University of Campina Grande,
58109 - 970 Campina Grande - SP, Brazil
bDepartment of Materials Eng., Federal University of São Carlos,
13565-905 São Carlos - SP, Brazil
Received: January 30, 2003; Revised: June 30, 2004
The constant heating rate method employed in sintering studies offers several advantages over the isothermal method, particularly the fact that all the parameters that describe the sintering phenomena can be obtained from a single sample. The purpose of this work is to determine the parameters of sintering kinetics of nanosized Ni-Zn ferrite powders synthesized by combustion reaction. The nonisothermal sintering method was studied using a constant heating rate (CHR). The Ni-Zn ferrite powders, with average particle size varying from 18 nm to 29 nm, were uniaxially pressed and sintered in an horizontal dilatometer at a constant heating rate of 5.0 °C/min from 600 °C up to complete densification, which was reached at 1200 °C. The compacts were characterized by scanning electron microscopy (SEM). Experimental results revealed three different sintering stages, which were identified through the Bannister Theory. The shrinkage and the shrinkage rate analyzed showed a viscous contribution in the initial sintering stage, which was attributed to the mechanism of structural nanoparticle rearrangement.
Keywords: Ni-Zn ferrite, sintering, nanoparticle
1. Introduction
The sintering of ferrites via solid state, as well as of other ceramic materials, is a thermal process that causes reduction of the surface area through the formation of grain boundaries, neck growth between particles and usu-ally also densification. During the solid state sintering process, the porosity decreases and the material’s micro-structure, which defines the performance of the final prod-uct, is developed. The sintering stages represent the geo-metrical evolution that occurs during the transformation of a compact powder into a dense and resistant solid1,2.
During these stages, the overall interface free energy of a set of particles decreases because the reduction of solid-vapor interface energy is greater than the increase of solid-solid interface energy (grain boundary) of the sys-tem3. The driving force of the sintering process is the
reduction of overall free energy by the decrease of spe-cific surface area and compact interfaces. Solid state sintering may be performed by two alternative processes: densification, with a change of the solid-vapor interface
(particle-pore) into solid-solid interface with less energy, or grain growth, with the transformation of numerous small grains (the compact’s particles) into a smaller number of large grains. From this standpoint, therefore, the microstructural changes that occur during solid sate sintering result from the combined effect of densification and grain growth4.
The sintering kinetics of ceramic materials was in-vestigated here using the nonisothermal method, i.e., the constant heating rate (TCA or CHR). Compared to con-ventional isothermal sintering, this method yields faster results and requires only one sample, also allowing for an examination of the entire sintering history5. The
nonisothermal techniques for analysis of the sintering stage initially allow for the determination of sintering param-eters such as the sintering coefficient, activation energy and diffusion sintering6. Starting from the basic sintering
equation, Woolfrey and Bannister7,8 proposed a series of
rate (CHR) sintering, suggesting the following equation:
(1)
where T is the temperature (K), d((∆L/Lo)/dt is the lin-ear shrinkage differential, ∆L/Lo is the linear shrinkage (%),
Q is the activation energy (kJ/mol), R is the ideal gas con-stant (J/mol.K), and n is the sintering mechanism. Based on Eq. 1, a T2d(
∆L/Lo)/dtvs.(∆L/Lo) plot should consist of a straight line with an angular coefficient Q/(n+1)R, in which Q/(n+1) may be calculated. In order to obtain the n value, the activation energy Q must be calculated by the Dorn method9. Once Q has been calculated, n can
be determined and the sintering mechanism, which acts in the sintering stages, identified as shown in Table 1.
Several current scientific research efforts in the field of ceramic technology of ferrites by solid-state reaction study these materials, behavior during sintering by at-tempting to gain a better understanding of the mecha-nisms and phenomena involved in grain densification and growth. This knowledge is important to allow changes in the composition and processing of ferrites to be effected, with the purpose of obtaining microstructures that con-fer on the sintered material properties and characteris-tics appropriate for their application. Some of these stud-ies are the following: Levesque10 and Paulus11,12 studied
the grain growth of Mn-Zn ferrites in the early stage of sintering; Jain et al.13 reported on grain growth kinetics
in the intermediate stage of Mn-Zn-Fe ferrite sintering, which was obtained by the conventional oxide blending method. The activation energy determined for the inter-mediate stage was 130 Kcal/mol; Dias et al.3 investigated
the sintering kinetics of the intermediate and final stages of Ni-Zn ferrites prepared by hidrothermal synthesis; Parvatheeswara Rao et al.14 studied the evolution of
Ni-Zn ferrite microstructures at sintering temperatures in the range of 1150 ° to 1300 °C for 1 to 4 h. Densification and grain growth was reported as Arrhenius rate control-led processes with activation energies of 63.9 and 64.4 Kcal/mol, respectively. Cho et al.15 investigated the
behavior during sintering of nanocrystalline Ni-Zn ferrites, chemically modified by the addition of Si and Ca. The activation energy estimated for grain boundary
diffusion was 310 kJ/mol and 470 kJ/mol, respectively, for Ni-Zn ferrites with and without additives. An activa-tion energy of 750 kJ/mol was calculated for micromet-ric Ni-Zn ferrite powders.
The above-mentioned studies investigated the sintering kinetics throughout the sintering stages of this material. However, no reports appear to be available re-garding specific research work on the sintering kinetics of Ni0.7Zn0.3Fe2O4 ferrites synthesized by combustion reac-tion. Hence, by means of the nonisothermal, constant heat-ing rate (CHR) method, this study aimed to evaluate the effect of Zn2+ concentrations on the sintering kinetics of
Ni1-xZnxFe2O4 nanometric powder with x = 0.3; 0.5; 0.7% mol of Zn2+ obtained by combustion reaction.
2. Experimental
To synthesize ferrite powders by combustion reaction, Ni(NO3)2.6H2O, Zn(NO3)2.6H2O, and Fe(NO3)3.9H2O were used as precursor reagents (oxidizing agents) and cation sources and urea (CO(NH2)2) as the reducing agent. The procedure used to synthesize the powders by com-bustion reaction has been described in detail in previous reports16,18. Powders with particle sizes ranging from 18
to 29 nm were compacted into 9.8 mm diameter, 3 mm high pellets by uniaxial pressing at 385 MPa (green den-sity 59.1 ± 0.98 of theoretical denden-sity). The samples, which were named C03, C05 and C07 for systems with 0.3, 0.5 and 0.7% mol of Zn2+, respectively, were
cal-cined at 600 °C/1h for binder burnout (5% PVAL) and then sintered at 1200 °C in a NETZCHS 402E dilatometer at a constant heating rate of 5 °C/min. After sintering, the samples were polished with 0.3 µm alumina, ther-mally etched at 1100 °C for 30 min, and then analyzed by SEM (XL30 FEG, Philips). Representative micro-graphs of the samples were used to determine the mean grain size using the MOCHA software program (Jandel, Image Analyzer).
3. Results and Discussion
The early, intermediate and final stages of Ni-Zn fer-rite sintering were evaluated to investigate the effect of the concentration of Zn2+ on the sintering of nanometric
powders of Ni-Zn ferrites synthesized by combustion re-action. Figs. 1a and b and Table 2 show the results ob-tained for linear shrinkage (∆L/L0) and linear shrinkage rate (d(∆L/Lo)/dt) according to temperature, for systems C03, C05 and C07, which corresponded, respectively, to 0.3, 0.5 and 0.7 mol of Zn2+. Increases in the
concentra-tion of Zn2+ affected the sintering behavior, reducing the
linear shrinkage at the point of maximum linear shrink-age and final density of the samples. The C03 and C05 systems displayed similar values of temperature at the Table 1. Sintering mechanism according to Wooffrey and
Bannis-ter7,8.
n Sintering Mechanism
0 Viscous flow
1 Bulk diffusion
maximum linear shrinkage rate (1016 °C), although the C05 system showed a lower maximum linear shrinkage rate (1.9E-1 1/min) than the C03 system (3.3E-1 1/min). The temperature for the onset of retraction (814 °C) was found to be higher in the C07 system than in the C03 and C05 (787 °C and 763 °C) systems. On other hand, the temperature at the point of maximum linear shrinkage (978 °C) for C07 was lower than in the other systems (1016 °C). The point of maximum linear shrink-age decreased according to the Zn2+ concentration in the
system; in other words, the shrinkage in the C07 system
(0.7% mol of Zn2+) was 5.86% (73.1% of theoretical
sity), whereas it was 8.08% (72,21% of theoretical den-sity) in the C05 system and 9.96% (81.72% of theoreti-cal density) in the C03 system. The same behavior was observed for retraction at the final temperature (1200 °C), i.e., 11.88% (89.13% of theoretical density), 13.68% (93.23% of theoretical density) and 14.48% (95.38% of theoretical density), respectively, for the C07, C05 and C03 systems.
Figure 2 shows the plot calculated by Woolfrey and Bannister’s method7,8, to determine the sintering
coeffi-Table 2. Results of sintering at 1200 °C for the C03, C05 and C07 systems with a constant heating rate of 5 °C/min.
Systems C03 C05 C07
Ni0.7Zn0.3Fe2O4 Ni0.5Zn0.5Fe2O4 Ni0.3Zn0.7Fe2O4
Starting shrinkage 787 763 814
temperature (°C)
Temperature at the point of 1016 1016 978
maximum linear shrinkage (°C)
Shrinkage rate at the point 3.35E-1 1.93E-1 2.22E-1
of maximum linear shrinkage rate (1/min)
Shrinkage at the point of maximum 9.96 8.08 5.86
linear shrinkage rate (%)
Linear shrinkage at the point of 81.72 77.21 73.10
maximum linear shrinkage rate (%)
Linear shrinkage at 1200 °C (%) 14.48 13.68 11.88
Relative density at 1200 °C (%) 95.38 93.23 89.13
(a) (b)
cients with a constant heating rate (CHR) of 5 °C/min, for the early, intermediate and final stages. The activation en-ergy was determined by the Dorn method9. Table 3 shows
the values of activation energy and sintering coefficients for the three stages of sintering. The linear part of the curve rep-resents the stages in which probably only one sintering mecha-nism took place, while the nonlinear part represents a transi-tion region between two mechanisms.
The initial stage developed to 2.5% in the three systems investigated. The activation energy values ranged from 214.61 to 242.70 and the sintering mechanism was n ∼ 0, indicating that the prevailing mechanism in the initial stage of sintering in the three systems was structural rearrangement of nanoparticles, with viscous flow characteristics (n = 0). The activation energy values were lower than those estimated by Cho et al.15 for grain boundary diffusion, which were 310 kJ/
mol and 470 kJ/mol for Mn-Zn ferrite nanopowders. The second stage ranged from 3.0% to 10.0% in C03, 3.0% to 8.0% in C05, and 3.0% to 6.0% in C07. It was found, in this stage, that the nanoparticles also simulated a viscous
flow behavior, as in the initial stage, owing to the presence of nanoparticles. However, grain boundary diffusion was be-lieved to take place in this stage. The activation energy showed coherent values corresponding to the intermediate stage. In C03 and C05, these values (130kJ/mol) were lower than those proposed by Jain et al.13 for the sintering of Mn-Zn ferrites;
nevertheless, C07 presented very similar values.
The third stage corresponded to the point of maximum linear shrinkage, coarsening, and decrease of the linear shrink-age rate due to a decrease of surface free energy. This stshrink-age ended when the final temperature was reached (1200 °C). It was observed that the primary mechanism was bulk diffu-sion (n = 1.0), owing to the nanometric size of the particles. Linear shrinkage rates of 9.96, 8.08 and 5.86% corresponded to the point of maximum linear shrinkage of C03, C05 and C07, respectively (Table 2). The activation energy presented typical values for this stage, ranging from 35.22 kJ/mol to 45.06 kJ/mol.
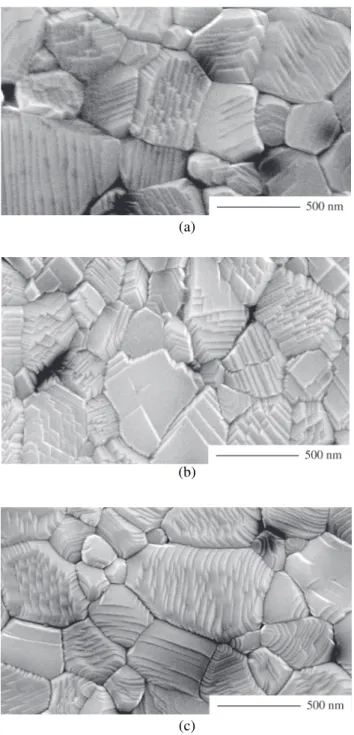
Figures 3, 4 and 5 depict the sintering process of C03, C05 and C07 through SEM micrographs. Figures 3a, 3b and 3c show the linear shrinkage (∆L/L0) at 800 °C (initial stage) for C03, C05 and C07, which correspond to the fol-lowing linear shrinkage hates: 0.58; 1.15; and 0.23%, re-spectively. In this test configuration it was observed that the early stage of neck growth occurred between two particles. This level coincided with the initial stage, in which the struc-tural rearrangement of nanoparticles with a viscous flow characteristic is dominant.
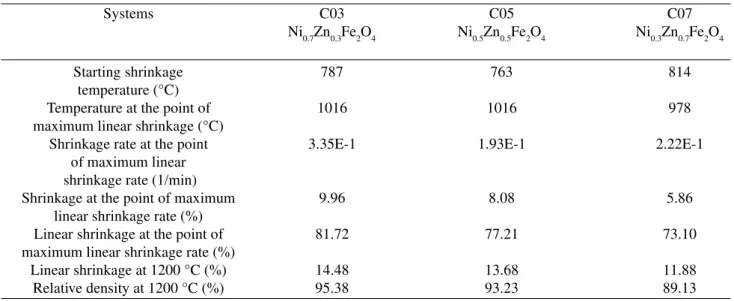
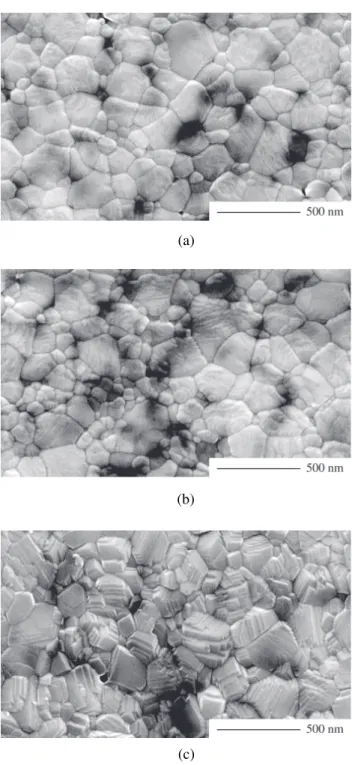
Figures 4a, 4b and 4c show the microstructures of C03, C05 and C07 at 1000 °C, which corresponds to the tempera-ture at which the maximum linear retraction occurred (end of intermediate stage). From this point on, grain growth took place owing to decreasing surface free energy. The linear shrinkage and average grain size found at this temperature were 9.19; 7.52 and 6.89% and 0.17 ± 0.81 µm; 0.18 ± 0.93 µm and 0.19 ± 0.82 µm for C03, C05 and C07, respectively. Figures 5a, b and c show the microstructures of the sys-tems C03, C05 e C07 at 1100 °C. In this temperature the Figure 2. T2(
∆L/Lo)/dt vs.∆L/Lo calculated through Bannister’s equation. for systems C03, C05 and C07 with a constant heating rate of 5 °C/min.
Table 3. Sintering parameters with a constant heating rate (CHR) of 5 °C/min for C03, C05 and C07 sintered at 1200 °C; Q = activation energy, n = sintering coefficient.
Systems Stages Q (kJ/mol) n
C03 Initial 242.70 -0.1877
Ni0.7Zn0.3Fe2O4 Intermediate 106.65 -0.566
End 35.44 -1.417
C05 Initial 214.61 -0.1023
Ni0.5Zn0.5Fe2O4 Intermediate 74.45 -0.3095
End 35.22 -1.088
C07 initial 224.39 -0.2579
Ni0.3Zn0.7Fe2O4 Intermediate 136.45 -0.2075
evolution of the grain growth is observed (coarsening) in the final of sintering. The linear shrinkage and the average grain size of certain grain was 13.89; 11.38 and 10.45% and 0.44 ± 0.15 µm; 0.35 ± 0.13 µm and 0.41 ± 0.19 µm for the systems C03, C05 and C07, respectively.
(a)
(b)
(c)
Figure 4. SEM Micrographs of: a) C03; b) C05; c) C07 at 1000 °C, with a CHR of 5 °C/min.
4. Conclusions
Based on the results of the investigation on sintering with a constant heating rate (CHR) reported on herein, the following conclusions were reached: (i) increases in Zn2+
content affected the sintering kinetics of Ni-Zn
Figure 3. SEM Micrographs of a) C03, b) C05, c) C07 at 800 °C, with a CHR of 5 °C/min.
(a)
(b)
(a)
(b)
(c)
Figure 5. SEM micrographs of: a) C03; b) C05; c) C07 at 1100 °C, with a CHR of 5 °C/min.
nanopowders, reducing the maximum densification rate and final density of the samples, but leaving the sintering mecha-nism unchanged; (ii) the sintering coefficient, calculated for the initial and intermediate stages of the three systems, was
n ~ 0, indicating that the predominant mechanism in these stages was structural rearrangement of nanoparticles, with a viscous flow characteristic; (iii) in the final stage, the pre-dominant mechanism governing the sintering of nanopowders in the three systems was bulk diffusion (n ~ 1).
Acknowledgements
We would like to thank the Brazilian institutions, FAPESP and CAPES for financial support.
References
1. Varela, J.A.; Longo, E. Cerâmica, v. 30, n. 172, p. 95-102, 1994.
2. German, R.M. Sintering Theory and Practice. Ed. John Wiley & Sons, New York, 1996.
3. Dias, A.; Mohallem, N.D.S.; Moreira, R.L. Mater. Res. Bull., v. 33, n. 3, p. 475-486, 1998.
4. Shaw, N.J. Advanced ceramics - Powder Metallurgy In-ternational, v. 21, n. 3, p. 16-20, 1989.
5. Leite, E.R.; Longo, E. Anais do 38o CBC, v. 1, p. 126-131, 1994.
6. Hillman, S.H.; German, R.M. J. Mater. Sci., v. 27, p. 2641-2648, 1992.
7. Woolfrey, J.L.; Bannister, M.J. J. Am. Ceram. Soc., v. 55, n. 12, p. 390-394, 1972.
8. Woolfrey, J.L. J. Am. Ceram. Soc., v. 55, n. 8, p. 383-388, 1972.
9. Bacmann, J.J.; Cizeron, G. J. Am. Ceram. Soc., v. 51, n. 4, p. 209-212, 1968.
10. Levesque, P.; Gerlach, L.; Zneimer, J. Am. Ceram. Soc., v. 39, n. 3, p. 119-120, 1956.
11. Paulus, M. Phys. State Solid, v. 2, p. 1181-1196, 1962. 12. Paulus, M. Phys. State Solid, v. 2, p. 1325-1341, 1962. 13. Jain, G.C.; B.K. Das; Goel, N.C. Ind. J. Pure Appl.
Phys., v. 14, p. 87-92, 1976.
14. Parvatheeswara Rao, B.; Subba Rao, P.S.V.; Rao, K.H.
J. Phys. IV France, v. 7, p. C1-241-C1-242, 1997. 15. Cho, Y.S.; Schaffer, D.; Burdick, V.L.; Amarakoon, V.
R.W. Mater. Res. Bull., v. 34, n. 14-15, p. 2361-2368, 1999.
16. Costa, A.C.F.M. et al., J. Mater. Sci. v. 37, p. 1-4, 2002. 17. Costa, A.C.F.M.; Tortella, E.; Morelli, M. R.; Kiminami R.H.G. A., J. Metas. and Nanocrys. Mater., v. 14, p. 57-64, 2002.