*e-mail: [email protected]
Articles presented at the XV CBECIMAT, Natal - RN, November de 2002.
Coupled Stress-Strain and Electrical Resistivity Measurements
on Copper Based Shape Memory Single Crystals
Cezar Henrique Gonzaleza*, Ney Freitas de Quadrosa, Carlos José de Araújob, Michel Morinc, Gerard Guéninc
aUniversidade Federal de Pernambuco (UFPE), Departamento de Engenharia Mecânica
Av. Acadêmico Hélio Ramos, s/n, CDU, 50740-530 Recife - PE, Brazil bUniversidade Federal de Campina Grande, Departamento de Engenharia Mecânica
Av. Aprígio Veloso, 882, C.P. 10069, 58109-970 Campina Grande - PB, Brazil cInstitut National des Sciences Appliquées de Lyon (INSA), Groupe d’Études de Métallurgie
Physique et Physique des Matériaux, Bâtiment Blaise Pascal 7 Avenue Jean Capelle, 69621 - Villeurbanne - France
Received: January, 30, 2003; Revised: October, 13, 2003
Recently, electrical resistivity (ER) measurements have been done during some thermo-mechanical tests in copper based shape memory alloys (SMA’s). In this work, single crystals of Cu-based SMA’s have been studied at different temperatures to analyse the relationship between stress (σ) and ER changes as a function of the strain (ε). A good consistency between ER change values is observed in different experiments: thermal martensitic transformation, stress induced martensitic transformation and stress induced reorientation of martensite variants. During stress induced martensitic transformation (superelastic behaviour) and stress induced reorientation of martensite variants, a linear relationship is obtained between ER and strain as well as the absence of hys teresis. In conclusion, the present results show a direct evidence of martensite electrical resistivity anisotropy.
Keywords: shape memory effects, martensitic transformation, electrical resistivity, superelasticity
1. Introduction
Shape memory alloys (SMA’s) present different phe-nomena (one way shape memory effect, two way shape memory effect, superelasticity and rubber-like behaviour) which can be induced by changes in temperature and/or mechanical stress. All those effects are characterised by modifications in crystalline structure of the SMA. The elec-trical resistivity (ER) is one, among many others experi-mental techniques used to study these metallic alloys. Its main application is for determination of transformation tem-peratures, due to the susceptibility of ER to detect modifi-cations in the crystalline structure of the SMA undergoing phase transformation during heating and cooling1,2. ER is also used to measure the evolution of shape memory effect during ageing in parent phase and low temperature phase (martensitic stabilisation)3-6.
More recently, ER measurement has been used to fol-low the thermomechanical shape memory behaviour under applied load7. The ER is affected in this case by the strain, structural modifications, reorientation of martensite vari-ants and also by the introduction and rearrangement of de-fects8-10. The knowledge of ER behaviour during these events has special importance for technological applications. In-deed, it can be used to drive the material performance from electronic control.
Depending of the thermomechanical process, a poly-variant or a single poly-variant martensite can be induced from a
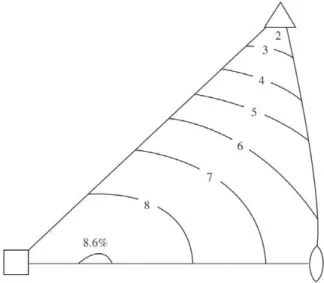
β-phase single crystal of copper based SMA. A cooling from the parent phase without applied stress produces a martensite phase with different orientation of variants (polyvariant -24 possible orientation of variants). The self-accommoda-tion process of martensite into SMA explains because the shape of the sample does not change significantly. It is also possible to obtain a single variant by stress induced martensitic transformation. From a single crystal of parent phase, each possible orientation of martensite corresponds to a different shear direction. For a fixed tensile axis, it is then possible to calculate a Schmidt factor for each one of the 24 possible variants. During superelastic tests at tem-peratures higher than the austenite finish temperature (T > AF), the stress induced variant is the one which leads to the highest Schmidt factor. The theoretical maximum re-coverable strain by superelasticity is calculated to be around 8.6% for Cu-Al-Ni SMA’s with a Schmidt factor close to 0.515. Figure 1 shows the obtained superelastic strain ver-sus the crystallographic direction of the tensile axis (in par-ent cubic phase coordinates).
In this work, electrical resistivity coupled with stress-strain measurements on single crystals of Cu-Zn-Al and
Cu-Al-Be SMA’s were performed using a special tensile machine. These measurements were carried out at different temperatures and for different crystallographic orientations of the samples in relation to the tensile axis.
2. Experimental Procedure
The Cu-Zn-Al and Cu-Al-Be alloys for this study were elaborated in an induction-melting furnace. Single crystals were prepared by a modified Bridgman method16. The Ta-ble 1 show the nominal chemical compositions of the stud-ied alloys with the respective phase transformation tempera-tures obtained by Differential Scanning Calorimetry (DSC, Mettler TA 3000) and electrical resistivity measurements.
Tensile samples with the following dimensions were prepared by electro-erosion: gage/gauge (useful) length = 10 mm, width = 4 mm and thickness = 1.2 mm. The superficial deformed layer was eliminated by chemical etching in an aqueous solution of 15% HNO3. Then the Sam-ples were annealed at 850 °C for 10 min and quenched into water at room temperature. After, its were aged at 100 °C during 1 h in order to eliminate excess of vacancies and to stabilise the order of the β phase.
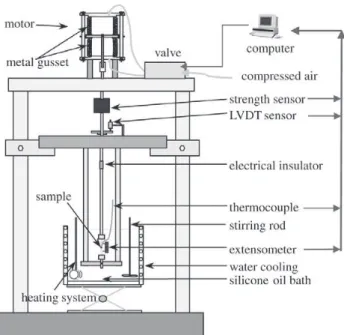
The samples were tested in a specific tensile machine specially designed to thermomechanical tests in SMA’s17. This machine, described in Fig. 2, has a pneumatic motor system that applies the mechanical loading directly on the sample without any dry friction. The temperature of the sam-ple is maintained constant and homogeneous by keeping it into a silicone oil bath with forced circulation. This system also allows perform thermal cycles between - 30 and 150°C. Tensile tests were carried out with a strain rate of 0.2%/min. After each test, the samples were heated up to 100 °C for elimination of possible residual martensite.
ER measurements are carried out by a conventional four terminal DC method. For these measurements a constant electrical current (i) pass through the sample and two con-duct wires are spot-welded on the sample close to the iso-lated ceramic grips of the extensometer for the measure-ment of the voltage signal (∆V), as shown in Fig. 3. As elec-trical current is always constant, the ER change in percent-age corresponds to the percentile change in ∆V.
The ER variations are calculated by Eq. 1, derived from Ohm’s law considering that thermoelastic martensitic trans-formation induces a negligible volume change9,11.
Table 1. Nominal chemical compositions and phase transformation temperatures of the studied alloys.
Sample Cu (wt.%) Al (wt.%) Zn (wt.%) Be (wt.%) AS (°C) AF (°C) MS (°C) MF (°C)
CZA 76.60 15.40 8.00 - 40 42 38 32
CAB-1 87.58 12.00 - 0.42 2 18 9 -11
CAB-2 87.52 12.00 - 0.48 -1 16 2 -13
(1)
where Rε and ρε are respectively the electrical resistance and electrical resistivity for a given strain ε, Rεo and ρεo corre-sponding to the properties in the initial state just before the test. Equation 1 is applied to obtain the true electrical
resis-tivity change by removing the contribution of geometrical alterations of the sample.
Some tensile samples were selected for in situ observa-tions of microstructural changes due to application of me-chanical loading. For this one, it was employed an optical microscope with an attachment apparatus for application of tensile load.
3. Results and Discussions
Figures 4 and 5 show the results obtained for Cu-Zn-Al and Cu-Al-Be alloys (samples CZA and CAB-1), respectively.
3.1. Thermal transformation
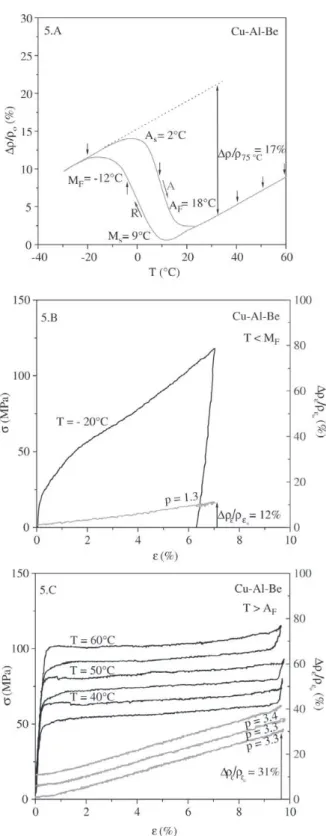
Figures 4a and 5a show the resistivity change versus temperature at zero stress, with indication of the phase trans-formation temperatures. The arrows indicate the tempera-tures chosen for tensile tests in each one alloy sample. Com-parison of these two figures shows that the resistivity in the martensitic phase is higher than the one of austenitic phase. After martensitic transformation by cooling, resistivity is increased of about 22% for Cu-Zn-Al and 17% in the case of Cu-Al-Be. This resistivity change corresponds to the for-mation of randomly oriented thermal martensite variants (self-accommodation phenomenon). It can also be noted that the hysteresis of Cu-Zn-Al is smaller (≈ 6 °C) than the one of Cu-Al-Be alloy (≈ 12 °C), both taken at the midway of cooling and heating curves.
3.2. Test in the martensitic phase
Figures 4b and 5b show the results obtained during ten-sile test in the martensite phase (at T < MF) for both sam-ples. In this case, the initial state of the sample is polyvariant martensite18. During the tensile test, the variant that has the highest Schmidt factor increases in the expense of the other variants19. Therefore, resistivity change is only due to the reorientation of martensite variants. The maximum values
obtained for are of the order of 15% for Cu-Zn-Al
and 12% for Cu-Al-Be alloy. The characteristic slopes of ER versus strain curves are indicated in the Figs. 4b and 5b,
denoted by p .
3.3. Test in the austenitic phase
Figures 4c and 5c show stress-strain and electrical re-sistivity changes measured at T > AF. In this region, the superelastic effect occurs due to appearance of martensite variants as a result of the applied stress20. Similarly to the case of thermal martensite, the hysteresis of stress induced martensite transformation is higher for the Cu-Al-Be in comparison with the Cu-Zn-Al alloy. In the case of the tests
Figure 2. Schematic representation of the pneumatic tensile ma-chine.
Figure4. Curves for the Cu-Zn-Al (CZA sample): a) Changes of ER for thermal induced martensitic transformation (σ = 0); b) Coupled test in the martensitic phase; c) Coupled test in the austenitic phase.
described by Figs. 4c and 5c, the obtained recoverable maxi-mum strain (εmax) is of the order of 5.9% for Cu-Zn-Al and 9.6% for Cu-Al-Be alloy. The observed resistivity change corresponds to the formation of single variants of martensite. These resistivity change values are higher than the ones corresponding to the formation of polyvariant thermal
martensite (Figs. 3a and 4a). The obtained values of
are of the order of 39% for Cu-Zn-Al and 31% for Cu-Al-Be alloy. Theses values, as well as the slopes of the ER curves, do not change with the temperature for T > AF. The ER curves are deliberately shifted along the y-axis for pres-entation because they are almost superposed. It can also be verified that the hysteresis of ER curves is negligible.
There-fore, for a same alloy, depends only of superelastic
strain. This can be explained by the fact that strain and elec-trical resistivity changes are directly proportional to the amount of stress induced martensite.
Experimental results obtained from Figs. 4 and 5 are summarised in Table 2. The operation A corresponds to
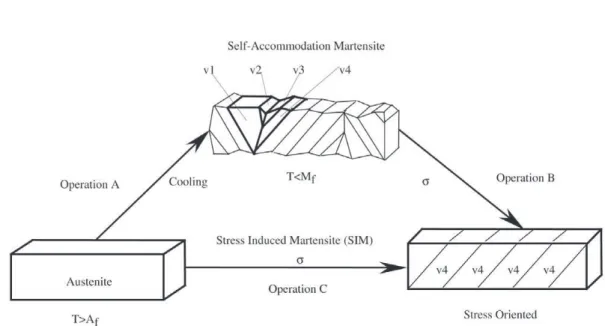
for-mation of a polyvariant martensite by simple thermal cycle. When this self-accommodating structure is stressed, the reorientation process is started, and only one variant be-comes dominant in the structure (operation B). The result of these operations (A + B = D) is a stress oriented single crystal martensite. In the line D of Table 2, the addition of electrical resistivity change corresponding to the two op-erations, A and B, is reported. The value of this sum is close to the variation of resistivity corresponding to operation C, where a single variant of martensite is directly stress in-duced from a single crystal of austenite. Therefore, a martensite single crystal has been obtained by two different ways, as schematised in Fig. 6.
These measurements show by two ways that the resis-tivity of a single variant obtained in a particular direction can be larger than the resistivity of the martensite phase with randomly oriented variants16. Therefore, it is clear that the martensite single crystal has a large resistivity anisotropy.
3.4. Superelasticity tests for different orientations of the tensile axis
Figure 7 shows the results for three superelasticity tests
Figure6. Schema of the two possible ways to obtain martensite single crystal16. Table 2. Resistivity changes for each process with the studied samples.
Operation Process Resistivity variation – ∆ρε/ρε (%) Cu-Zn-Al Cu-Al-Be
A Thermal martensite 22 17
B Reorientation of variants (T < MF) 15 12
C Induced single variant (T > AF) 39 31
at 40 °C with samples obtained from the same austenite single crystal, but with different orientations of the tensile axis (9 degrees of difference between each samples, in or-der a, b, c). The curves show the maximum strain by superelasticity that can be obtained with these samples. At the maximum strain, the samples are fully martensitic and it has been verified by optical microscopy that only one variant is present, as shown in Fig. 8.
Stress induced transformation and recoverable strain due to superelasticity are affected by changes in crystallographic orientations of the tensile axis15,18,20. The sample c presents
a maximum recoverable strain of about 7.0%, indicating that the Schmidt factor of the induced variant is near 0.5 (ten-sile axis direction close to <110> in β phase coordinates). For the sample a, the maximum strain is about 2.8% (ten-sile axis direction close to <111>). The Schmidt factor of the induced variant is then lowers than 0.5. It is significant that the stress necessary to reach this low strain is higher than the one verified in sample C. The stress (σ) vs. strain (ε) curves demonstrates that three martensitic single vari-ants with different crystallographic orientations was ob-tained.
Results of maximum strain and resistivity changes are indicated in Table 3 for the three samples. These results show that the difference between resistivity of austenite and martensite single variant is dependent on the crystallographic orientation of the variant. This observation can be made tak-ing into account that the austenitic phase is isotropic, once that copper based SMA’s have a body centred cubic struc-ture. Thus, the different values of martensitic phase resis-tivity obtained for each sample reveal the influence of the direction of resistivity measurement. Theses results also clearly indicates that martensitic crystal presents a large resistivity anisotropy.
4. Conclusion
Coupled stress-strain with electrical resistivity measure-ments during martensitic transformation of Cu-Zn-Al and Cu-Al-Be single crystals alloys have been under taken in this study. A martensite single crystal has been obtained by two different ways: stressing of self-accommodated
Figure7. Superelastic tests for samples with different crystallo-graphic orientations (CAB-2 sample).
martensite variants, which was produced by thermal trans-formation (variants reorientation process - operations A + B = D), and stressing directly from austenitic phase (stress induced martensite - operation C). The electrical re-sistivity changes of process D is very close to the one ob-tained from superelasticity test. This resistivity is also much higher than the one of the randomly oriented polyvariant of martensite. This fact can be explained by the high electric resistivity anisotropy of the martensitic phase. To confirm this hypothesis, single variants of martensite were induced from single crystals of austenite with different crystallo-graphic orientations. Electric resistivity measurements per-formed during the superelastic tests are a direct evidence of the dependence of resistivity with the direction of measure-ment in the martensitic phase (anisotropy).
Acknowledgements
Authors acknowledges the Coordenação de Aperfei-çoamento de Pessoal de Nível Superior (CAPES) and Conselho Nacional de Desenvolvimento Científico e Tecno-lógico (CNPq) for its financial support.
References
1. Stice, J.D.; Wayman, C.M. Metallurgical Transactions A, v. 13, p. 1687-1692, 1982.
2. Zhang, Y.; Hornbogen, E. Zeitschrift für Metalkunde, n. 78, v. 11, p. 777-783, 1987.
3. Van Humbeeck, J.; Janssen, J.; Mwamba, N.; Delaey, L. Scripta Metallurgica, v. 18, p. 893-898, 1984.
4. Mantel, M.; Rapacioli, R.; Guénin, G. Proceedings of
Table 3.Resistivity changes for samples with different crystallo-graphic orientations.
Sample A B C
Maximum recoverable strain - εmax (%) 2.9 5.3 7.2 Resistivity changes between austenite
and martensite - ∆ρε/ρεο (%) 30 44 50
the International Conference on the Martensitic Trans-formations, Japan, The Japan Institute of Metals, p. 880-885, 1986.
5. Ahlers, M.Proceedings of the International Conference on the Martensitic Transformations, Japan, The Japan Institute of Metals, p. 786-793, 1986.
6. Suzuki, T.; Kojima, R.; Fujii, Y.; Nagasawa, A. Acta Metallurgica, v. 37, p. 163-168, 1989.
7. Airoldi, G.; Ranucci, T.; Riva, G. Journal de Physique IV, v. 4, p. 439- 443, 1991.
8. Airoldi, G.; Ranucci, T.; Riva, G.; Sciacca, A. J. Phys.: Condens. Matter, v. 7, p. 3709-3720, 1995.
9. De Araújo, C.J.; Morin M.; Guénin, G. Materials Sci-ence and Engineering, v. A273, p. 305-309, 2000. 10. Gonzalez, C.H.; Quadros, N.F.; De Araújo, C.J.; Morin,
M.; Guénin, G. Proceedings of the European Sympo-sium on Martensitic Transformations and Shape-Memory - ESOMAT 2003, Cirencester, England, in press.
11. Airoldi, G.; Ranucci T.; Riva, G.; Sciacca, A. Journal of Phys.: Condens. Matter, v. 7, 3709-3720, 1995. 12. De Araújo, C.J.; Gonzalez, C.H.;, Morin, M.; Guénin,
G. Materials Research, v. 4, n. 1, p. 181-188, 2001. 13. Airoldi, G.; Ranucci T. Materials Research Society, Mat.
Res. Soc. Symp. Proc., v. 459, p. 323-328, 1997. 14. Pozzi, M.; Airoldi, G. Materials Science and
Engineer-ing, v. 273, 300-308, 1999.
15. Otsuka, K.; Shimizu, K. International Metals Reviews, v. 31, n. 3, p. 93-114, 1986.
16. Gonzalez, C.H. PhD Thesis: Institut National des Sci-ences Appliquées de Lyon, France, 184 p., 2002. 17. Bigeon M.J.; Morin M. Journal de Physique IV, v. 2,
p. 85-389, 1995.
18. De Vos, J.; Delaey, L.; Aernoudt, E. Zeitschrift für Metalkunde, v. 69, n. 8, p. 511-517, 1978.
19. Delaey, L.; Krishnan, R.V.; Tas, H.; Warlimont H. Jour-nal of Materials Science, 1974, v. 9, p. 1521-1535, 1974. 20. Schroeder, T.A.; Wayman, C.M Acta Metallurgica, v. 27,