Corresponding author:
E-mail: [email protected]
Received: September 1st, 2016 Approved: January 2, 2017
How to cite: Nonaka AG, Batista MA, Costa ACS, Inoue TT, Bonadio TGM, Souza Junior IG. Kinetics of thermal transformation of synthetic maghemites into Al-hematites. Rev Bras Cienc Solo. 2017;41:e0160384.
https://doi.org/10.1590/18069657rbcs20160384
Copyright: This is an open-access article distributed under the terms of the Creative Commons Attribution License, which permits unrestricted use, distribution, and reproduction in any medium, provided that the original author and source are credited.
Kinetics of Thermal Transformation
of Synthetic Al-Maghemites into
Al-Hematites
Adriele Galeti Nonaka(1), Marcelo Augusto Batista(2)*, Antonio Carlos Saraiva da Costa(2), Tadeu Takeyoshi Inoue(2), Taiana Gabriela Moretti Bonadio(3) and Ivan Granemann de Souza Junior(2)
(1)
Universidade Estadual de Maringá, Departamento de Agronomia, Programa de Pós-graduação em Agronomia, Maringá, Paraná, Brasil.
(2)
Universidade Estadual de Maringá, Departamento de Agronomia, Maringá, Paraná, Brasil. (3)
Universidade Estadual de Maringá, Departamento de Física, Maringá, Paraná, Brasil.
ABSTRACT: Maghemite (γ-Fe2O3) and hematite (α-Fe2O3) are important iron oxides in Brazilian soils derived from basalt. Maghemite can transform into hematite when exposed to high temperatures. However, isomorphic substitution (e.g., Al3+) may largely influence this process. We analyzed the kinetics of thermal transformation of Al-maghemites into Al-hematites and some of its mineralogical aspects. Synthetic substituted maghemites with different degrees of Al-substitution (0.0, 1.0, 2.0, 2.9, 3.8, 5.6, 6.7, 10.0, 12.0, and 17.1 mol% Al) were subjected to a temperature of 500±10 °C for 0, 5, 10, 16, 64, 128, 192, 360, 720, 2160, 3600, 5040, and 6480 min. After thermal treatment, samples were characterized by X ray diffraction (XRD), differential thermal analysis (DTA), specific surface area (SSA) measurement, and total chemical analysis. XRD patterns were analyzed by Rietveld refinement, and maghemite and hematite contents were calculated using Rietveld refinement and the method proposed by Sidhu. Isomorphic substitution of Fe by Al increased the critical temperature of transformation and the time necessary for maghemite to hematite transformation. Rietveld refinement data showed a better fit than the data adjusted by the Sidhu method. Increasing isomorphic substitution also decreased lattice parameters and mean crystallite dimension (MCD) values in maghemite; but only c-dimension and MCD decreased with increasing Al-substitution in hematite. For maghemite, the SSA increased with isomorphic substitution, rising up to 5.9 mol% Al; for hematite, SSA increased linearly. SSA decreased with heating time, regardless of isomorphic substitution.
INTRODUCTION
In tropical regions, the weathering of basic rocks, such as basalt, andesite, and gabbro, leads to the formation of soils with high iron oxide contents (inclusive term for oxides, hydroxides, and oxyhydroxides) in the clay fraction (Tremocoldi, 2003). The most common iron oxides in highly weathered soils are goethite and hematite (Alleoni and Camargo, 1995), but in southern Brazil, in soils derived from basalt, maghemite represents almost 50 % of all iron oxides in the clay fraction (Costa et al., 1999). In a general way, it is difficult to study attributes of metallic oxides in soils because of their low concentration. They can be better evaluated when they are synthesized in the laboratory (Batista et al., 2010).
Maghemite is a reddish brown ferromagnetic iron oxide isostructural with magnetite. This oxide occurs in soils as the product of magnetite oxidation or as the product of heating other iron oxides in the presence of organic matter (Cornell and Schwertmann, 1996). Hematite is very stable and often the final member of the thermal transformation of other Fe-oxides (e.g., maghemite). Although frequently associated with red color in soils, Bigham et al. (1993) and Silva et al. (2010) affirmed that its color may vary from red to purple to gray according to particle size and oxidation state. Hematite is typical in soils of warm and drier climates, such as those from tropical and subtropical regions, where the presence of maghemite is also common (Cornell and Schwertmann, 1996). There are different paths to hematite formation. Hematite can be a product of direct or indirect magnetite oxidation (Goulart, 1994); in the latter case, maghemite is the intermediate member. Maghemite is derived from magnetite since its cubic unit cell is easily inherited from the cubic inverse spinel structure of magnetite (Fasiska, 1967). Pure magnetite (Fe3O4) and maghemite (γ-Fe2O3) are rarely, if ever, found in nature. Isomorphic substitution (IS) of Fe for different elements is common, if not a rule, among these minerals. In soils, Fe is mostly substituted by Al in maghemite, while Ti4+, Mg2+, Zn2+, and Mn2+ are common Fe-substituent elements in primary magnetite (Sidhu et al., 1980; Schwertmann and Fechter, 1984).
Solid phase transformation is a very common process among iron oxides and it is influenced by environmental conditions such as temperature, pH, and the existence of other solid phases, such as clay minerals and Fe3+ content (Glasauer et al., 1999; Schwertmann et al., 1999; Pullin and Cabaniss, 2003). Isomorphic substitution and thermal transformation may change some mineralogical properties in iron oxides: unit cell dimensions, specific surface area, solubility in different environments (Ruan and Gilkes, 1995; Gasser et al., 1996; Batista et al., 2008; Batista et al., 2011), and temperature of transformation (Sahoo et al., 2010). Some soil minerals are affected by heating in natural and managed fires (Yusiharni and Gilkes, 2012). The effects of burning on soil vary according to the duration and intensity of fire and soil type. Many studies show the change in agricultural soil mineralogy after burning (Ketterings et al., 2000; Wang et al., 2006; Terefe et al., 2008; Yusiharni and Gilkes, 2012).
Our hypothesis is that isomorphic substitution and thermal reaction can cause changes in mineralogical properties of maghemite and in the transformation temperature into hematite. In this study, we analyzed the kinetics of the solid phase thermal transformation of synthetic Al-maghemites into Al-hematites and some mineralogical and crystal chemical properties of the initial and final products.
MATERIALS AND METHODS
Maghemite synthesis
Magnetite synthesis was performed in an N2 atmosphere. After co-precipitation, a hand magnet easily and completely attracted the dark black material formed. This material was washed several times with distilled water to remove excess salt, then frozen and freeze-dried. After that, this black material was heated in a furnace in a free atmosphere to 250 °C for 4 h to produce maghemite.
Total chemical analysis
Powdered materials (~100 mg) were weighed into 2.5 mL Eppendorf tubes; 1.5 mL of concentrated HCl was then added and samples were kept for 7 days until complete dissolution was achieved. The samples were then diluted in a 250 mL volumetric flask, and total Al and Fe contents were determined by Atomic Absorption Spectroscopy (AAS). Isomorphic substitution values were calculated by using the percentage of elements in each sample:
IS (mol%) = {(Al3+/26.98) / [(Al3+/26.98) + (Fe3+/55.85)]} × 100
Differential thermal analysis
A Netzch STA 409 PC/PG device was used to determine differential thermal analysis (DTA). The temperature range was from 30 °C to 1000 °C and the heating rate 10 °C per minute under free atmosphere conditions.
Maghemite-to-hematite transformation
Synthetic maghemites with different degrees of IS were placed on rectangular mullite crucibles and heated in a muffle furnace at 500±10 °C. This temperature was chosen based on DTA analysis and on the literature (Sidhu, 1988). Each sample remained in the furnace for different times: 5, 10, 16, 64, 128, 192, 360, 720, 2160, 3600, 5040, and 6480 min. Immediately after heating, the samples were cooled in ice to interrupt the reaction (Sidhu, 1988) and then kept in plastic containers.
X ray diffraction (XRD)
The synthetic powdered materials were XRD analyzed in a Shimadzu XRD-6000 diffractometer by using CuKα radiation in a step-scanning mode (0.02 °2θ/1s). The resulting XRD patterns were used to estimate the proportion of each phase (maghemite and hematite) and the corresponding mean crystallite dimension (MCD) and lattice parameters by Rietveld refinement with DBWSTools 2.3 software (Bleicher et al., 2000). Rietveld refinement was carried out with samples containing 0.0, 5.6, and 12.0 mol% Al. This technique proposes fitting experimental and theoretical diffractograms through the Least Square Method (Young et al., 1995). According to Zielasko (2007), there are some statistical indicators that may be used during or after refinement to verify if the procedures were satisfactory. In this study, the weighted profile (Rwp) was used because it is considered one of the best indices to indicate refinement progress (Zielasko, 2007).
The method proposed by Sidhu (1988) to phase quantification considers the areas of XRD reflections of d220 and d113 for maghemite and hematite, respectively. Two curves were obtained with thirteen standards that contained pre-weighed quantities of the two minerals (0 to 100 %), one for area values and another for height values. These values were obtained by using Grams® 8.0 software. Equations from the linear fit would allow mineral quantification. In this study, height values for d220 (ŷ = -8.78 + 4.992
** x, R2 = 0.97) and d113 (ŷ = 285.19 - 2.84
pseudo-Voigt profile, Cu wavelength, and five cycles were used. For MCD studies, it was necessary to run an XRD pattern (lanthanum hexaboride) to refine its data for obtaining U, V, and W values on the same equipment used to analyze mineral samples.
Specific surface area (SSA)
The BET (Brunauer et al., 1938) specific surface area was measured by the N2 adsorption technique using a Quantachrome instrument (Monosorb, USA).
RESULTS AND DISCUSSION
Total chemical analysis
Degrees of isomorphic substitution in maghemite samples calculated by AAS results were 0.0, 1.0, 2.0, 2.9, 3.8, 5.6, 6.7, 10.0, 12.0, and 17.1 mol % Al.
Differential thermal analysis (DTA)
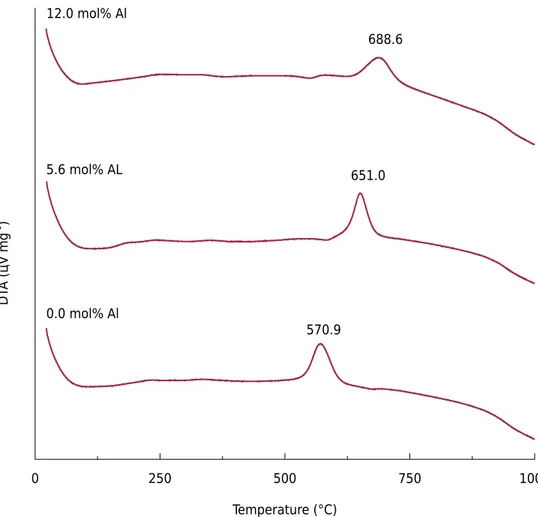
Maghemite DTA curves (Figure 1) were characterized by the presence of one intense exothermic peak between 570 and 690 °C. This peak indicated the temperature of thermal transformation from maghemite to hematite (Zhao et al., 2007) considering that the hexagonal phase is more stable than the cubic one (Mazo-Zuluaga et al., 2003).
A similar range of solid phase transformation temperatures (540 to 650 °C) was found by Sidhu (1988). The difference in temperature values was related to IS degrees. The temperature of maghemite-hematite transformation increased with increasing Cr content in the magnetite structure (Magalhães, 2008) and with Cu content (Nasrazadani and Raman, 1993; Costa et al., 1995; Mazo-Zuluaga et al., 2003). The higher the content of chemical elements,
Figure 1. Differential thermal analysis (DTA) to some Al-maghemites.
DT
A (цV mg
-1 )
0 250 500 750 1000
Temperature (°C) 12.0 mol% Al
5.6 mol% AL
0.0 mol% Al
570.9
688.6
the higher the energy necessary to eject or redistribute them. Thus, this additional energy would reduce the solid phase thermal transformation rate (Sidhu et al., 1980).
Differential thermal analysis results showed only endothermic peaks around 100 °C. David and Welch (1956) affirmed that synthetic maghemites have low water content because there are protons substituting Fe ions in the mineral structure and leading to the formation of OH-. Therefore, the endothermic peaks would represent the point at which this water content is lost.
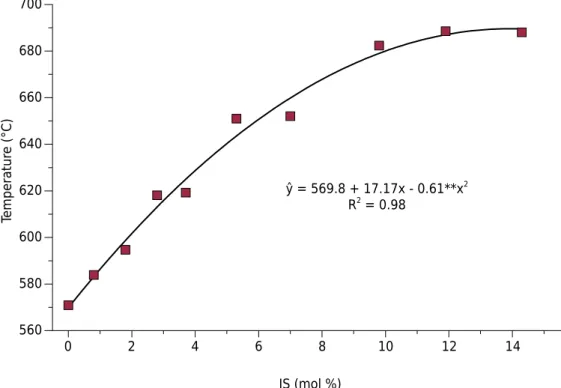
Increasing Al to Fe IS in the maghemite structure, the temperature of solid state transformation also increases (Figure 2). According to the equation in figure 2, the maximum temperature of transformation from maghemite to hematite reached 693 °C for maghemites containing 14.5 mol% Al.
X ray diffraction (XRD)
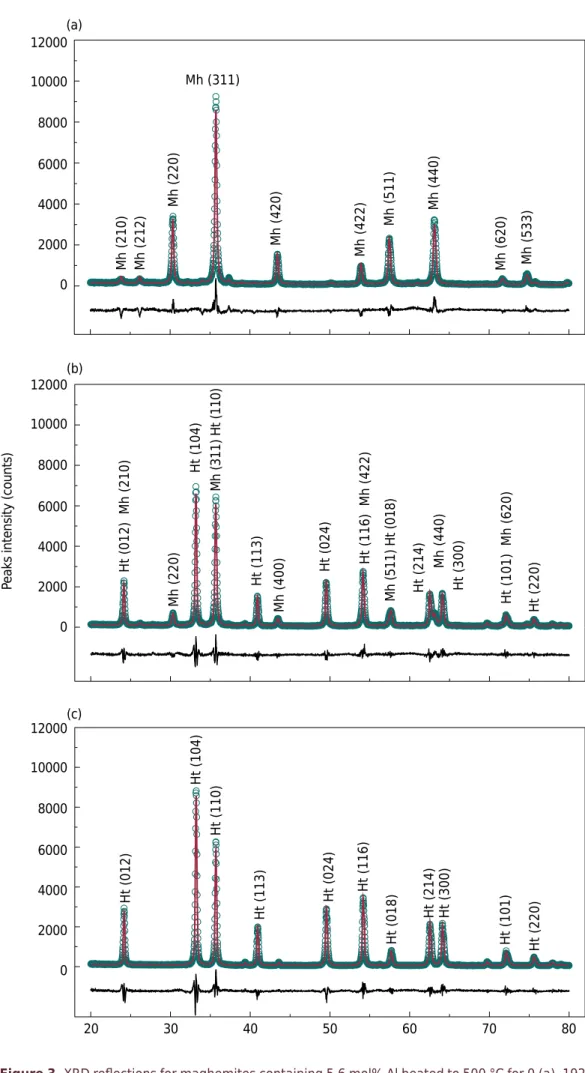
There was a reduction in maghemite and an increase in hematite intensity reflections with increased heating time (Figures 3a and 3b). Samples composed of both minerals, maghemite and hematite, represented most of studied samples. After adequate heating time, maghemites were transformed into hematites (Figure 3c). Rwp values ranged from 8 to 13 %, and they were similar to Rwp values found by Sileo et al. (2007), 8.4 to 12.9 %, for synthetic Cr-substituted hematites.
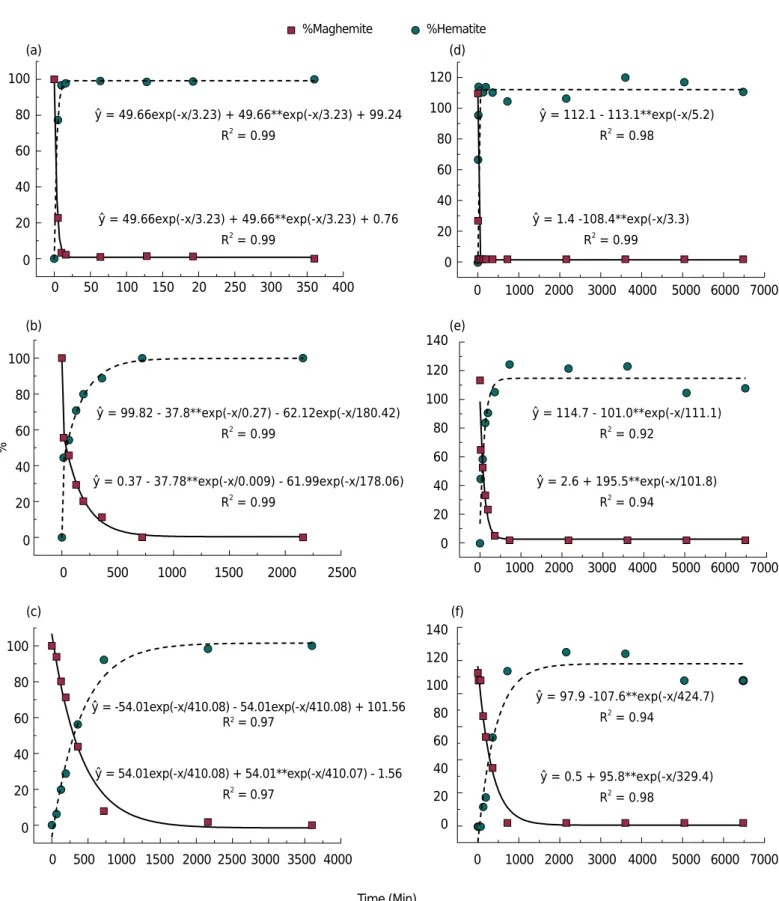
Kinetics of solid phase thermal transformation of Al-maghemites into Al-hematites at 500 °C can be observed in figure 4. Regardless of the model (Rietveld or Sidhu), the thermal transformation rate of maghemite into hematite decreased over time, and this rate was faster in the initial periods. Exponential models were statistically significant (p<0.01). Modeling by the Rietveld method had a better fit considering the coefficient of determination (R2). According to the Sidhu method (Figures 4d, 4e, and 4f), mineral contents were sometimes higher than 100 % or lower than 0 %.
For both methods of quantification (Rietveld or Sidhu), the higher the IS, the slower the reaction. Thus, 7.7, 332.8, and 916.4 min for the Rietveld method, and around 8.5, 156.5, and 1109.1 min for the Sidhu method were necessary to provide for 90 % reaction in
Te
mperatur
e (°C)
IS (mol %)
ŷ = 569.8 + 17.17x - 0.61**x2
R2
= 0.98
560
2
0 4 6 8 10 12 14 16
580 600 620 640 660 680 700
Figure 2. Critical temperatures of maghemite to hematite solid phase thermal transformation
Figure 3. XRD reflections for maghemites containing 5.6 mol% Al heated to 500 °C for 0 (a), 192
(b) and 2160 min (c). Mh (210) Mh (212)
Mh (220)
Mh (420)
Mh (422)
Mh (511)
Mh (440)
Mh (620) Mh (533)
Mh (311)
Ht (012)
Ht (104)
Ht (110)
Ht (113)
Ht (024) Ht (116)
Ht (018)
Ht (214) Ht (300)
Ht (101) Ht (220)
0 2000 4000 6000 8000 10000 12000
0
20 30 40 50 60 70 80
2000 4000 6000 8000 10000 12000
(a)
Mh (220)
Ht (104)
Ht (113) Ht (024)
Ht (012) Mh (210)
Mh (311) Ht (110)
Mh (511) Ht (018)
Mh (400)
Ht (116) Mh (422)
Ht (214)
Mh (440)
Ht (300)
Ht (101) Mh (620)
Ht (220)
0 2000 4000 6000 8000 10000 12000
(b)
(c)
Pe
maghemites containing 0.0, 5.6, and 12.0 mol% Al, respectively. Complete alteration from pure maghemite (0.0 mol% Al) occurred in 11.6 min and about 49 min for Rietveld and Sidhu quantification, respectively, but for the other substituted maghemites, greater heating time was necessary.
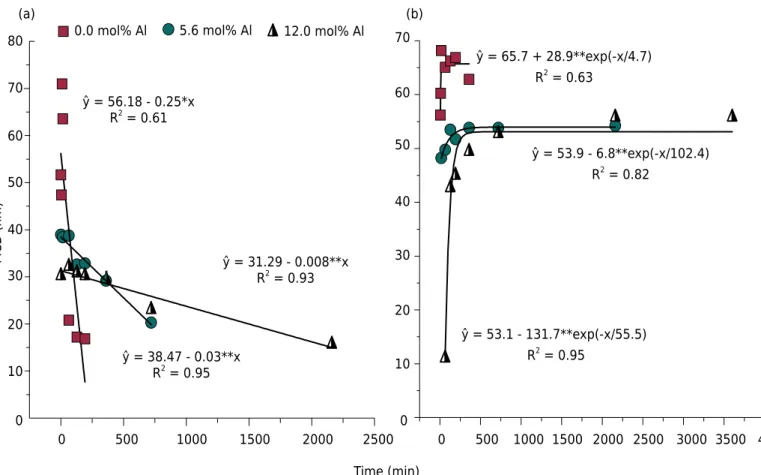
The MCD values for d220 reflection decreased linearly with heating time, whereas MCD values for d113 increased in an exponential manner (Figure 5). Sidhu (1988) used widths at half-maximum
ŷ = 49.66exp(-x/3.23) + 49.66**exp(-x/3.23) + 99.24 R2 = 0.99
ŷ = 112.1 - 113.1**exp(-x/5.2) R2 = 0.98
ŷ = 1.4 -108.4**exp(-x/3.3) R2 = 0.99
ŷ = 114.7 - 101.0**exp(-x/111.1) R2 = 0.92
ŷ = 2.6 + 195.5**exp(-x/101.8) R2 = 0.94
ŷ = 97.9 -107.6**exp(-x/424.7) R2 = 0.94
ŷ = 0.5 + 95.8**exp(-x/329.4) R2 = 0.98
ŷ = 49.66exp(-x/3.23) + 49.66**exp(-x/3.23) + 0.76 R2 = 0.99
ŷ = 99.82 - 37.8**exp(-x/0.27) - 62.12exp(-x/180.42) R2 = 0.99
ŷ = 0.37 - 37.78**exp(-x/0.009) - 61.99exp(-x/178.06) R2 = 0.99
ŷ = -54.01exp(-x/410.08) - 54.01exp(-x/410.08) + 101.56
R2 = 0.97
ŷ = 54.01exp(-x/410.08) + 54.01**exp(-x/410.07) - 1.56
R2 = 0.97
0 400 350 300 250 20 150 100 50
0 0 1000 2000 3000 4000 5000 6000 7000
2500 1500 2000 1000 500 0 3500 4000 Time (Min) 3000 2500 2000 1500 1000 500 0 7000 6000 5000 4000 3000 2000 1000 0 7000 6000 5000 4000 3000 2000 1000 0 20 40 60 80 100 (a) (d) (b) (e) (c) (f) 120 100 80 60 40 20 0 0 20 40 60 80 100 % 0 20 40 60 80 100 120 100 80 60 40 20 0 140 120 100 80 60 40 20 0 140 %Maghemite %Hematite
Figure 4. Kinetics of transformation for 0.0, 5.6 and 12.0 mol% Al by Rietveld (a, b and c) and Sidhu methods (d, e and f). **:
intensity of maghemite (d220) and hematite (d113) XRD reflections to determine crystal size. He observed that hematite crystals grew at the beginning of the transformation whereas the size of maghemite crystals was not much affected, which was also observed in this study. The MCD values and unit cell parameters when varying degrees of IS of Fe to Al are presented in table 1. It can be verified that for d220 and d113 reflections, MCD values decreased with increasing IS. Silva et al. (2013) observed that the average size of synthetized maghemite particles decreased with Fe to PVA [poly (vinyl alcohol)] substitution.
Variations in the crystal size of synthetic Al-maghemites, from 18 to 55 nm, and for Al-hematites, from 21 to 45 nm, were found by Sidhu (1988). Variations from 16.8 to 51.6 nm (0.0 mol% Al), from 20.3 to 38.9 nm (5.6 mol% Al), and from 15.6 to 32.2 nm (12.0 mol% Al) were found in this study. In hematites, the range was from 56.2 to 62.8 nm (0.0 mol% Al), from 48.2 to 54.2 nm (5.6 mol% Al), and from 11.0 to 55.8 nm (12.0 mol% Al). Pereira (2009) found MCD values of 34 and 64 nm for two natural rhombohedral hematites with the probable presence of Al (samples also contained kaolinite and gibbsite with residual Al content). Batista et al. (2008) studied Zn-substituted maghemites and observed a linear relationship between MCD and IS. In their study, MCD values decreased with increasing substitution. In a similar study, Batista et al. (2010) observed the same behavior for Al-substituted maghemites. Schwertmann and Fechter (1984) observed that maghemites from highly weathered soils with a high degree of Fe substitution for Al had significantly lower unit cell dimensions than pure maghemites because Al3+ has smaller ionic radii than Fe3+.
Unit cell parameters in both minerals decreased with increasing IS (Table 1). Considering that Al3+ has smaller ionic radii than Fe3+, IS decreases unit cell parameters. Pereira (2009) found 0.504 nm (a=b) and 1.375 nm (c), 0.504 nm (a=b) and 1.377 nm (c), for unit cell parameters for natural Al-hematites from itabirite (Quadrilátero Ferrífero – Minas Gerais), which was similar to the values found in this study (Table 1). In Al-substituted goethite, for example, the strongest linear relationship between individual unit cell dimensions and
Figure 5. Mean crystallite dimention (MCD) values of the d220 (a) (maghemite) and d113 (b) (hematite) reflexes for Al-maghemites
submitted to different heating times. ** and *: significant at 1 and 5 % by the t test, respectively.
Time (min)
0 500 1000 1500 2000 2500 3000 3500 4000
0 10 20 30 40 50 60 70
0 500 1000 1500 2000 2500
0 10 20 30 40 50 60 70 80
(a) (b)
ŷ = 56.18 - 0.25*x R2
= 0.61
ŷ = 65.7 + 28.9**exp(-x/4.7) R2
= 0.63
ŷ = 31.29 - 0.008**x R2
= 0.93
ŷ = 38.47 - 0.03**x R2
= 0.95
ŷ = 53.1 - 131.7**exp(-x/55.5) R2
= 0.95
ŷ = 53.9 - 6.8**exp(-x/102.4) R2
= 0.82
MCD (nm)
IS appeared in the c-dimension, and for hematite/corundum and boehmite/lepidocrocite systems, the same was true for the a-dimension (Kirwan et al., 2009). However, in the present study, variations in the hematite c-dimension were more pronounced than variations in the a- and b-dimensions. Sileo et al. (2007) observed some results for synthetic Cr-hematites: the a-parameter changed in a non-ordinate way and c-values increased throughout the series. The authors expected both parameters to decrease because of the smaller size of Cr³+ ions. However, thermal analyses showed an increase in OH- content, and the increase in the c-dimension was attributed to the presence of increasing stacking faults. The a- and c-parameters decreased with increasing Fe-to-Cr substitution.
Specific surface area (SSA)
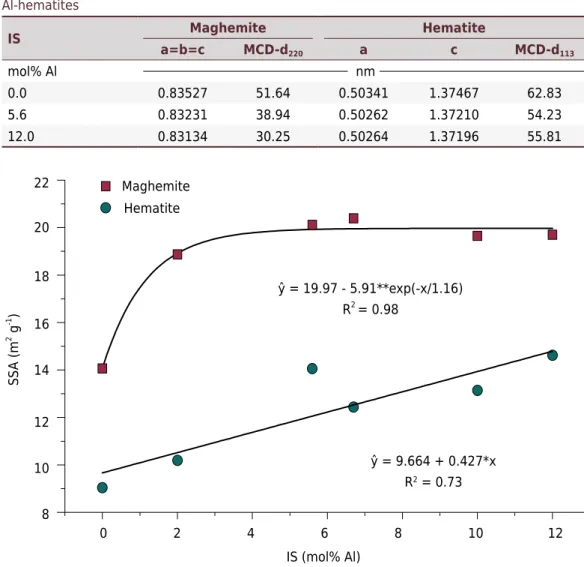
Specific surface area (SSA) values of the synthetic maghemite increased up to 5.9 mol% Al, reaching 20.0 m2 g-1 (Figure 6). For synthetic hematite, SSA results increased linearly, reaching 14.8 m2 g-1 at 12.0 mol% IS (Figure 6). Increasing SSA values are consistent with decreasing MCD values (Table 1). Substitution of Fe for Al atoms within the crystal structure of synthetic maghemites hampers crystal growth on all faces of the cubic structure. For most Fe oxides, the presence of metals with smaller ionic radii reduces crystal size, enhances specific surface area, and decreases MCD (Cornell and Schwertmann, 1996). Sidhu (1988) found a mean SSA value of 17.3 m2 g-1 in Al-maghemites and 6.7 m2 g-1 in Al-hematites. In this study, mean values for Al-maghemites and Al-hematites were 18.6 and 12.5 m² g-¹, respectively. So, transformation of maghemite to hematite reduced surface area as the result of increasing particle size.
Table 1. Mean crystallite dimension (MCD) and unit cell parameter values for Al-maghemites and Al-hematites
IS Maghemite Hematite
a=b=c MCD-d220 a c MCD-d113
mol% Al nm
0.0 0.83527 51.64 0.50341 1.37467 62.83
5.6 0.83231 38.94 0.50262 1.37210 54.23
12.0 0.83134 30.25 0.50264 1.37196 55.81
0 8
10 12 14 16 18 20 22
2 4 6 8 10 12
IS (mol% Al)
SS
A (m
2 g -1 )
ŷ = 19.97 - 5.91**exp(-x/1.16)
R2
= 0.98 Maghemite
Hematite
ŷ = 9.664 + 0.427*x
R2 = 0.73
Figure 6. Specific surface area (SSA) behavior due to Fe to Al substitution in maghemite and
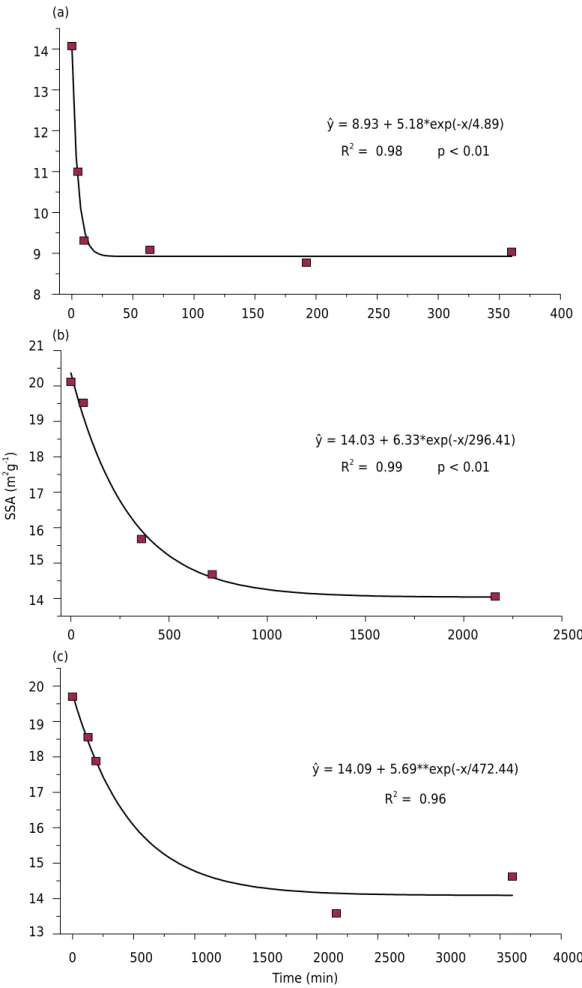
The SSA values decreased exponentially with increased heating time (Figure 7). On average, the SSA of maghemite tended to be higher than the SSA of the thermal hematite produced
Figure 7. Specific surface area (SSA) values to maghemites-hematite with 0.0 Al (a), 5.6 Al (b)
and 12.0 mol% Al (c) when submitted to different heating times. **: significant at 1 % by the t test.
0 13 14 15 16 17 18 19 20
(c)
500 1000 1500 2000
Time (min)
2500 3000 3500 4000
ŷ = 14.09 + 5.69**exp(-x/472.44)
R2 = 0.96
(b)
14 15 16 17 18 19 20
SS
A (m
2 g -1 )
21
2500 2000
1500 1000
500 0
ŷ = 14.03 + 6.33*exp(-x/296.41)
R2
= 0.99 p < 0.01 (a)
8 9 10 11 12 13 14
400 350
300 250
200 150
100 50
0
ŷ = 8.93 + 5.18*exp(-x/4.89)
R2
(Cornel and Schwertamn, 1996). Values ranged from 8 to 130 m2 g-1 in maghemite and from 2 to 90 m2 g-1 in hematite.
CONCLUSIONS
Increasing isomorphic substitution requires more time, and the temperature necessary for solid state thermal transformation of maghemite into hematite was up to 693 °C. The transformation kinetics data fit to the Rietveld model were better than those fitted to the Sidhu model.
Maghemite unit cell parameters and MCD values decrease with increased IS. However, for hematite, only the c- dimension and MCD decrease with increased IS.
Upon increasing heating time from 0 to 6480 min, maghemite MCD values decrease, regardless of the degree of IS; however, the effect is less pronounced for the highest degree of IS. For hematite, MCD values increase over time until stabilizing at about 128 min (0.0 mol% Al), 360 min (5.6 mol% Al), and 2160 min (12.0 mol% Al); the lower the IS, the shorter the time required.
Specific surface area values decrease with heating time; thus, the SSA of maghemite decreased when transformed into hematite.
ACKNOWLEDGMENTS
M.A. Batista thanks the CNPq (Conselho Nacional de Desenvolvimento Científico e Tecnológico) for financial support (Process No. 474142/2012-4).
REFERENCES
Alleoni LRF, Camargo OA. Óxidos de ferro e de alumínio e a mineralogia da
fração argila deferrificada de Latossolos ácricos. Sci Agric. 1995;52:416-21.
https://doi.org/10.1590/S0103-90161995000300002
Batista MA, Costa ACS, Bigham JM, Santana H, Zaia DAM, Souza Junior IG. Mineralogical,
chemical, and physical characterization of synthetic Al-substituted maghemites (γ-Fe2-xAlxO3).
Clays Clay Miner. 2010;58:451-61. https://doi.org/10.1346/CCMN.2010.0580401
Batista MA, Costa ACS, Bigham JM, Souza Junior IG, Jones FS. Acid dissolution kinetics of synthetic Al-substituted maghemites (g-Fe2-xAlxO3). Soil Sci Soc Am J. 2011;75:855-61.
https://doi.org/10.2136/sssaj2010.0344
Batista MA, Costa ACS, Souza Junior IG, Bigham JM. Cristallochemical characterization of
synthetic Zn-substituted maghemites (γ-Fe2-xZnxO3). Rev Bras Cienc Solo. 2008;32:561-8.
https://doi.org/10.1590/S0100-06832008000200011
Bigham JM, Ciolkosz EJ. Soil Color. Madison: Soil Science Society of America; 1993. (SSSA Special publication, 31).
Bleicher L, Sasaki JM, Santos COP. Development of a graphical interface for the Rietveld refinement
program DBWS. J Appl Cryst. 2000;33:1189. https://doi.org/10.1107/S0021889800005410
Brunauer S, Emmett PH, Teller E. Adsorption of gases in multimolecular layers. J Am Chem Soc. 1938;60:309-19. https://doi.org/10.1021/ja01269a023
Cornell RM, Schwertmann U. The Iron Oxides: structure, properties, reactions, occurrence and uses. 2nd ed. Weinheim: Willey-VHC GmbH & Co. KGaA; 1996.
Costa ACS, Bigham JM, Rhoton FE, Traina SJ. Quantification and characterization of maghemite
Costa GM. Mössbauer spectroscopy and X-ray diffraction studies of maghemite (γ-Fe2O3)
and aluminum-substituted maghemites [γ(Fe1-yAly)2O3] with 0.0 ≤ y ≤ 0.66 [thesis].
Belgium: Ghent University; 1995.
David I, Welch AJE. The oxidation of magnetite and related spinels. Constitution of gamma ferric oxide. Trans Faraday Soc. 1956;52:1642-50. https://doi.org/10.1039/tf9565201642
Fasiska EJ. Structural aspects of the oxides and oxidehydrates of iron. Corros Sci. 1967;7:833-9. https://doi.org/10.1016/S0010-938X(67)80116-1
Gasser UG, Jeanroy E, Mustin C, Barres O, Nüesch R, Berthelin J, Herbillon AJ. Properties of synthetic goethites with Co for Fe substitution. Clay Miner. 1996;31:465-76.
https://doi.org/10.1180/claymin.1996.031.4.03
Glasauer S, Friedl J, Schwertmann U. Properties of goethites prepared under acidic and basic conditions in the presence of silicate. J Colloid Interf Sci. 1999;216:106-15. https://doi.org/10.1006/jcis.1999.6285
Goulart AT. Propriedades estruturais e magnéticas de óxidos de ferro presentes em solos
magnéticos oriundos de basalto e tufito [tese]. Belo Horizonte: Universidade Federal de Minas
Gerais; 1994.
Ketterings QM, Bigham JM, Laperche V. Changes in soil mineralogy and texture caused
by slash-and-burn fires in Sumatra, Indonesia. Soil Sci Soc Am J. 2000;64:1108-17.
https://doi.org/10.2136/sssaj2000.6431108x
Kirwan LJ, Deeney FA, Croke GM. Hodnett K. Characterisation of various Jamaican bauxite ores
by quantitative Rietveld X-ray powder diffraction and 57
Fe Mössbauer spectroscopy. Int J Miner Process. 2009;91:14-8. https://doi.org/10.1016/j.minpro.2008.11.001
Magalhães F. Síntese e caracterização de óxidos de ferro e compósitos para aplicações no
tratamento redox de efluentes aquosos [tese]. Belo Horizonte: Universidade Federal de Minas
Gerais; 2008.
Mazo-Zuluaga J, Barrero CA, Díaz-Terán J, Jerez A. Thermally induced
magnetite-haematite transformation. Hyperf Interact. 2003;148/149:153-61.
https://doi.org/10.1023/B:HYPE.0000003776.84005.89
Nasrazadani S, Raman A.The application of infrared spectroscopy to the study of
rust systems-II. Study of cation deficiency in magnetite (Fe304) produced during its
transformation to maghemite (γFe203) and hematite (α-Fe203). Corros Sci. 1993;34:1355-65.
https://doi.org/10.1016/0010-938X(93)90092-U
Pereira MC. Preparação de novos catalisadores do tipo fenton heterogêneos à base de óxidos de ferro formados em litologia de Itabirito [tese]. Belo Horizonte: Universidade Federal de Minas Gerais; 2009.
Pullin MJ, Cabaniss SE. The effects of pH, ionic strength, and iron-fulvic acid
interactions on the kinetics of non-photochemical iron transformations: I. Iron(II) oxidation and iron(III) colloid formation. Geochim Cosmochim Acta. 2003;67:4067-77. https://doi.org/10.1016/S0016-7037(03)00366-1
Ruan HD, Gilkes RJ. Dehydroxylation of aluminous goethite: unit cell
dimensions, crystal size and surface area. Clays Clay Miner. 1995;43:196-211. https://doi.org/10.1346/CCMN.1995.0430207
Sahoo SK, Agarwal K, Singh AK, Polke BG, Raha KC. Characterization of γ- and α-Fe2O3 nano
powders synthesized by emulsion precipitation-calcination route and rheological behavior of
α-Fe2O3. Int J Eng Sci Technol. 2010;2:118-26. https://doi.org/10.4314/ijest.v2i8.63841
Schwertmann U, Cornell RM. Iron oxides in the laboratory - Preparation and characterization. Weinheim: VCH; 1991.
Schwertmann U, Fechter H. The influence of aluminum on iron oxides: XI.
Aluminum-substituted maghemite in soils and its formation. Soil Sci Soc Am J. 1984;48:1462-3. https://doi.org/10.2136/sssaj1984.03615995004800060054x
Sidhu PS, Gilkes RJ, Posner AM. The behavior of Co, Ni, Zn, Cu, Mn and Cr in magnetite during alteration to maghemite and hematite. Soil Sci Soc Am J. 1980;44:135-8. https://doi.org/10.2136/sssaj1980.03615995004400010028x
Sidhu PS. Transformation of trace element-substituted maghemite to hematite. Clays Clay Miner. 1988;36:31-8. https://doi.org/10.1346/CCMN.1988.0360105
Sileo EE, Daroca DP, Barrero CA, Larralde AL, Giberti MS, Saragovi C. Influence of the genesis on the structural and hyperfine properties of Cr-substituted hematites. Chem Geol.
2007;238:84-93. https://doi.org/10.1016/j.chemgeo.2006.10.017
Silva AR, Souza Junior IG, Costa ACS. Suscetibilidade magnética do horizonte B de solos do Estado do Paraná. Rev Bras Cienc Solo. 2010;34:329-37. https://doi.org/10.1590/S0100-06832010000200006
Silva MF, Oliveira LAS, Ciciliati MA, Silva LT, Pereira BS, Hechenleither AAW, Oliveira DMF, Pirota KR, Ivashita FF, Paesano Jr A, Pastor JM, Pérez-Landazábal JI, Pineda EAG. Nanomateric
particle size and phase controlled synthesis and characterization of γ-Fe2O3 or (α+γ)-Fe2O3 by a
modified sol-gel method. J Appl Phys. 2013;114:104311-1-7. https://doi.org/10.1063/1.4821253 Terefe T, Mariscal-Sancho I, Peregrina F, Espejo R. Influence of heating on various
properties of six Mediterranean soils. A laboratory study. Geoderma, 2008;143:273-80. https://doi.org/10.1016/j.geoderma.2007.11.018
Tremocoldi WA. Mineralogia dos silicatos e dos óxidos de ferro na fração argila de solos desenvolvidos de rochas básicas no estado de São Paulo. Rev Bras Biocienc. 2003;9:15-22.
Wang H, Xu B, Smith P, Davies M, Desilva L, Wingate C. Kinetic modeling of gibbsite dehydration/amorphization in the temperature range 823-923K. J Phys Chem Solids. 2006;67:2567-82. https://doi.org/10.1016/j.jpcs.2006.07.016
Young RA, Sakthivel A, Moss TS, Paiva-Santos CO. DBWS-9411 - an upgrade of the DBWS*.* programs for Rietveld refinement with PC and mainframe computers. J Appl Cryst.
1995;28:336-7. https://doi.org/10.1107/S0021889895002160
Yusiharni E, Gilkes RJ. Changes in the mineralogy and chemistry of a lateritic soil due to a bushfire at Wundowie, Darling Range, Western Australia. Geoderma. 2012;191:140-50.
https://doi.org/10.1016/j.geoderma.2012.01.030
Zhao B, Wang Y, Guo H, Wang J, He Y, Jiao Z, Wu M. Iron oxide(III) nanoparticles fabricated by
electron beam irradiation method. Mater Sci-Poland. 2007;25:1143-8.
Zielasko K. Obtenção e caracterização do sistema CoxFe2-xO4 [dissertação]. Ponta Grossa: