*e-mail: [email protected]
1. Introduction
Nowadays, advanced composites plays an important role in the aerospace industry. Aircraft brakes and rocket nozzle throats belongs to the class of carbon iber reinforced carbon (CFRC) which are components where the requirement to withstand high temperatures and thermal shock resistance is required1. CFRC composites are materials based on carbon ibers embedded by a carbon matrix. The refractory characteristic of CFRC composites makes them able to retain mechanical properties under high temperature environments. Processing of CFRC composites are layed on two main routes, named liquid route and gas phase route, which requires heat treatment cycles. In the liquid processing route, which uses pitch (thermoplastic) or thermoset resin, high temperature heat treatment gives rise to solid carbon composite by converting the organic matrix to a carbon matrix2,3. In the gas phase processing route, the decomposition from gaseous hydrocarbon (e.g., methane, propylene) result in carbons deposited on porous ibrous substrates. In this case, carbon gas bearing lux, temperature and pressure are tightly controlled and the process is called chemical vapor iniltration (CVI)4. Processing routes of CRFC composites have been described in the literature5,6.
Depending on application and design requirements thermoset resins based on phenol-formaldeyde are the most
used. Also, easy processing and reasonably carbon yield makes phenol-formaldyde polymers attractive for using as precursor matrix for CFRC composites7,8. Convertion of phenolic resin/carbon iber composites into CFRC composites is acomplished by rupture of the original molecular structure converting the polymer matrix to an amorphous carbon material by the action of heat9.
During heat treatment important microstructural changes occur in the phenolic resin/carbon iber composite which affect its thermomechanical behaviour10. The main microstructural change is related to the convertion of the polymer matrix (insulator) into a conductive carbon material, resulting from molecular rearrangement, release of evolved volatiles and pore and crack formation11-13. This also have an effect on physical properties, such as density, stiffness, strength, thermal conductivity, thermal expansion and electrical resistivity/conductivity. Therefore a number of experimental methods and techniques can be used for monitoring and measuring the progress of the heat treatment processes related to the convertion of a pristine phenolic resin/carbon iber composite into a CFRC composite. For instance, weight changes during heat treatment of carbon materials can be monitored by thermogravimetric techniques, and dimensional changes can be monitored by dilatometric techniques14.
Electrical Behavior of Carbon Fiber/Phenolic Composite during Pyrolysis
Williane Oliveira de Souzaa,b*, Kledermon Garciaa, Christian Frederico de Avila Von Dollingerc,
Luiz Claudio Pardinib,c
aDepartamento de Ciência e Tecnologia Aeroespacial, Divisão de Sistemas Aeronáuticos, Instituto de
Aeronáutica e Espaço – IAE, Praça Mal. Eduardo Gomes, 50, CEP 12228-904, São José dos Campos, SP, Brazil
bDepartamento de Ciência e Tecnologia Aeroespacial, Instituto Tecnológico de Aeronáutica – ITA,
Praça Mal. Eduardo Gomes, 50, CEP 12228-904, São José dos Campos, SP, Brazil
cDepartamento de Ciência e Tecnologia Aeroespacial, Divisão de Materiais, Instituto de Aeronáutica e
Espaço – IAE, Praça Mal. Eduardo Gomes, 50, CEP 12228-904, São José dos Campos, SP, Brazil
Received: July 17,2015; Revised: September 5, 2015
Carbon iber reinforced carbon (CFRC) composites, also called carbon/carbon (C/C) composites are materials with superior characteristics such as low density, good thermal shock resistance, high strength and low ablation under severe environments. Due to their properties, CFRC composites are ideal candidate in the high temperature ields. By pyrolysis process, carbon iber phenolic resin composites are converted in C/C composites. The phenolic resin is a non-conductor (electrical resistivity of 1012Ω.m) and during heat treatment of carbon iber phenolic resin composite, it is converted to a carbon matrix (a conductor). This conversion was accomplished by electrical resistivity measurements using four-probe method according to ASTM C611-98 with inal electrical resistivity of 0.04 mΩ.m. Microstructure of carbon iber phenolic resin composite was assessed by using optical microscopy and image analysis. Pore volume was evaluated and the results were compared with thermal gravimetric analyses. The values of activation energy (Ea) during pyrolysis were 1.153kJ.mol–1 and 10.860kJ.mol–1.
Electrical resistivity has long been used as technique for monitoring and quality control of several important industrial process, such as graphite manufacturing and SiC manufacturing15-17. So, changes in electrical resistivity (or electrical conduction) during processing can be associated to changes in materials microstructure, resulting in useful information for process understanding and as a quality control tool18,19. Farhan20, for instance, monitored the processing of CFRC composites by CVI technique using electrical resistivity technique. Carbon iber preform in the form of a needled punched felt with an apparent density of 0.18 g/cm3 was used. The carbon iber preform was itted to a furnace, and an electric current, low voltage, passed through the preform producing heat energy by Joule effect. As a result the pyrocarbon was deposited from natural gas (~98% CH4), up to reaction temperature. The carbonization temperature was set at 900-1200 °C. Electrical resistance varied from 0.10 to 0.44 Ω after 67 hours of deposition and a inal density of 1.78 g/cm3 was obtained.
Electrical resistivity (or electrical conductivity) of a solid material is a function of electronic charge multiplied by the electron movement e by the electron lux concentration, in the conductor21,22. Speciically, the direct current (DC) technique is based on the application of an electrical potential V [volts, J/C] through the body of a material, where a current of magnitude i [amperes, C/s] lows through it. In many materials at low voltage values the current is proportional to voltage (V) and the electrical resistance (R) in ohms, which is described by the Ohm´s law (i = V/R). The electrical
resistance (R) unlike electrical resistivity ( ρ) depends on the size and shape of the sample. The relationship between the electrical resistivity (ρ) and the electrical resistance (R) is given by Equation 1[23].
l R
A ρ
= (1)
Where l is length and A is cross-sectional area of material. Among the physical properties, the electrical resistivity can change signiicantly with temperature. According to Arrhenius law as far as the temperature increases the electrical resistivity decreases24,25.
Various experimental assemblies have been described in the literature for resistivity measurements. However, most of them refers to those employed at low temperature. Those employed at high temperature are designed to meet the speciic requirements of high thermo-mechanical applications26.
In this work, electrical resistivity was monitored during the progress of heat treatment of a 2D carbon iber/phenolic resin composite towards conversion to a CFRC composite up to 1000°C. Electrical resistivity measurements were carried out in the direction of ibers axis. The measurements of electrical resistivity were conducted in accordance with the ASTM C611–98[27] standard.
2. Material and Characterization
2.1. Material
A resole phenolic resin, tradename CR2830, supplied by SI Group Crios Resinas S.A, was used as carbon matrix source. CR2830 resin has molecular weight of 194 Daltons
and dynamic viscosity of 165 mPa.s/25°C. It begins to gel around 120°C, and its inal density is 1.22 g/cm3. An advantage of using resole type phenolic resin is its ability to crosslink by means of heat without incorporation of a curing agent28. The char yield of this resin is 55-60%/mass yield at 1000°C heat treatment in inert atmosphere.
The carbon iber fabric used in this work was a plain weave fabric, from Hexcel Co., areal weight 190g/m2, which is an aerospace grade high strength ex-PAN carbon iber (density 1.78g/cm3), heat treated at 1400-1500°C, according to the manufacturer.
2.2. Experimental
Carbon iber phenolic resin composites were made by stacking 10 plies of the plain weave fabric patterned in a 0/90° direction. The composite was molded by vacuum bag technique using a standard vacuum pump with a pressure of 0.7 MPa. Cure was done in hydraulic press, following a programmed cure cycle up to 180°C. The carbon iber weight fraction and matrix weight fraction after composites have been molded were ~65%/weight and ~35%/weight, respectively. Density of moulded carbon iber phenolic resin composite was 1.50 g/cm3. After moulding, composites were trimmed to approximate dimensions of 10 mm width, 110 mm length and 4 mm thickness.
For evaluate the weight loss, thermogravimetric analysis (TGA) was done in the carbon iber/phenolic resin composite, using N2 atmosphere (10 mL/min lux), from 25°C up to 1000°C, under a heating rate of 10°C/min. The TGA tests were performed using Perkin Elmer equipment model TGA7HT.
Measurements of electrical resistivity were performed
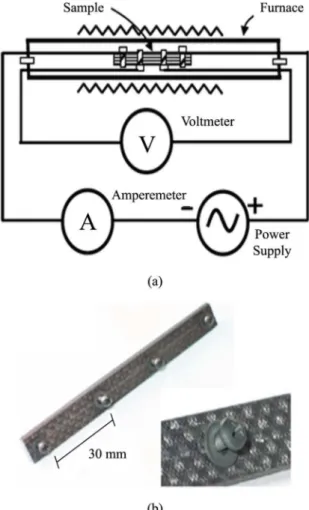
in situ during the heat treatment from room temperature up to 1000oC. The heat treatment was done in a EDG furnace, model EDGCON 5P, under nitrogen atmosphere, gas lux of ~2 L/min, and heating rate of 3 °C/min. The samples were ixed by four equidistant (30 mm) steel screws used as probes for current and potential. Electrical Kanthal A1 wires of about 0.5 mm diameter were itted to the screws, as shown by Figure 1a, b. The experimental set-up of the electrical resistivity measurements, as well as the specimens, are shown in Figure 1a, b, respectively Figure 1.
scale (256 gray shade levels), (3) threshold adjustment, (4) image treatment, in order to measure dark feature areas. The concept of threshold allows identiication of pores and microcracks from the background determining the amount and area fraction. A statistical analysis was conducted to get the mean area of dark ields and standard deviation for each set of images. This analysis allows following the microstruture development during pyrolysis of the carbon iber/phenolic resin composite30.
Volume fractions of iber, matrix and pores were calculated by using simple micromechanic equations. Thus, the volume fractions of iber, matrix and pores can be obtained by Equation 2.
% i c i
i M
V ρ
ρ ×
= (2)
Where :
Vi = volume fraction of iber or matrix; Mi = weight (mass) fraction of iber or matrix;
ρc = composite density ;
ρi = density of iber or matrix.
The pore volume fraction can be estimated by calculation from Equation 3.
(
)
pores fiber matrix
V = −1 V +V (3)
A Labview subroutine was implemented to obtain data of electrical resistivity, simultaneously to the heat treatment of specimens. Labview is called virtual instrument since its appearance emulates the operation of physical instruments, such as oscilloscopes and multimeters. The input parameters were the dimension of the specimen and multimeters readings (voltage and current), in order to obtain results of electrical resistivity. Five readings were obtained at programmed temperature interval during heat treatment. In this work two multimeters model Fluke 8846A (voltage source and current source) were used.
3. Results and Discussion
Measurements of density changes, linear shrinkage and weight loss have been done by many authors31,32. As example, results for in situ density changes of a pristine phenolic matrix were obtained previously by Schueller31, as shown in Figure 2.
Pyrolysis up to 1000°C shows a monotonically increase in density from 1.22 g/cm3 (phenolic resin) to ~1.50 g/cm3 (carbon char). During heat treatment of the composite the change in microstructure of the composite studied in this work is only due to the matrix.
Figure 3 shows the TGA analysis for a cured carbon iber phenolic resin composite and TGA analysis for the CR2830 phenolic resin. The morphological and molecular
Figure 1. (a) Schematic of the set-up of electrical resistivity measurement, (b) carbon iber/phenolic composite sample showing equidistant attached screw terminals.
Figure 2. Density change during pyrolysis of thermoset phenolic resin up to 1000°C[31].
changes for phenolic resins during pyrolysis have been described in the literature31,33. Up to ~350°C, there are no signiicant molecular size changes, only small molecular bridge transformations occur. Beyond 350°C, the cracking phase occurs, related to molecular degradation, reduced molecular mass33-35. Elements such as H
2O, CO, CO2, H2 are released as volatiles. The condensation of molecules from aromatic rings and the volatilization these elements lead to weight loss and shrinkage of the phenolic resin. Until 550°C occurs release of water, phenol and CO2. Methane, ethane and hydrogen are released up to 800°C. The most signiicant weight loss occurs between 400° and 700° C.
At 700°C the phenolic resin is converted slowly into an amorphous carbon. The phenolic resin exhibits a carbon yield of 55%/mass. In the composite, the weight loss starts at ~250°C. A signiicant inlection begins at ~500°C and the maximum lost weight occurs up to limit of 600°C. This weight lost is equivalent to 10% and refers just to the phenolic resin, since fabric plain weave is aerospace grade quality, and, therefore, stable until 1500°C.
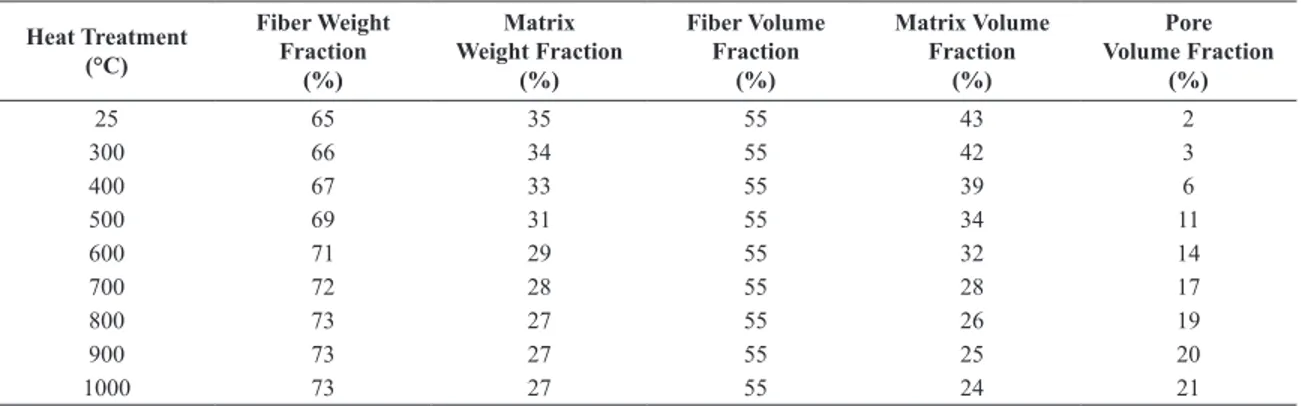
Taking weight fractions of iber and resin matrix in the pristine composite and changes in density of the matrix during heat treatment from Figure 2, it is possible to estimate weight fractions and volume fractions of iber, matrix and pores, according to Equations 2 and 3, at deinite temperature levels. Table 1 shows the calculations.
Signiicant changes are observed in the matrix volume fraction and pore volume fraction, which are related to density changes in the matrix and gas release during heat treatment, respectively.
Figure 4 shows the calculated values for void/pore evolution during pyrolysis of the pristine composite (carbon iber phenolic matrix composite), according to values from Table 1, and based on initial weight fractions of carbon iber and phenolic resin matrix. Calculations were performed considering no signiicant volume change during heat treatment of the composite during the heat treatment. The changes in density were taken from Figure 2.
Typical micrographs of the pyrolysed carbon iber/phenolic resin composite at deined levels of heat treatment are shown in Figure 5. Through the image segmentation procedure stated previously in this work, the pores and micro cracks were isolated from matrix, resulting in image shown in Figure 6.
Analysis of micrographs shows pores and cracks of various sizes. The origin of these features in the pristine composite can be due to shrinkage mismatch between iber and matrix during cure which can cause micro cracks or water vapor release from the polycondensation reaction which can cause pores. During heat treatment the network of micro cracks progressively increase due to gas release. Figure 5 and Figure 6 show that pore formation and delamination occur progressively as heat treatment temperature goes further until 1000°C.
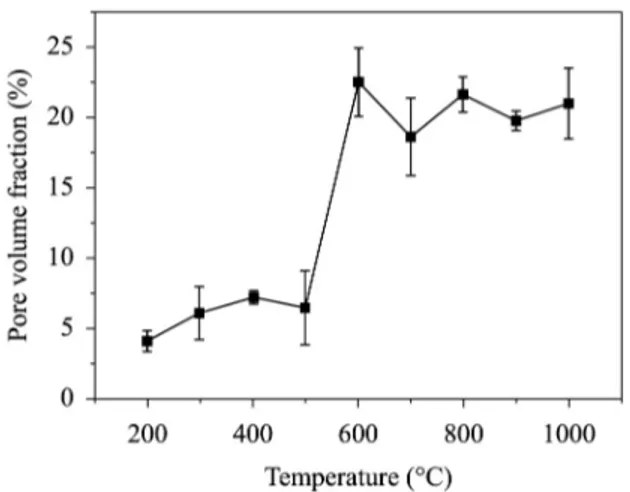
Figure 7 shows that there is a minor degradation (pore and micro crack formation) until temperatures approaching 500 °C. The small luctuations observed in the pore volume fraction until this temperature can be due to sampling strategy and to a non-homogeneous pore formation throughout the composite. Afterwards, from 500°C up to 600°C occurs a pronounced increase in pore volume fraction, indicating that the degradation process, due to the pore and delamination formation, has its occurrence mainly in this temperature range. Above 600°C the luctuations in the pore volume fraction remains almost constant at about 20%/volume. These results are compatible and in a reasonably agreement with the microstructures analysis showed in Figure 5 and Figure 6. Studies upon variation of pores volume in composites based on phenolic resin as function heat treatment have been reported by several authors. For example, Šupová et al.36 observed the appearance of mesopores and macropores having sizes of 2 to 50nm and greater than 50nm, respectively, in the temperature range from 500°C till 1000°C during pyrolysis.
Figure 4. Graph of matrix volume fraction () and pore volume fraction () as a function of heat treatment temperature, data extracted from Table 1.
Table 1. Weight fraction and volume fraction of carbon iber, matrix and pores.
Heat Treatment (°C)
Fiber Weight Fraction
(%)
Matrix Weight Fraction
(%)
Fiber Volume Fraction
(%)
Matrix Volume Fraction
(%)
Pore Volume Fraction
(%)
25 65 35 55 43 2
300 66 34 55 42 3
400 67 33 55 39 6
500 69 31 55 34 11
600 71 29 55 32 14
700 72 28 55 28 17
800 73 27 55 26 19
900 73 27 55 25 20
Figure 5. Microstructure of the composites at various stages of heat treatment. The white arrows shown in the micrographs represent microcracks due to delaminations between fabric layers and voids released by thermal degradation (pyrolysis).
Figure 8 shows the monitoring of electrical resistivity as a function of temperature for the pristine carbon iber/phenolic resin composite.
The phenolic resin is a non-conductor material (electrical resistivity of ∼1012 Ω.m) and during heat treatment of the carbon iber phenolic resin composite, it is converted to a carbon matrix which is a conductor. The electrical resistivity decreases monotonically as heat treatment temperature increases, ranging from 0.08 mΩm to 0.04 mΩm. The formation of pores and cracks, as seen in Figures 5 and Figure 6, should hinder electrical conduction, resulting in an increase of electrical resistivity. However, the electrical resistivity decreases as a function of the heat treatment temperature. This indicates that conversion of a non-conductor material (phenolic resin) to a carbon matrix (electrical conductive material) has a more signiicant effect upon the electrical resistivity than the formation of a porous network structure which hinders electrical conduction.
If during a process the temperature is the driving force, i.e., it can be described as temperature dependent, the Arrhenius law can be regarded as a parameter that indicates how sensitive a variable is in relation to temperature. The Arrhenius equation plays an important role in thermal treatment dependent processes because it denotes the temperature dependence in terms of only two parameters: A (pre exponential factor) and Ea (activation energy). So, decomposition of a material by temperature can be represented by Equation 4, called Arrhenius equation.
( )
(
Ea)
K T Aexp RT −
= (4)
In its logarithmic form the Equation 4 turns to Equation 5[37], as follows.
( )
lnK T ln= A−EaT (5)
So, the electrical resistivity as a function of temperature can be described by the Arrhenius law. In its simplest form the Arrhenius law may be expressed by Equation 6[38].
ln ln 0 Ea 1 R T
ρ= ρ + × (6)
Where :
ρ → electrical resistivity to be found, in Ω.m.
ρ0 → initial electrical resistivity of material, in Ω.m.
EA → activation energy for electrical conduction process,
in kJ.mol-1.
R → universal gas constant, in J. K-1.mol-1.
T → absolute temperature, in K.
Plot of ln ρ as of a function 1/T represented by Figures 9 results in a graph quite linear, where Ea is the slope of Arrhenius plot and can be calculated by Equation 7[39]:
a E slope
R −
= (7)
By curve itting method, the Arrhenius plots is shown according to Figure 9. From the linear graph of ln ρ as a funcion of T–1 as shown in this igure and taking into account the Equation 7 using R whose value is 8.315 J.mol–1K–1, the
values of activation energy (Ea1 and Ea2) are 1.15 kJ.mol–1 and 10.9 kJ.mol–1 respectively. Ea
1 is the value of activation energy until 873 K where occurs loss of volatile and Ea2 is the begging of conversion from phenolic resin to glassy carbon. Activation energy for decomposition of many synthetic polymer materials can be determined by different ways. For a carbon iber/phenolic resin composite the activation energy can change during the heat treatment, depending on many factor, such as the change of chemical morphology
Figure 9. The Arrhenius plot of ln electrical resistivity as a function of T–1 in the temperature. showing Ea
1= 1.15 kJ.mol –1 and
Ea2= 10.9 kJ.mol –1.
Figure 7. Volume fraction of pores as a function of temperature according to Figure 5.
of the phenolic resin which converts into glassy carbon. Most of methods to calculate activation energy uses weight loss curves at different constant heating rates. For example, Trick40 mention that activation energy can span from 60 kJ.mol–1 to 715 kJ.mol–1, approximately. In both cases this energy was calculated in terms of percent weight remaining during the pyrolysis process of the iber carbon/ phenolic resin composite40. On the other hand, Marsh et al.41 found in order to semicokes from pitch pyrolysis values in range of 98 to 345 kJ.mol–1 , besides in their work the activation energy for many polymers under decomposition can lay between 200-310 kJ/mol. The results of activation energy found in this work were much lower than the values mentioned in the literature.
The mass changes (weight loss) can result in a high activation energy, result of signiicant morphological changes. The activation energy to convert a non-conducting material (phenolic resin) to a conductor one (glassy carbon) is low possibly because changes in heat treatment results in enhanced electrical conduction.
4. Conclusion
In this work, pyrolysis of carbon iber/phenolic resin composite was accomplished by measurements, in real time, of electrical resistivity as a function of temperature. The determination of electrical resistivity was accomplished using the four-probe method according to ASTM C611-98[27]. The electrical resistivity of carbon iber/phenolic resin composite was 0.08 mΩ.m and reduced to 0.04 mΩm after its conversion to a carbon iber reinforced carbon matrix at 1000 °C. Progressive increases in pore volume occur during heat treatment concomitantly in situ
conversion of a non-conducting phenolic resin to a vitreous carbon matrix. The maximum total apparent activation energy during pyrolysis process was found using curve itting method of the Arrhenius plot, resulting in a value of ∼12 kJ.mol–1.
The inal pores volume of the composite was ∼20%/volume. Despite pore formation during pyrolysis, which should hinder the electrical transport, the convertion of the phenolic resin (non-conductive) to a vitreous carbon matrix plays an important role in reducing the electrical resistivity. Electrical resistivity is also a tool for quality control since it can relates the microstructural features with levels of process heat treatment.
References
1. Tennison SR. Phenolic-resin-derived activated carbons. Applied Catalysis A: General. 1994; 173(2):289-311.
2. Fitzer E and Manocha LM. Carbon reinforcements and carbon/ carbon composites. Berlin: Springer; 1998.
3. Virgil’ev YS and Kalyagina IP. Carbon–carbon composite materials. Inorganic Materials. 2004; 40(1):S33-S49. http:// dx.doi.org/10.1023/B:INMA.0000036327.90241.5a. 4. Delhaes P. Chemical vapor deposition and infiltration processes
of carbon materials. Carbon. 2002; 40(5):641-657. http://dx.doi. org/10.1016/S0008-6223(01)00195-6.
5. Vignoles GL, Langlais F, Descamps C, Mouchon A, Le Poche H, Reuge N, et al. CVD and CVI of pyrocarbon from various precursors. Surface and Coatings Technology. 2004; 188-189:241-249. http://dx.doi.org/10.1016/j.surfcoat.2004.08.036. 6. Fathollani B, Chau P C, White J L. Injection and stabilization of
mesophase pitch in the fabrication of carbon–carbon composites. Part I. Injection process. Carbon. 2005; 43(1):125-133. 7. Ko TH, Kuo WS and Chang YH. Microstructural changes of
phenolic resin during pyrolysis. Journal of Applied Polymer Science. 2001; 81(5):1084-1089. http://dx.doi.org/10.1002/ app.1530.
8. Manocha LM. High performance carbon-carbon. Sadhana. 2003; 28(1-2):349-358. http://dx.doi.org/10.1007/BF02717143. 9. Trick KA, Saliba TE and Sandhu SS. A kinetic model of the
pyrolysis of phenolic resin in a carbon/phenolic composite.
Carbon. 1997; 35(3):393-401. http://dx.doi.org/10.1016/ S0008-6223(97)89610-8.
10. Tzeng SS and Chr Y-G. Evolution of microstructure and properties of phenolic resin-based carbon/carbon composites during pyrolysis. Materials Chemistry and Physics. 2002; 73(2-3):162-169. http://dx.doi.org/10.1016/S0254-0584(01)00358-3. 11. Costa L, di Montelera LR, Camino G, Weil ED and Pearce EM.
Structure-charring relationship in phenolformaldehyde type resins. Polymer Degradation & Stability. 1997; 56(1):23-35. http://dx.doi.org/10.1016/S0141-3910(96)00171-1.
12. Kim J, Kim MS, Hahm HS and Lim YS. Structural and Property changes in glass-like carbons formed by heat treatment and addition of filler. Macromolecular Research. 2004; 12(4):399-406. http://dx.doi.org/10.1007/BF03218418.
13. Serio MA, Charpenay S, Bassilakis R and Solomon PR. Pyrolysis of phenol-formaldehyde resin : experiments and modeling.
Advanced Fuel Research. 1991: 664-675.
14. Perruchoud R, Fischer W, Letizia I. Measurement of the dimension changes of carbon artifacts during graphitizationin a pilot LWG furnace. Journal Tanso The Carbon Society of Japan.2011; 2011(249):168-173.
15. Greil P. Near net shape manufacturing of polymer derived ceramics.
Journal of the European Ceramic Society. 1998; 18(13):1905-1914. http://dx.doi.org/10.1016/S0955-2219(98)00129-0. 16. Zorin FI. Electric resistivity of powdered graphites. Inorganic
Materials. 1996; 22:47-49.
17. Mochizuchi C. Graphitizing electric furnace. US Patent 6038247. 2000 Mar. 14.
18. Chung DDL. Fibrous composite interfaces studied by electrical resistance measurement. Advanced Engineering Materials. 2000; 2(12):788-796. http://dx.doi.org/10.1002/1527-2648(200012)2:12<788::AID-ADEM788>3.0.CO;2-J. 19. Chung DDL. Electrical applications of carbon materials. Journal
of Materials Science. 2004; 39(8):2645-2661. http://dx.doi. org/10.1023/B:JMSC.0000021439.18202.ea.
20. Farhan S, Li K and Guo LJ. Novel thermal gradient chemical vapor infiltration process for carbon-carbon composites.
New Carbon Materials. 2007; 22(3):247-252. http://dx.doi. org/10.1016/S1872-5805(07)60020-1.
21. Heaney MB. Electrical Conductivity and Resistivity. In: Webster JG, editor. The measurement, instrumentation and sensors handbook. Boca Raton: CRC Press; 2000.
23. Blythe AR. Electrical resistivity measurements of polymer materials. Polymer Testing. 1984; 4(2-4):195-209. http://dx.doi. org/10.1016/0142-9418(84)90012-6.
24. Sudha LK, Sukumar R and Uma Rao K. Evaluation of Activation Energy (Ea) profiles of nanostructured alumina polycarbonate composite insulation materials. International Journal of Materials. Mechanics and Manufacturing. 2014; 2(1):96-100. 25. Iwashita N, Imagawa H and Nishiumi W. Variation of temperature
dependence of electrical resistivity with crystal structure of artificial graphite products. Carbon. 2013; 61:602-608. http:// dx.doi.org/10.1016/j.carbon.2013.05.042.
26. George AM and Gopalakrishnan IK. A four point-probe cell for resistivity measurement at high temperature. Journal of
Physics. E, Scientiic Instruments. 1975; 8(1):13-15. http:// dx.doi.org/10.1088/0022-3735/8/1/007.
27. American Society for Testing Materials – ASTM. C611/1998: Standard test method for electrical resistivity of manufactured carbon and graphite article at room temperature. Philadelphia; 1998.
28. Pulci G, Tirillò J, Marra F, Fossati F, Bartuli C and Valente T. Carbon-phenolic ablative materials for re-entry space vehicles: manufacturing and properties. Composites. Part A, Applied Science and Manufacturing. 2010; 41(10):1483-1490. http:// dx.doi.org/10.1016/j.compositesa.2010.06.010.
29. American Society for Testing and Materials – ASTM. ASTM E3: Standard guide for preparation of metallographic specimens. West Conshohocken; 2011.
30. Dollinger CFAV, Souza WO and Pardini LC. Evaluation of porosity during pyrolysis of carbon fiber/phenolic resin composites. In: Proceedings of 2nd Brazilian Conference on Composite Material; 2014; São José dos Campos. São José dos Campos: BCCM; 2014.
31. Schueller OJA, Brittain ST, Marzolin C and Whitesides GM. Fabrication and characterization of glassy carbon MEMS.
Chemistry of Materials. 1997; 9(6):1399-1406. http://dx.doi. org/10.1021/cm960639v.
32. Mucha H, Kim Y-E and Wielage B. Approaches to reveal porosity in Phenolic Resin derived CFRP and C/C Composites.
In: Proceedings of the Sixteenth International Conference on Composite Materials; 2007; Kyoto. Kyoto: ICCM; 2007.
33. Bhatia G, Aggarwal RK, Malik M and Bahl OP. Conversion of phenol formaldehyde resin to glass like carbon. Journal of Materials Science. 1984; 19(3):1022-1028. http://dx.doi. org/10.1007/BF00540472.
34. Kawamoto AM, Pardini LC, Diniz MF, Lourenço VL and Takahashi MFK. Synthesis of a boron modified phenolic resin.
Journal of Aerospace Technology and Management. 2010; 2(2):169-182. http://dx.doi.org/10.5028/jatm.2010.02027610. 35. Trick KA and Saliba TE. Mechanisms of the pyrolysis of phenolic
resin in a carbon/phenolic composite. Carbon. 1995; 33(11):1509-1515. http://dx.doi.org/10.1016/0008-6223(95)00092-R. 36. Šupová M, Svítilová J, Chlup Z, Černý M, Weishauptová Z,
Suchý T, et al. Relation between mechanical properties and pyrolysis temperature of phenol formaldehyde resin for gas separation membranes. Ceramics-Silikáty. 2012; 56(1):40-49. 37. Guo W, Xiao H, Yasuda E and Cheng Y. Oxidation kinetics and
mechanisms of a 2D-C/C composite. Carbon. 2006; 44(15):3269-3276. http://dx.doi.org/10.1016/j.carbon.2006.06.027. 38. Diakoumakos CD, Mikroyannidis JA, Krontiras CA, Pisanias MN
and Georga SN. Thermosetting resins prepared from the reactions of diaminomaleonitrile with 4,4′-bismaleimidediphenylmethane and electrical conductivity measurements of the resulting materials following pyrolysis. European Polymer Journal. 1995; 31(11):1057-1066. http://dx.doi.org/10.1016/0014-3057(95)00072-0.
39. Lee R. Phenolic Resin chemistry and proposed mechanism for thermal decomposition. Washington: NASA Marshall Space
Flight Center; 2007. p. 7-13. Carbon Cloth Phenolic Composites for Ablative Rocket Nozzle Liners.
40. Trick KA, Saliba TE and Sandhu SS. A kinetic model of the pyrolysis of phenolic resin in a carbon/phenolic composite.
Carbon. 1997; 35(03):393-401. http://dx.doi.org/10.1016/ S0008-6223(97)89610-8.
41. Marsh H, Martínez-Escandell M and Rodríguez-Reinoso F. Semicokes from pitch pyrolysis: mechanisms and kinetics.