Structural assessment of a RC Bridge over Sororó river
along the Carajás railway
Avaliação estrutural da ponte sobre o rio Sororó na
ferrovia Carajás
a Universidade Federal do Pará, Belém, Pará, Brasil.
Abstract
Resumo
The Carajás railway is operated by Vale SA and is used to transport the Brazilian production of iron ore mine located in the state of Pará until Itaqui
harbor in Maranhão state. With 892 km in length, the railway will be doubled due to the prospect of increased production, which requires veriica
-tion of the structures of bridges to ensure safety under loading up to 23% larger. The railway bridge in reinforced concrete has ive hyperstatic
spans with 25 m long and was built over Sororó river in the southeast of Pará. To better evaluate its structural performance under current loadings, several structural elements were monitored with strain gages and the concrete was characterized by non-destructive and destructive testing on the structure. This information was used in a computer model to estimate the future structural behavior. The methodology was satisfactory as the estimated structural performance for future loadings, meeting the recommendations of the Brazilian technical standards.
Keywords: concrete structures, bridge, railroad.
A ferrovia Carajás é operada pela Vale SA e é utilizada para transportar a produção brasileira de minério de ferro da mina localizada no estado do Pará até o porto de Itaqui no estado do Maranhão. Com 892 km de comprimento, a ferrovia será duplicada devido à perspectiva de aumento da
produção, o que requer a veriicação das estruturas de suas pontes visando garantir a segurança sob carregamento até 23% maior que o atual.
A ponte ferroviária em concreto armado apresenta cinco vãos hiperestáticos com 25 m de comprimento cada e foi construída sobre o rio Sororó, na região sudeste do Estado do Pará. Para melhor avaliar seu desempenho estrutural sob carregamentos atuais, diversos elementos estruturais foram monitorados com extensômetros elétricos de resistência e o concreto foi caracterizado através de ensaios não destrutivos e destrutivos na estrutura. Estas informações foram empregadas em um modelo computacional para auxiliar na estimativa do comportamento estrutural futuro. A metodologia mostrou-se satisfatória, assim como o desempenho estimado da estrutura para os futuros carregamentos, atendendo às recomen-dações das normas técnicas brasileiras.
Palavras-chave: estruturas de concreto, ponte ferroviária, estrada de ferro.
J. C. L. MATOS a
V. H. L. BRANCO a
A. N. MACÊDO a
D. R. C. OLIVEIRA a
1. Introduction
The Carajas railroad is a railway operated by Brazilian multinational Vale SA, which is one of the major mining companies in the world and the largest producer of iron ore. Most of the bridges along Carajas railway are reinforced concrete structures with stringers spaced from 2.0 m to 3.0 m in order to enable the construction of concrete decks with thickness of 200 mm to 250 mm [1]. These bridges require strategic maintenance programs since they are
lo-cated in an aggressive environmental and also because the trafic
demands are frequently increasing. Both factors may contribute to the progressive deterioration of their structure [2]. The diagnosis of the actual conditions of existing bridges is fundamental to establish programs for its rational maintenance in order to choose the best
structural rehabilitation method once that the interruption of trafic
in railways may lead to great economic losses [3].
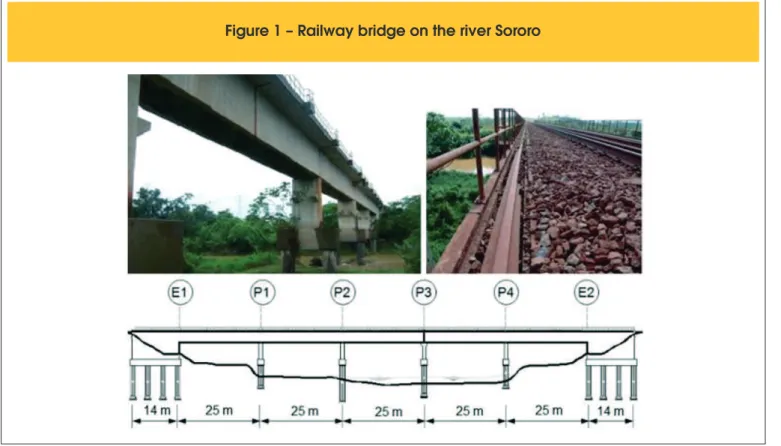
This paper presents a methodology used to evaluate the structural integrity of reinforced concrete bridges along the Carajas railway. It also presents results of “in situ” investigations and computational analysis carried for a bridge over the river Sororo, geographically located in the points -5.440702° (lat.) and -49.134550° (long.). To
evaluate its structural integrity a series of ield activities were per -formed: rebars scan to check if the reinforcements were placed as
speciied in the original design; hardness tests of concrete in order to deine its actual compressive strength; extraction of concrete
samples from structure elements to perform laboratory destructive
tests for the determination of the concrete mechanical properties;
and monitoring of structural elements with strain gauges to check its structural response under actual live loads and to estimate the
fatigue lifetime. A linear-elastic inite element analyses was carried
to verify the safety of the bridge’s original design and to evaluate if its performance under future loads will be within the limits imposed by the Brazilian design codes.
1.1 General characteristics of the bridges
and train-type
The bridge was constructed in the 1990s with cast-in-place
rein-forced concrete. Its superstructure consists of ive (05) hyper static
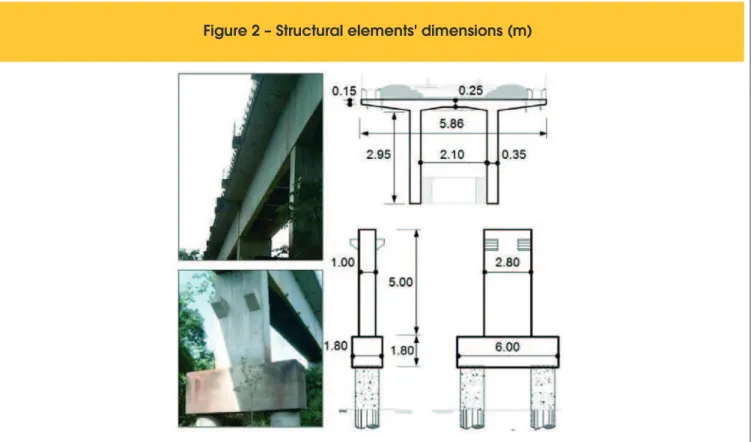
spans, each one with 25 m length, with a total length of 125 m and with vertical inclination of 0.4%. Its cross section has a total width of 5.8 m and supports the railroad, gravel ballast, lateral channels for drainage and cables, metallic guardrails with shelters at each 10 m, and a short cantilever slab to support lampposts. The substructure consists of four (04) cast-in-place reinforced concrete central piers formed by rectangular columns supported on caps over belled cir-cular caissons with shaft of 1.4 m and bell with 3.2 m, as shown in Figure 1. The bridge’s abutments have width of 14.3 m and are formed by four longitudinal walls and two transverse walls. A move-ment joint is placed over column P3. The cross section of the bridge’s deck is of the type beam and slab formed by two rectan-gular ribs of constant height monolithically linked to the slabs and to reinforced concrete short transversal beams. Figure 2 presents photos and general sketches of the superstructure and substructure of the bridge. The substructure consists of four rectangular columns with cross-section measuring (1.0 m x 2.8 m) and 5.0 m height, supported on caissons with circular shaft and base with diameters of 1.4 m and 3.2 m, respectively. Each abutment of the bridge has four transverse and two longitudinal walls supported over a block on eight caissons. An expansion joint was positioned on the column P3.
The Carajas railroad is used to transport iron ore from Carajas city (Para state) to Itaqui harbor (Maranhao state). Actually, a lo-comotive type DASH9 and wagons type GDT are used to trans-port the iron ore. The DASH9 locomotive weighs 1,800 kN, while the loaded GDT wagon weighs 325 kN/axis and 53 kN/axis when unloaded. The actual train used is formed by 2 locomotives + 110 wagons + 1 locomotive + 110 wagons + 1 locomotive + 110 wagons.
Figure 3 shows the dimensions of these locomotives and wagons.
2. Material and methodology
2.1 Visual inspection
Cracks in the outer faces of the stringers were observed during
the visual inspection of the bridge. These cracks were vertical in the middle of the span and slightly inclined in the sections near the supports, but distant from the bottom surface. These cracks were more visible in the outer faces of the stringers, with only a few observed in the inner faces. Regardless of the nature of cracking process (bending, shrinkage, etc.) they may induce corrosion dam-age to steel reinforcement in future [4]. In the surface of transversal
beams cracks with eflorescence and water percolation were also observed, but no evident signs of signiicant corrosion on rebars
were observed. Yet, these damages may also reduce the lifetime of the bridge as highlighted in technical literature [5].
2.2 Non-destructive tests
Non-destructive testing (NDT) enclose a variety of techniques
used to deine properties of a material without causing damages.
Aiming to determinate the actual compressive strength of concrete of the bridge, Schmidt/rebound hammer tests were carried, which evaluate the surface hardness of concrete and through correlations with calibrated results allow the determination of the compressive strength of concrete. Before performing the hardness tests, the structural elements were scanned in order to properly determinate
the position of its rebars, in an attempt to avoid its inluence in
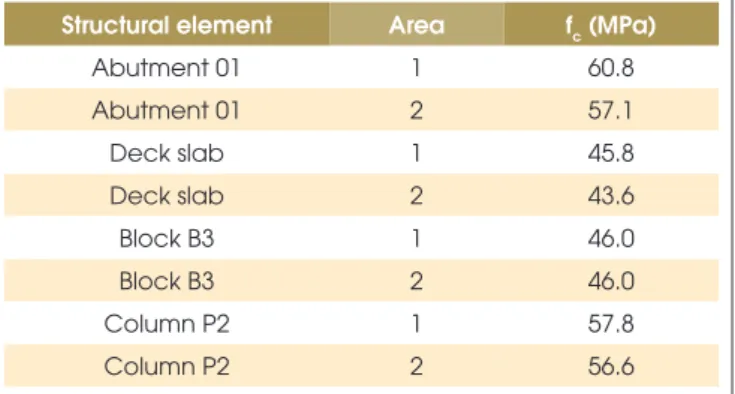
tests results. The observed spacing between the bars 1.5 m above the base of each column ranged from 100 to 50 mm. In addition to the position of the bars, were also determined its direction and diameter and the thickness of the concrete cover, which was in general equal to 50 mm. The hardness tests were performed on column P2, foundation caps, deck slabs, stringers and abutments.
The concrete strength was deined based on the effective aver -age rebound hammer index (Table 1) for each analyzed area (150 mm x 150 mm with 9 impact points) as recommended by Brazilian codes [6].
2.3 Destructive tests
Destructive tests (DT) are those carried out until the specimen’s failure. These tests require damaging parts of the structure in order to obtain samples to perform direct tests in a laboratory. Only two
(02) types of destructive tests were carried out during the bridge’s structural evaluation. One of these tests was carried in order to check the carbonation degree of the concrete cover. The other test involved the extraction of concrete samples to perform compres-sive and splitting tests in the lab. The carbonation tests carried consisted of removing selected parts of the concrete cover from the stringers and from the deck slabs. After that, concrete alkalinity was checked by using phenolphthalein. Tests showed that con-crete alkalinity was adequate as shown in Figure 4 (left).
Many factors may inluence results of surface hardness tests on
concrete such as surface roughness, humidity condition and po-sitioning of the equipment. Due to these reasons, it was decided to evaluate the actual compressive strength of concrete by both surface hardness tests and direct axial compression tests on samples extracted from the structure using a rotating diamond crown [7], as shown in Figure 4 (center). Eight samples were
ex-tracted: two from abutment E1; two from bridge-deck slabs; two from column P2; and two from foundation B3. The samples were
cylindrical with 100 mm of diameter and 200 mm length and the drilling points were carefully selected in order to avoid steel bars. They were tested to axial compression for the determination of
Table 1 – Average results from rebound
hammer tests on structural elements
Structural element Area fc (MPa)
Abutment 01 1 60.8
Abutment 01 2 57.1
Deck slab 1 45.8
Deck slab 2 43.6
Block B3 1 46.0
Block B3 2 46.0
Column P2 1 57.8
Column P2 2 56.6
the compressive strength. During these tests strains were mea-sured by two extensometers such as “clip-gage” (see Figure 4 right) for determination of the elasticity modulus of concrete, in accordance with recommendations adopted in Brazil [8].
2.4 Experimental results
As mentioned before, results from the alkalinity of concrete were satisfactory. Nevertheless, the compression strength results ob-tained by hammer tests were slightly lower than those determined through destructive tests performed on the extracted concrete samples, especially for the case of foundation B3. Yet, the percent-age errors were considered acceptable once they are lower than those found in literature [9], i.e. for laboratory tests it is assumed a range of ± 15% to 20%, with a well calibrated rebound ham-mer, and ± 25 % for “in situ” tests. In general, the actual compres-sive strength of concrete is, on average, 2.7 times higher than the design strength of superstructure, which was only of 18.0 MPa.
Table 2 shows the compressive strength results for rebound ham-mer tests (fc) and for axial compression tests on extracted samples (fc’) according to recommendations of NBR 5739 [10]. Table 2 also presents comparisons of experimental results for the modulus of elasticity of concrete obtained with destructive tests described with theoretical results obtained using recommendations of NBR 6118 [11] and EC2 [12]. In the case of theoretical estimates the compressive strength adopted were those obtained with rebound hammer tests. Figure 5 shows the characteristics curves from the elasticity modulus tests for testimonies T1 and T2 extracted from column P2.
3. Computational model
A liner-elastic inite element analysis of the bridge was performed
in order to validate the experimental results obtained in the moni-toring campaign. This analysis was carried using SAP2000® with the dynamic load of the train considered with a simpliied
pseudo-Table 2 – Concrete’s mechanical properties
Structural element fc (MPa) fc' (MPa) Ec, NBR (GPa) Ec, EC2 (GPa) Ec, Exp. (GPa)
Abutment 01 58.9 47.5 36.5 38.8 35.7
Deck slab 44.7 42.6 31.8 35.4 33.8
Block B3 46.0 33.4 32.3 35.8 38.3
Column P2 57.2 54.6 36.0 38.5 39.9
static analysis. Three computational models were developed
us-ing inite elements of the type beam, shell (4 nodes) and solid (8 nodes). The irst was a simpliied model in which the bridge’s
deck and pier were modeled using beam elements, with
abut-ments and foundations considered with ixed constraints. In the
second model the abutments and foundations were added to
the irst model using solid elements and with its ground supports considered as point springs. In the inal model, the bridge’s
deck, composed by stringers and slabs, was modeled with shell
elements. This inal model was proved to be more realistic than
the others and therefore was the model adopted in the compu-tational analysis.
3.1 Dead loads
Depending on the speciic weight of the materials and geometry
of the structural elements, the computer program calculates the weight of the structure itself. In the case of ballast (42.2 kN / m), mortar on the deck slab (5.5 kN / m), channels (6.5 kN / m), rail-ings (0.3 kN / m), rails, crossties and accessories (7.9 kN / m) was considered a loading of 62.4 kN / m distributed along the central longitudinal axis of the bridge.
3.2 Live loads
3.2.1 Vertical actions
The iron ore production will be increased with direct impact in the loading in Carajas railway and consequently in the bridges along. It is intended to maintain the same types of locomotives, wagons and composition used currently, but with increased load to be transported in each wagon. Table 3 shows the loads for the current and future compositions of locomotives and wagons. The Brazilian code for bridges’ design, NBR 7187 [13], allows a
simpliied analysis of the dynamic effects caused by moving loads by using an impact coeficient that ampliies static loads, which should be calculated according to Equation (1). This coeficient is
basically a function of the theoretical span (l=25 m) between the
supports in the longitudinal direction. These simpliied assump -tions were used in the computational analysis even knowing that
overly simpliied models of vehicles do not represent accurately
the reality, especially if in a dynamic analysis the imperfections of the railway and the train wheels are not considered [14].
(1)
3.2.2 Horizontal actions
The cross wind action was considered through a torsion moment (M) per unit length applied along the bridge, in the decks gravity center, as shown in Figure 6. For the determination of this loading, it was considered the action of wind (pressure of 0.98 kN / m² with the loaded bridge) from the base of the stringer to the top of the wagon, with a total height of 7.3 m., allowing the determination of Q force per unit length. To consider the effect of the force caused by braking or acceleration of the train-type on the structure was adopted only a fraction of the live load in the longitudinal direction,
without considering the impact coeficient, applied on top of the
rails. The NBR 7187 [13] recommends the greater of the following: 15% of the live load for braking or 25% of the weight of the axles for acceleration. In the original bridge calculation memory braking force was only considered in the abutment and dispensed in the rest of the superstructure, and the same was done in the com-putational model. The values adopted for this action were 7,349 kN, 9,044 kN and 75 kN for the operating loaded train-type, future loaded and unloaded, respectively.
Also according to the NBR 7187 [13], the side impact wheel can be treated as a horizontal force perpendicular to the train-type, with a characteristic value of 20% of the load of the most loaded axle.
Table 3 – Loads per axis of the train-type
Situation DASH 9 locomotive Loaded GDT wagon Unloaded GDT wagon
Current 300 kN/axis (1.800 kN) 325 kN/ axis (1.300 kN) 52.5 kN/ axis (210 kN)
Future 300 kN/ axis (1.800 kN) 400 kN/ axis (1.600 kN) 52.5 kN/ axis (210 kN)
This procedure was also used in the design calculation memory. The values of this force were 65 kN, 80 kN and 60 kN for the oper-ating loaded train-type, future loaded and unloaded, respectively. Already the effects of shrinkage and temperature were supposed considering only the shortening of the material. According to NBR 6118 [11], it is possible to adopt the value 10-5/°C for the coeficient of thermal expansion of the concrete. For retraction in current ele-ments of reinforced concrete, the above requirement recommends to adopt a corresponding deformation variation of the temperature of 15 ºC. The standard also recommends a 10 °C temperature range at 15 °C for elements with the smallest dimension of less than 500 mm to represent the only effect of thermal expansion or shortening. It was adopted then a 25 °C temperature range to
con-sider the effects of shrinkage and temperature on the structure. The equivalent horizontal forces, located on the top of each col-umn can be estimated by the product of these parameters, i.e. the
thermal expansion coeficient, temperature variation, the length
of the structural element and the average stiffness of the support (column). The computer program data input requires only that be provided the temperature variation, since the properties of other structural elements are computed automatically by the geometry and properties of the materials that compose them.
3.3 Boundary conditions
In the computational model the elastomeric bearings were added in compliance with the design info, assuming that the columns and abutments are supported by blocks over caissons as shown in Figure 7. Its structural behavior was simulated using rigid beam
elements (with semi-ininite stiffness) and ive spring elements
simulating the steel reinforced elastomeric pads on the top of the columns P1, P2, P3 and P4. Table 4 presents the translation and rotation stiffness of the elastomeric bearings calculated based on the recommendations presented by Pfeil [15]. The transversal
co-eficient of elasticity of the neoprene was 0.1 kN/cm2 and Poisson’s ratio (υ) of 0.5.
Additionally, springs were interchangeably inserted at each 1.0 m along the caisson shafts with depth according to the construction project, aiming to simulate the soil-structure interaction and thus
the foundations behavior. To determine the soil stiffness coeficient
Figure 7 – Finite elements model
Table 4 – Support device’s stiffness
Stiffness Value (kN/m)
Axial (z) 26,160,000
Shear (x) 15,630
Shear (y) 15,630
Rotation (z-z) 125
Rotation (x-x) 71,530
results from Standard Penetration Test (SPT) were analyzed and applied in the computational models. The soil reaction modulus is not only a property related to the ground, but also depends on the characteristics of the foundation and varies with its depth (even for a “homogeneous” layer) and with the loading distribution. It can be obtained through typical procedures, such as: a) experimental methods, b) calibration with rigorous numerical solutions and c)
simpliied theoretical models.
3.4 Concrete’s properties
In the computational model the compressive strength of concrete (fck) was admitted as 18 MPa which was the value adopted in the original design. The value of the modulus of elasticity of the con-crete used in this model was determined from Equation (2), rec-ommended by previous version of NBR 6118 [11] and used in the original design of the structure in 1986. Table 5 presents the mate-rial properties adopted in the computational model.
(2)
4. Preliminary results
4.1 Cross sections design resistance
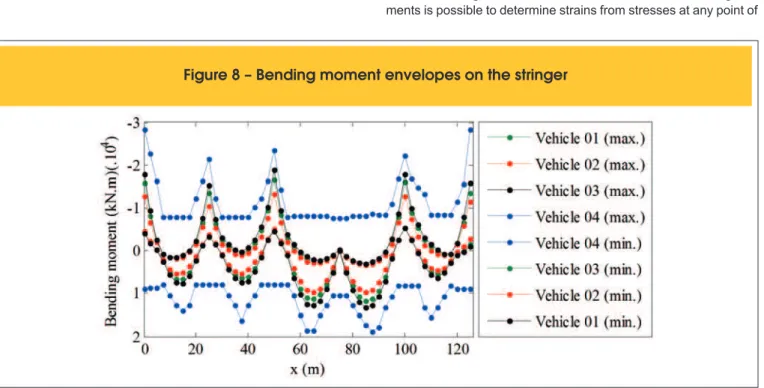
To determine the lexural and shear strengths of the cross sec -tions, an auxiliary computational routine was developed. In this routine the cross section is discretized into sections considering re-bars to check serviceability limit states and ultimate limit strength. In these calculations the concrete and steel constitutive models were assumed according to NBR 6118 [11]. Figure 8 presents en-velops of the design moments for the different load cases and the
lexural strength of the bridge’s stringers. Envelops of the design
bending moments were obtained for these load cases: Vehicle 01 represents the case of the actual loaded train, assumed as 325 kN/
axis; Vehicle 02 represents the case of the actual unloaded train, assumed as 52.5 kN/axis; Vehicle 03 represents the future loaded
train, assumed as 400 kN/axis. In Figure 8, Vehicle 04 (max) and
(min) presents the lexural strength of the stringers as a function of the negative and positive reinforcements. The lexural strength of
the stringers varies along its length due to variations in the rebars
detailing. Figure 8 shows that the lexural strength of the string -ers is higher than the design bending moments caused by the ac-tual and future loadings. Figure 9 presents envelops of the design shear forces for loads cases of Vehicles 01 to 03. It also shows the shear strength of the stringers (Vehicle 04) considering that their widths vary along the spans. Once again it is possible to see that the shear strength is higher than the design shear force for the dif-ferent load cases.
4.2 Fatigue lifetime
To determine the fatigue service life of the stringers, it was ini-tially considered the variation of the bending moments due to the passage of loaded and unloaded current trains and loaded future trains, according to Table 3. From the variation of the bending mo-ments is possible to determine strains from stresses at any point of
Table 5 – Concrete’s parameters
from the calculation memory
Parameter Value
Characteristic strength 18.0 MPa
Elasticity modulus 27.5 GPa
Density 24.5 kN/m3
the stringers cross section. According to NBR 6118 [11] and EC2 [12] it should be determined the maximum and minimum stresses in an area not exceeding 300 mm from the edges of the cross sec-tion. Figure 10 shows the theoretical compressive stresses in the concrete and the theoretical tensile stress in longitudinal reinforce-ment of the section near the support (most loaded), due to the pas-sage of the current loaded train. For a preliminary fatigue analysis the criteria presented by NBR 6118 [11] was used. According to
this code, the veriication of the fatigue of concrete is ensured if the
maximum compressive stress in the concrete (corrected in function of the gradient of compressive stresses) do not exceed a stress fatigue limit of 45% of fcd = fck/1.4. This check is shown in Figure 11, where the corrected stress is presented in module (with the positive sign indicating compression, in this case). The fatigue limit stress was then calculated at 5.8 MPa. Thus, according to NBR 6118 [11], only the stresses arising from the permanent load would already be very close to this limit, at the most loaded cross sec-tion. It should be noted that this criteria is quite conservative once actually does not consider the stress variations and, according to
Leander et al. [16], stress ranges when calculated with simpliied
methods, regular loads and distribution factors tend to result in a reduced remaining fatigue service life.
As already mentioned, it should be noted the fact that the verii -cation of this limit state of fatigue NBR 6118 [11] is based on the ultimate limit state of fatigue of EC2 [12], which sequentially
pres-ents three methods for design veriication, with increasing levels of reinement and precision. Unfortunately, for the veriication of
the concrete fatigue state, NBR 6118 [11] presents only the most simple and therefore more conservative prescription. On the other
hand, EC2 [12] recommends the simpliied method only as a pre
-liminary analysis if the other two more reined methods are not
used. Thus, for this reason, although fatigue criterion NBR 6118 [11] is not met for the section in question, shall be perform a more
reined proceeding according to EC2 [12], and the results of this analysis are presented below. To use this more reined method,
EC2 [12] suggests to use the Rain Flow Algorithm for cycles
count-ing. Using this algorithm a count of cycles of stress in both the con -crete and the steel (reinforcement) is possible, and using the
!
ces on the stringer
tigue strength functions and S-N curves to ind the resisting stress
cycles for these materials the fatigue analysis can be carried out. Therefore, for a more accurate result the principle stress strain re-lationship must be considered. The fatigue lifetime is the inverse of the maximum damage and is expressed in pairs of trains (loading blocks) and in years, considering the passage of 18 trains per day. The lifetime for the current train load is slightly higher than that for the future load. It is noteworthy that these lifetimes were estimated
using the characteristic strength of concrete speciied in the proj -ect, 18.0 MPa, for both operational and future trains. The other sections were also analyzed for fatigue and the results related to lifetime indicated that there is no risk of structural failure by materi-als fatigue, excepting a more rigorous analysis.
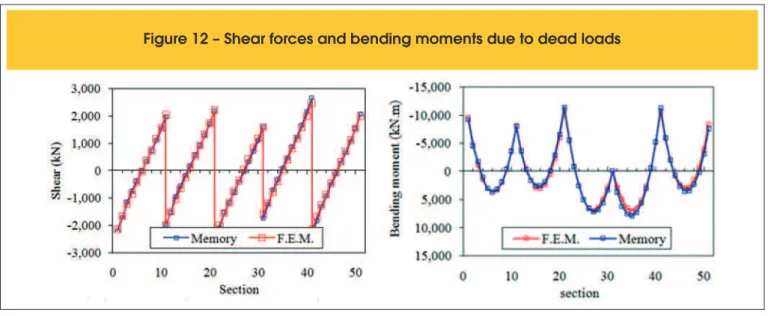
5. Results comparison
served that for the stringers the results for shear forces and bend-ing moments (Figure 12) due to the dead loadbend-ing were in good
proximity to the calculation memory. In these igures the bridge
was divided into 51 sections along the horizontal axis. When the effects caused by the passage of the train-type are taken into ac-count can be observed in column P2 the highest value of axial force, with strong convergence between the results of the calcu-lating memory (Vehicle 02) and computational model (Vehicle 01 loaded) for the maximum envelope, as illustrated in Figure 13. The trains’ live loads considered in this analysis refer to the cases of the actual train live load and also for the future train live load for cases in which the train is loaded (Vehicle 03) and unloaded (Vehicle 04). Further, these results were compared with the live load considered in the original bridge design, in which the loaded train-type consid-ered was Cooper E80 (Vehicle 05).
Like the work of Ermopoulos and Spyrakos [17] to verify the
accu-racy of the results obtained from the three-dimensional inite ele -ment model, the analytically estimated characteristic results were compared with the experimental ones. In the analytical procedure
Figure 11 – Limit fatigue stress according
to NBR 6118
Figure 12 – Shear forces and bending moments due to dead loads
strains were calculated on the same sections monitored with strain gauges. A small part of the strain history at a point instrumented is presented. In this instrumented point two strain histories are shown, one is that obtained in situ from the strain gauges installed on the stringers concrete surface and the other signal refers to
strains from theoretical inluence lines provided by the program
SAP2000® with the vehicles passages, from which the historical
record of internal forces and strains were determined. Figure 14 shows the computational response (left side) and the strain gauge experimental sign on concrete surface for comparisons, both relat-ed to the operational loadrelat-ed train at the middle span cross section of the stringer between columns P1 and P2. Although the peaks observed in the computational response, caused by the passage
of the two front locomotives on the previous (irst peak) and next
span, and not detectable by the strain gauge probably due to cracks on the upper concrete surface near the sensor, even so the results were close for the wagons’ passage.
6. Conclusions
Considering the design envelopes for live and dead loads, it can be concluded that increases in structural strain occur when comparing the results for the current operational and future trains, both loaded, and that such loadings are less than the design resistance for all stringers’ cross sections. Regarding the fatigue lifetime, the estimat-ed results considering the design compressive strength (18.0 MPa) allow to state that the structure is safe for both trains, but further analysis must be done taking into account shear strength, stress combination of bending and shearing, cracking and creep effects, for example. The average experimental results from axial compression and elastic modulus tests on concrete were higher than those used in the structural design. Finally, the methodology applied to analyze the overall structural behavior was satisfactory in an absence of a nonlinear computational analysis considering the existing damages.
7. Acknowledgments
The authors acknowledge the inancial support of FAPESPA,
VALE, CAPES, CNPq and IPEAM at all stages of this work.
8. References
[01] Araujo, M. C.; Cai, S. C. S.; Teixeira, P. W. G. N.; Neiva, V. M.
Transversal loadings distribution in precast concrete bridges
– evaluation of the transversal beams inluence using the NBR 6118:2003 prescriptions, LaDOTD and solid inite ele -ment models. 1st National Encounter of Research Design and Production in Concrete, Sao Carlos, UFSCar., Sao Car -los, CD-Rom, 2005. (in Portuguese)
[02] Orcesi, A. D.; Frangopol, D. M.; Kim, S. Optimization of a bridge
maintenance strategies based on multiple limit states and mon-itoring. Engineering Structures, 32(3), 627-640, 2009. [03] Furuta, H. Bridge reliability experiences in Japan.
Engineer-ing Structures, 20(11), 972-978, 1998.
[04] Canovas, M.F. Pathology and therapy of reinforced concrete.
Pini, São Paulo, 1988. (in Portuguese)
[05] Cascudo, O. The control of corrosion of reinforcement in concrete: electrochemical and inspection techniques. Pini, São Paulo, 1997. (in Portuguese)
[06] Brazilian Association of technical Standards. NBR 7584 – Hardened concrete: evaluation of surface hardness by
re-bound hammer relection – test method. Brazilian Association of technical Standards, Rio de Janeiro, 2012. (in Portuguese) [07] American Society for Testing and Materials. ASTM C42
– Test method for obtaining and testing drilled cores and sawed beams of concrete. American Society for Testing and Materials, United States, 1991.
[08] Brazilian Association of technical Standards. NBR 8522 – Concrete: Determination of the elasticity modulus by com-pression. Brazilian Association of technical Standards, Rio de Janeiro, 2008. (in Portuguese)
[09] Malhotra, V. M. In situ/Nondestructive testing of concrete.
American Concrete Institute, Detroit, 1984.
[10] Brazilian Association of technical Standards. NBR 5739 – Concrete: Compression test of cylindrical specimens – meth-od of test. Brazilian Association of technical Standards, Rio de Janeiro, 2007. (in Portuguese)
[11] Brazilian Association of technical Standards. NBR 6118 – Design of concrete structures. Brazilian Association of
technical Standards, Rio de Janeiro, 2014. (in Portuguese) [12] European Committee for Standardization. Eurocode 2 –
De-sign of Concrete Structures. Part 1-1: General Rules and Rules for Buildings. European Committee for Standardiza-tion, Brussels, Belgium, 2004.
[13] Brazilian Association of technical Standards. NBR 7187 – Reinforced and prestressed concrete bridges – procedure.
Brazilian Association of technical Standards, Rio de Janeiro, 2003. (in Portuguese)
[14] Cai, S. C. S.; Deng, L. Identiication of parameters of ve -hicles moving on bridges. Engineering Structures, 31(10), 2474-2485, 2009.
[15] Pfeil, W. Reinforced Concrete Bridges, Technical and
Scien-tiic Books, Rio de Janeiro, 1985.
[16] Leander, J.; Andersson, A.; Karoumi, R. Monitoring and en -hanced fatigue evaluation of a steel railway bridge. Engi-neering Structures, 32(3), 854-863, 2009.
[17] Ermopoulos, J; Spyrakos, C. C. Validated analysis and