Abstract
In this paper, an artificial neural network (ANN-10) model was developed to predict the ultimate shear strength of steel fiber reinforced concrete (SFRC) beams without web reinforcement. ANN-10 is a four-layered feed forward network with a back prop-agation training algorithm. The experimental data of 70 SFRC beams reported in the technical literature were utilized to train and test the validity of ANN-10. The input layer receives 10 input signals for the fiber properties (type, aspect ratio, length and volume content), section properties (width, overall depth and effective depth) and beam properties (longitudinal reinforcement ratio, compressive strength of concrete and shear span to effective depth ratio). ANN-10 has exhibited excellent predictive perfor-mance for both training and testing data sets, with an average of 1.002 for the average of predicted to experimental values. This performance of ANN-10 established the promising potential of Artificial Neural Networks (ANNs) to simulate the complex shear behavior of SFRC beams. ANN-10 was applied to investigate the influence of the fiber volume content, type, aspect ratio and length on the ultimate shear strength of SFRC.
Keywords
Beams, Fiber reinforced concrete, Shear failure, Steel fiber rein-forced concrete (SFRC), Numerical modeling.
Influence of Fiber Properties on Shear Failure of Steel Fiber
Reinforced Beams Without Web Reinforcement: ANN Modeling
1 INTRODUCTION
Reinforced concrete beams with or without web reinforcement, which are subjected to combined flexural and shear stress, can be prone to instantaneous failure in shear (Roberts and Ho 1982; Dinh 2009). Traditionally, reinforced concrete beams are reinforced with web reinforcement to avoid fail-ure due to tensile-shear stresses. The inclusion of short and discrete steel fibers with an aspect ratio
Yassir M. Abbas a, 1 M. Iqbal Khan a, 2 *
a Department of Civil Engineering, King
Saud University, Riyadh, P. O. Box 800, Riyadh 11421, Saudi Arabia
1 Email: [email protected]
2 Email: [email protected]
* Corresponding author
http://dx.doi.org/10.1590/1679-78252851
(fiber length to diameter) ranging between 20 to 100 in concrete, has been proven to enhance the shear strength by resisting the formation and growth of cracks (Al-Ta’an and Al-Feel 1990). The use of fibers in thin sections and congested reinforcing steel sections is highly beneficial, as it may be difficult to provide conventional web reinforcement. For deep beams and due to the high inclined tensile stresses arising from the shear stresses on vertical planes, shear cracks may propagate rapidly in the web causing a catastrophic failure. However, the understanding of the shear behavior of beams, particularly for deep beams, constitutes a challenging engineering problems, since various modes of failures have been observed for such beams (Roberts and Ho 1982). This problem is com-plicated by the nonlinear interactions arising from the inclusion of steel fiber in concrete. At pre-sent, numerous predictive models for the evaluation of the ultimate shear strength of SFRC beams have been developed based on the regression analysis (Mansour et al. 1986; Sharma 1986; Al-Ta’an and Al-Feel 1990; Khuntia et al. 1999). In such complex problems, which are difficult to be modeled using conventional modeling techniques, the application of ANNs may have a good application po-tential. ANNs have been introduced to the field of civil engineering as a powerful modeling tech-nique, which has achieved acceptable success in many applications (Hegazy et al. 1998; Perera et al. 2010; Bashir and Ashour 2012; Mashrei et al. 2013; Lee and Lee 2014). ANNs are numerical archi-tectures composed of huge elements of strongly interlocking manufactured elements known as neu-rons, which simulate the human brain mechanism of learning and solving problems. The construc-tion of the ANN models mainly depends on the actual, adequate and reliable experimental data. ANNs can solve highly non-linear and sophisticated problems, including problems having inaccurate and scattered data (Jha 2007).
2 SIGNIFICANCE OF RESEARCH
Concrete as a brittle material responds by cracking when subjected to low tensile stresses arising from the shear stresses at the inclined sections of a beam. The failure of beams usually causes cata-strophic loss, both human and material, because of its sudden occurrence without a warning. The incorporation of steel fibers in concrete enhances its tensile stress resistance at the post cracking stage of concrete, which increases the ultimate shear strength of SFRC beams. However, the only accurate method for the evaluation of this strength is through the costly experimental testing of full-scale beams. The development of rational numerical methods for the prediction of the fracture behavior of SFRC reduces the cost of experimentation and provides the appropriate tool for the optimal design of SFRC. In addition, investigating the role of the individual fiber properties assists in providing an understanding of the behavior of SFRC beams in shear.
3 PARAMETERS INFLUENCING THE ULTIMATE SHEAR STRENGTH OF SFRC
As a conventional reinforced concrete, the ultimate shear strength of SFRC beams without web reinforcement is primarily influenced by: 1) the compressive strength of concrete, 2) the ratio of the longitudinal reinforcement, 3) the shear span to effective depth ratio, and 4) the section dimensions (particularly the effective depth). In addition, the ultimate shear strength of SFRC beams are af-fected by the properties of the fiber, namely: 1) type, 2) length, 3) aspect ratio, and 4) volume con-tent. Various researchers assumed that the shear resistance of SFRC beams without web reinforce-ment is based on: 1) the shear force in the untracked compression zone, 2) the aggregate interlock force in the cracked tensile concrete, 3) the dowel force in the main steel, and 4) the contribution of steel fibers in the diagonal crack zone (Al-Ta’an and Al-Feel 1990; Lim and Oh 1999; Dinh 2009). Figure 1 shows the shear resistance forces at the inclined tensile crack of SFRC beam without web reinforcement.
Figure 1: Shear resistance forces at inclined tensile crack of SFRC beam without web
in-creasing the shear span to an effective depth ratio drastically reduces the ultimate shear strength of SFRC beams due to the arching behavior. Swamy and Bahia (1985) observed that, the ultimate shear strength of SFRC beams increases as the longitudinal reinforcement increases to a particular value beyond which it decreases. This was attributed to the increase in the longitudinal reinforce-ment-concrete dowel interactions. The fiber aspect ratio was not reported to affect the ultimate shear strength of SFRC beams. However, various researchers investigated the effect of fiber using the fiber factor suggested by Narayanan and Darwish (1987), which combines the fiber type, aspect ratio and volume content. As reported by these researches, the most significant factor is the fiber volume content.
4 ARTIFICIAL NEURAL NETWORKS
In the field of civil engineering, ANNs have achieved a high degree of applicability. Sanand and Saka (2001) developed an ANN to predict the ultimate shear strength of conventional reinforced concrete deep beams. These researchers have shown that the developed ANN has better predictive capability than the equations suggested by the ACI 318 committee. Hegazy et al. (1998) investigat-ed the potential of using ANNs to develop efficient prinvestigat-edictive models for the structural behavior of concrete slabs. They reported that ANNs are a useful technique for the reasonable prediction of the behavior of concrete slabs without additional experimental testing.
Due to its simplicity, the multi-layer perceptron ANNs with feed forward and back propagation are mostly utilized in engineering. The input layer receives signals, which treated through the hid-den layer, and finally produced in the output layer. The learning process requires the evaluation of the weight of the processing connections and their modality. Mostly, only one hidden layer is enough to correlate highly nonlinear parameters, however, in some cases two or more hidden layers are more efficient (Adhikary and Mutsuyoshi 2006). The major concerns of structural analysis prob-lems, such as predicting different properties of concrete and load carrying capacity, have been solved mostly by using back propagation (Naik and Kute 2014).
5 DEVELOPMENT OF THE NEURAL NETWORK MODEL
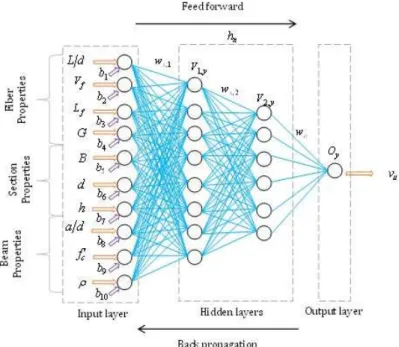
In this paper, a multilayer feed forward neural network with a back propagation training algorithm was used to develop ANN-10. Figure 2 shows the topology of ANN-10, which has 10 input nodes, two hidden layers with 14 neurons and one output layer. In this figure, the network is represented in the form of a directed graph, in which the nodes represent the processing unit, the straight lines represent the connections, and the arrowhead lines indicate the normal direction of signal flow. In addition, wx,n and vn,yare the weight matrices and b1 to b10are the bias vector elements.
Figure 2: The topology of ANN-10
To accelerate the convergence of the predicted output with the desired output, a sigmoid acti-vation function,
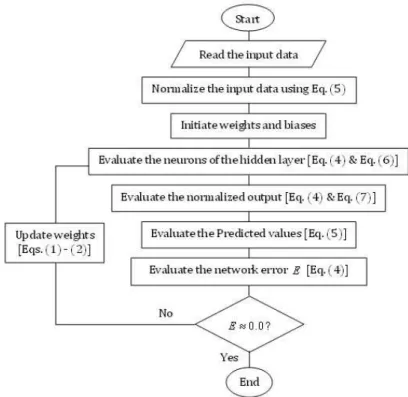
V as given by Eq. (4), was used to evaluate the values of the hidden and output neurons. Before applying the sigmoid activation function, a linear normalization function, as given by Eq. (5), was applied to scale the input values between zero and one. Eqs. (6)-(7) describes the mode of mathematical operations in the hidden and output layers of ANN-10. It is worth noting that MS Excel was utilized to develop the ANN-10 based on the flow chart given in Figure 3. Moreover, the Optimization Modeling System "Solver" in the MS Excel was used to optimize the developed ANN model. The parameters of the Solver tool were adjusted arbitrary and those result in the minimum mean square error (E
in Eq. 3) were adopted.
t t
w
t w
twi i i (1)
ii t D Y I
w
(2)
2
i i i Y D E (3)
Ve V 1 1 (4) min max min I I I I S (5)
M x n x x n M x x x n nn V w i w i b
y
N
x
n n y N
x
n n y y
n V v h v h b
O
0 , 0 ,
(7)In Eqs. (1)-(7), tstands for time, Dis the desired output, Y is the actual output, Iiis the th
i input signal, is the learning rate, V is the value of the normalized input or output, ixis the transmitted value from th
x input neuron, ith, hn is the activity level generated at the nthhidden
neuron, On is the activity level generated at the ythoutput neuron, wn,xand vy,n are weights on
the connections to the hidden and output layers of neurons, respectively. Finally,bn, by and
Vare weighted biases and activation function.
Figure 3: Flow chart for development of ANN-10
6 EXPERIMENTAL DATA
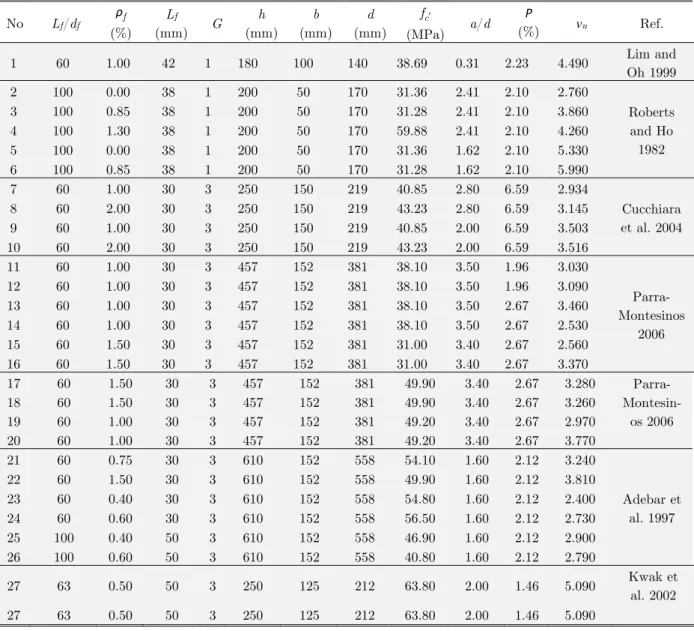
In this study, the experimental data utilized to train and test the performance of ANN-10 were the experimental test results of 70 SFRC beams collected from 11 published reports (Roberts and Ho 1982; Swamy and Bahia 1985; Lim et al. 1987; Swamy et al. 1993; Tan et al. 1993; Adebar et al. 1997; Lim and Oh 1999; Kwak et al. 2002; Cucchiara et al. 2004; Parra-Montesinos 2006; Dinh 2009) as given in Table 1. The collected data included: 1) G (the fiber geometry code, which is 1
for straight, 2 for crimped, 3 for hooked fibers), 2) Vf (the fiber volume content), 3)
L
fd
f (thesection width), 7) d (the beam section effective depth), 8) a d (the shear span to effective depth ratio), 9)
(the ration of the longitudinal reinforcement, 10) fc (the concrete compressivestrength) and 11) vu Vu bh (the ultimate shear strength of the beam).
It should be noted that the cylindrical compressive strength of concrete was evaluated as 80% of the cubic compressive strength. Data pre-processing was carried out on the collected results of the experimental data to exclude the inconsistent data points. As the objective of this paper is to pre-dict the ultimate shear strength of FRC beams without web reinforcement, beams that failed in the flexure mode were excluded. In addition, high strength and ultra-high beams having high strength and ultra-high compressive strength concrete
fc60MPa
were also excluded. Then, the collecteddata were subdivided into two sets, 70% for the training data set (49 data points), and 30% for the testing data set (21 data points).
No Lf/df
ρf
(%)
Lf
(mm) G
h (mm) b (mm) d (mm)
fc’
(MPa) a/d
Ρ
(%) vu Ref.
1 60 1.00 42 1 180 100 140 38.69 0.31 2.23 4.490 Lim and
Oh 1999
2 100 0.00 38 1 200 50 170 31.36 2.41 2.10 2.760
Roberts and Ho 1982
3 100 0.85 38 1 200 50 170 31.28 2.41 2.10 3.860
4 100 1.30 38 1 200 50 170 59.88 2.41 2.10 4.260
5 100 0.00 38 1 200 50 170 31.36 1.62 2.10 5.330
6 100 0.85 38 1 200 50 170 31.28 1.62 2.10 5.990
7 60 1.00 30 3 250 150 219 40.85 2.80 6.59 2.934
Cucchiara et al. 2004
8 60 2.00 30 3 250 150 219 43.23 2.80 6.59 3.145
9 60 1.00 30 3 250 150 219 40.85 2.00 6.59 3.503
10 60 2.00 30 3 250 150 219 43.23 2.00 6.59 3.516
11 60 1.00 30 3 457 152 381 38.10 3.50 1.96 3.030
Parra-Montesinos
2006
12 60 1.00 30 3 457 152 381 38.10 3.50 1.96 3.090
13 60 1.00 30 3 457 152 381 38.10 3.50 2.67 3.460
14 60 1.00 30 3 457 152 381 38.10 3.50 2.67 2.530
15 60 1.50 30 3 457 152 381 31.00 3.40 2.67 2.560
16 60 1.50 30 3 457 152 381 31.00 3.40 2.67 3.370
17 60 1.50 30 3 457 152 381 49.90 3.40 2.67 3.280
Parra- Montesin-os 2006
18 60 1.50 30 3 457 152 381 49.90 3.40 2.67 3.260
19 60 1.00 30 3 457 152 381 49.20 3.40 2.67 2.970
20 60 1.00 30 3 457 152 381 49.20 3.40 2.67 3.770
21 60 0.75 30 3 610 152 558 54.10 1.60 2.12 3.240
Adebar et al. 1997
22 60 1.50 30 3 610 152 558 49.90 1.60 2.12 3.810
23 60 0.40 30 3 610 152 558 54.80 1.60 2.12 2.400
24 60 0.60 30 3 610 152 558 56.50 1.60 2.12 2.730
25 100 0.40 50 3 610 152 558 46.90 1.60 2.12 2.900
26 100 0.60 50 3 610 152 558 40.80 1.60 2.12 2.790
27 63 0.50 50 3 250 125 212 63.80 2.00 1.46 5.090 Kwak et
al. 2002
27 63 0.50 50 3 250 125 212 63.80 2.00 1.46 5.090
No Lf/df
ρf
(%)
Lf
(mm) G
h (mm) b (mm) d (mm)
fc’
(MPa) a/d
ρ
(%) vu Ref.
28 63 0.75 50 3 250 125 212 68.60 2.00 1.46 5.440
Kwak et al. 2002
29 63 0.50 50 3 250 125 212 63.80 3.00 1.46 3.090
30 63 0.75 50 3 250 125 212 68.60 3.00 1.46 3.400
31 63 0.50 50 3 250 125 212 63.80 4.00 1.46 2.410
32 63 0.75 50 3 250 125 212 68.60 4.00 1.46 2.740
33 63 0.50 50 3 250 125 212 30.80 4.00 1.46 4.040
34 63 0.50 50 3 250 125 212 30.80 2.00 1.46 2.550
35 63 0.50 50 3 250 125 212 30.80 3.00 1.46 2.000
36 60 0.50 30 3 375 60 340 35.0 2.00 3.44 5.340
37 60 0.75 30 3 375 60 340 33.0 2.00 3.44 4.430
Tan et al. 1993
38 60 1.00 30 3 375 60 340 36.0 2.00 3.44 5.150
39 60 1.00 30 3 375 60 340 36.0 2.50 3.44 3.780
40 60 0.50 30 3 152 254 221 34.0 1.50 2.39 4.000
Lim et al. 1987
41 60 1.00 30 3 152 254 221 34.0 1.50 2.39 4.380
42 60 1.00 30 3 152 254 221 34.0 2.50 2.39 2.450
43 60 1.00 30 3 152 254 221 34.0 3.50 2.39 2.000
44 80 1.50 76 2 610 305 546 32.8 2.80 1.84 2.030 tesinos 2006
Parra-Mon-45 100 0.40 50 2 250 175 210 35.5 4.50 4.00 2.160 Swamy
and Bahia 1985
46 100 0.80 50 2 250 175 210 37.4 4.50 4.00 3.100
47 100 1.20 50 2 250 175 210 39.8 4.50 4.00 3.130
48 100 1.00 50 2 300 55 265 40.9 3.40 4.31 4.030
Swamy et al. 1993
49 100 1.00 50 2 300 55 265 36.0 4.90 4.31 2.900
50 100 1.00 50 2 300 55 265 37.8 2.00 2.76 4.910
51 100 1.00 50 2 300 55 265 35.7 2.00 1.55 4.630
52 55 0.75 30 3 457 152 381 44.8 3.43 1.96 2.940
Dinh 2009
53 55 0.75 30 3 457 152 381 44.8 3.43 1.96 2.750
54 55 1.00 30 3 457 152 381 38.1 3.50 1.96 3.030
55 55 1.00 30 3 457 152 381 38.1 3.50 1.96 3.100
56 55 1.50 30 3 457 152 381 38.1 3.43 2.67 3.380
57 55 1.50 30 3 457 152 381 45.0 3.43 2.67 3.280
58 55 1.50 30 3 457 152 381 45.0 3.43 2.67 3.260
59 80 1.00 60 3 457 152 381 49.2 3.43 2.67 3.770
60 80 0.75 30 3 457 152 381 43.4 3.43 1.96 3.310
61 55 0.75 30 3 689 203 457 50.8 3.50 2.06 2.930
62 80 0.75 60 3 689 203 457 28.8 3.50 2.06 2.810
63 55 0.75 30 3 689 203 457 42.3 3.50 1.56 2.780
64 80 0.75 60 3 689 203 457 29.6 3.50 1.56 2.140
66 80 0.75 60 3 689 203 457 29.6 3.50 1.56 1.790
66 55 1.5 30 3 689 203 457 44.5 3.50 2.06 3.50
67 55 1.50 30 3 457 152 381 38.1 3.43 2.67 2.560
68 100 0.80 50 2 250 175 210 38.2 4.50 3.05 3.210
66 100 1.00 50 2 300 55 265 35.6 2.00 4.31 5.480
70 100 1.00 50 2 300 55 265 33.1 3.40 2.76 3.110
71 100 1.00 50 2 300 55 265 35.9 4.90 2.76 2.920
Table 2 presents the range, arithmetic mean (), standard deviation ( ) and the coefficient of variance (COV) of the collected data.
Lf/df
ρf
(%)
Lf
(mm) G
h
(mm)
b
(mm)
d
(mm)
fc’
(MPa) a/d ρ (%)
vu
(MPa) Training data
No. 49 49 49 49 49 49 49 49 49 49 49
Min. 55 0.00 30 1 152 50 140 30.80 0.31 1.46 2.000
Max. 100 2.00 60 3 610 254 558 68.60 4.00 6.59 5.990
range 45 2.00 30 2 458 204 418 37.80 3.69 5.13 3.990
66 0.94 36 3 364 144 319 44.04 2.75 2.51 3.346
14.69 0.44 9 0.66 148 46 124.5 11.23 0.89 1.30 0.850COV 0.22 0.47 0.25 0.24 0.41 0.32 0.39 0.26 0.32 0.52 0.260
Testing data
No. 21 21 21 21 21 21 21 21 21 21 21
Min. 55 0.40 30 2 250 55 210 28.80 2.00 1.55 2.030
Max. 100 1.50 76 3 689 305 546 50.80 4.90 4.31 5.480
range 45 1.10 46 1 439 250 336 22.00 2.90 2.76 3.450
83 0.93 46 2 412 126 328 36.89 3.30 2.99 3.546
19.59 0.27 12.76 0.51 176 79 104 4.92 1.05 0.98 1.07COV 0.24 0.29 0.28 0.21 0.43 0.63 0.32 0.13 0.32 0.33 0.30
Table 2: Statistics of experimental data
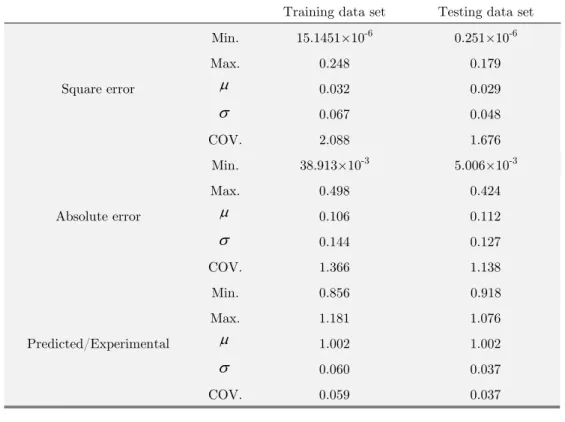
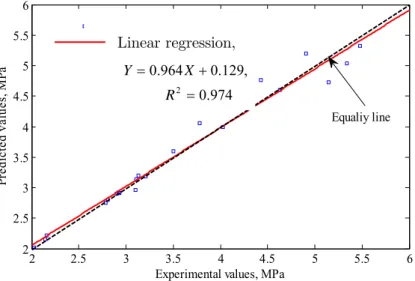
7 RESULTS AND DISCUSSION 7.1 Analysis and Validity of the Model
Training data set Testing data set
Square error
Min. 15.1451×10⁻⁶ 0.251×10⁻⁶
Max. 0.248 0.179
0.032 0.029
0.067 0.048COV. 2.088 1.676
Absolute error
Min. 38.913×10⁻³ 5.006×10⁻³
Max. 0.498 0.424
0.106 0.112
0.144 0.127COV. 1.366 1.138
Predicted/Experimental
Min. 0.856 0.918
Max. 1.181 1.076
1.002 1.002
0.060 0.037COV. 0.059 0.037
Table 3: Summary of error analysis.
2 2.5 3 3.5 4 4.5 5 5.5 6
2 2.5 3 3.5 4 4.5 5 5.5 6
Experimental values, MPa
Pr
ed
ic
te
d
va
lu
es
, M
Pa
Equaliy line
Figure 4: Experimental values vs. predicted values of ultimate shearing strength for the training data set
Linear regression,
955 . 0
, 151 . 0 954 . 0
2
2 2.5 3 3.5 4 4.5 5 5.5 6
2 2.5 3 3.5 4 4.5 5 5.5 6
Experimental values, MPa
Pr
ed
ic
te
d
va
lu
es
, M
Pa
Equaliy line
Figure 5: Experimental values vs. predicted values of ultimate shearing strength for the testing data set
7.2 Parametric Study
The network ANN-10 was utilized to study the influence of the individual properties of the fiber on the ultimate shear strength of SFRC beams without web reinforcement. At different shear span to effective depth ratiosa d, the effect of fiber volume content, aspect ratio and length were studied by varying their values. To investigate the influence of the type of fiber, the fiber geometry code was kept constant for different shear spans to effective depth ratios.
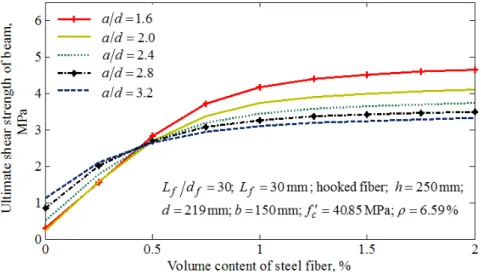
7.2.1 Influence of Volume Content of Fibers
Figure 6 shows the influence of Vf on vufor SFRC beams without web reinforcement for different d
a values. The kept-constant properties of the investigated beams are shown in this figure. For deep beams (a d2), it can be seen from this figure that vudrastically increases as Vf increases to
a certain value (about 1%), after which vuincreases marginally. However, for shallow beams
(a d2), little improvement of vuwith increasing Vf was observed. It is worth noting that a
simi-lar behavior for SFRC beams was reported by Lim and Oh (1999), and Cucchiara et al. (2004). They showed that the inclusion of an appropriate volume content of steel fiber could increase the ultimate shear strength more than the flexural strength of longitudinally reinforced SFRC beams, which alters the ductile shear failure mode into the flexure model of failure.
In addition from Figure 6, it can be seen that forVf 0.5%, vuincreases as a dincreases,
how-ever, this behavior is changed forVf 0.5%. In other words, for Vf 0.5% the shallower beam (has
the largesta d) has the highest vu compared to other beams. However, for Vf 0.5%the deeper
beam (has the smallesta d) has the highestvu. This finding demonstrates that the addition of
about 0.5% or more steel fibers in reinforced concrete beams alters the brittle shear behavior and Linear regression,
974 . 0
, 129 . 0 964 . 0
2
sudden failure of beams, especially for deep beams (a d2.0). In addition, this result confirms the capability of steel fibers to increase the ultimate shear strength of beams, in a way that they can replace the nominal web reinforcement as reported by various researchers (Furlan and de Hanai 1997; Imam et al. 1997; Lim and Oh 1999; Dinh 2009). The improvement in vudue to the increase
f
V is attributed to the increase in the crack bridging capacity at the post-cracking stage, which
enhances the overall mechanical performance of the concrete.
Figure 6: Influence of volume content of fiber on the ultimate shear strength of SFRC beams without web reinforcement
7.2.2 Influence of Aspect Ratio of Fibers
Figure 7 shows the influence of Lf df on vuof SFRC beams without web reinforcement for
differ-ent a dvalues. The constant properties of the studied SFRC beams are given in this figure. As can be seen from this figure, increasing Lf df from 60 to 100 causes a 24~32% increase for vuof
shal-low and deep beams. In addition, the improvement of vudue to increasing Lf df in deep beams
are more than the same for shallow beams. The improvement in vudue to an increase in Lf df is
attributed to the increase in the fiber-concrete matrix interface.
7.2.3 Influence of Length of Fibers
Figure 8 shows the influence of Lf on vuof SFRC beams without web reinforcement for different d
a values. The properties of the studied SFRC beams are given in this figure. As can be seen from this figure, increasing Lf from 30 to 60 causes a 5~20% increase in vufor deep and shallow beams.
Unlike the change in vudue toLf df , the percentage increase in vufor shallow beams is more than
beams compared to deep beams. For these particular SFRC beams, it seems that the optimum fiber length for the investigated beam is 45mm.
Figure 7: Influence of aspect ratio of fiber on the ultimate shear strength of SFRC beams without web reinforcement
7.2.4 Influence of Type of Fiber
Figure 9 shows the influence of the type of fiber on vuof SFRC beams without web reinforcement
for differenta dvalues. The properties of the studied SFRC beams are given in this figure. As can be seen from this figure for deep beams (a d2), all types of fiber have almost the same influence onvu. However, for straight fibers,
v
u is drastically decreased as the a dincreased for shallowbeams (a d2). This demonstrated that straight fibers cannot be used as minimum web rein-forcement for shallow beams.
Figure 9: Influence type of fiber on the ultimate shear strength of SFRC beams without web reinforcement
8 CONCLUSIONS
Various researchers have developed regression analysis-based models for the prediction of the mate shear strength of SFRC beams. However, none of these models can perfectly predict the ulti-mate shear strength of SFRC beams. ANNs have been utilized in various fields including civil engi-neering to correlate the outputs and inputs of highly nonlinear problems. Nevertheless, very little research has been undertaken on the potential of using ANNs for the prediction of the ultimate shear strength of SFRC beams. This study is aimed at to develop a rational numerical model for the prediction of the ultimate shear strength of SFRC beams. From this study, the following con-clusions were drawn:
properties of fiber (type, volume content, aspect ratio and length), ii) the properties the section (Overall depth, width, and effective depth), and, iii) the properties of the beam (shear span-to-effective depth ratio, percentage of longitudinal reinforcement, and the cylindrical compressive strength of concrete). ANN-10 exhibited excellent predictive performance for the prediction for both the training and testing data sets with 1.002 average of the predicted to experimental values. The successful performance of ANN-10 has established the favorable potential of ANNs to simulate of the complex shear behavior of SFRC beams.
A significant increase in the ultimate shear strength occurs for deep SFRC beams with increas-ing the fiber content. However, little increase in the ultimate shear strength occurred for shallow beams. In addition, the inclusion of 0.5% or more volume of steel fibers to fabricate the SFRC deep beams altered its failure mode from brittle shear to ductile flexure. In this study, up to 32% im-provement of the ultimate shear strength of SFRC beams was observed by increasing the aspect ratio of the fiber from 60 to 100. The strength improvement in the deep beams was more pro-nounced than in the shallow beams. By increasing the fiber length from 30mm to 60mm, a 5~20% increase in the ultimate shear strength of SFRC beams was observed. The fiber length influences the flexural strength of the SFRC beams more than its shear strength. Straight, crimped and hooked fibers have almost a similar influence on the shear strength of SFRC beams for deep beams. However, the straight rounded fibers have very little influence on the ultimate shear strength of shallow beams.
Acknowledgements
The Author extends his appreciation to the Deanship of Scientific Research at King Saud University for funding the work through the research group project No. RGP-VPP-105.
References
Adebar P., Mindess S., Pierre D., and Olund B. (1997). "Shear tests of fiber concrete beams without stirrups." ACI Structural Journal 94(1).
Adhikary B. and Mutsuyoshi H. (2006). "Prediction of shear strength of steel fiber RC beams using neural net-works." Construction and Building Materials 20(9): 801-811. doi.org/10.1016/j.conbuildmat.2005.01.047.
Al-Ta'an S. and Al-Feel J. (1990). "Evaluation of shear strength of fibre-reinforced concrete beams." Cement and Concrete Composites 12(2): 87-94. doi.org/10.1016/0958-9465(90)90045-Y.
Bashir R. and Ashour A. (2012). "Neural network modelling for shear strength of concrete members reinforced with FRP bars." Composites Part B: Engineering 43(8): 3198-3207. doi.org/10.1016/j.compositesb.2012.04.011.
Cucchiara C., La Mendola L. and Papia, M. (2004). "Effectiveness of stirrups and steel fibres as shear reinforce-ment." Cement and concrete composites 26(7): 777-786. doi.org/10.1016/j.cemconcomp.2003.07.001.
Dinh H. (2009). Shear behavior of steel fiber reinforced concrete beams without stirrup reinforcement, PhD thesis, University of Toronto.
Furlan S. and de Hanai B. (1997). "Shear behaviour of fiber reinforced concrete beams." Cement and concrete com-posites 19(4): 359-366. doi.org/10.1016/S0958-9465(97)00031-0.
Imam M., Vandewalle L., Mortelmans F., (1997). "Shear domain of fibre-reinforced high-strength concrete beams." Engineering structures 19(9): 738-747. doi.org/10.1016/S0141-0296(96)00150-2.
Jha G. (2007). "Artificial Neural Networks." Indian Agricultural Research Institute: 1-10.
Khuntia M., Stojadinovic B., and Goel S. (1999). "Shear strength of normal and high-strength fiber reinforced con-crete beams without stirrups." ACI Structural Journal 96(2).
Kwak Y., Eberhard M., Kim W. Kim, J. (2002). "Shear strength of steel fiber-reinforced concrete beams without stirrups." ACI Structural Journal 99(4).
Lee S. and Lee C. (2014). "Prediction of shear strength of FRP-reinforced concrete flexural members without stirrups using artificial neural networks." Engineering structures 61: 99-112. doi.org/10.1016/j.engstruct.2014.01.001.
Lim D. and Oh B. (1999). "Experimental and theoretical investigation on the shear of steel fibre reinforced concrete beams." Engineering structures 21(10): 937-944. doi.org/10.1016/S0141-0296(98)00049-2.
Lim T., Paramasivam P. and Lee S. (1987). "Shear and moment capacity of reinforced steel-fibre-concrete beams." Magazine of concrete research 39(140): 148-160. doi.org/10.1680/macr.1987.39.140.148.
Mansur M., Ong K. and Paramasivam, P. (1986). "Shear strength of fibrous concrete beams without stirrups." Jour-nal of structural engineering 112(9): 2066-2079. doi.org/10.1061/(ASCE)0733-9445(1986)112:9(2066).
Mashrei M., Seracino R. and Rahman, M. et al. (2013). "Application of artificial neural networks to predict the bond strength of FRP-to-concrete joints." Construction and Building Materials 40: 812-821. doi.org/10.1016/j.conbuildmat.2012.11.109.
Naik, U. and S. Y. Kute (2014). “Effect of Shear Span to Depth Ratio on Shear Strength of Steel Fiber Reinforced High Strength Concrete Deep Beam using ANN”. International Journal of Engineering Research and Technology, ESRSA Publications.
Narayanan R. and I. Darwish (1987). "Use of steel fibers as shear reinforcement." ACI Structural Journal 84(3). Parra-Montesinos, G. (2006). "Shear strength of beams with deformed steel fibers." Concrete International-Detroit- 28(11): 57.
Perera R., M. Barchín, Arteaga, A., and De Diego, A. (2010). "Prediction of the ultimate strength of reinforced concrete beams FRP-strengthened in shear using neural networks." Composites Part B: Engineering 41(4): 287-298. doi.org/10.1016/j.compositesb.2010.03.003.
Roberts T. and N. Ho (1982). "Shear failure of deep fibre reinforced concrete beams." International Journal of Ce-ment Composites and Lightweight Concrete 4(3): 145-152. doi.org/10.1016/0262-5075(82)90040-9.
Sanad, A. and M. Saka (2001). "Prediction of ultimate shear strength of reinforced-concrete deep beams using neural networks." Journal of structural engineering 127(7): 818-828. doi.org/10.1061/(ASCE)0733-9445(2001)127:7(818). Sharma A. (1986). "Shear strength of steel fiber reinforced concrete beams." ACI journal 83(4): 624-628.
Swamy R. and H. Bahia (1985). "The effectiveness of steel fibers as shear reinforcement." Concrete International 7(3): 35-40.
Swamy R., Jones R., and Chiam, A. (1993). "Influence of steel fibers on the shear resistance of lightweight concrete I-beams." ACI Structural Journal 90(1).