Experimental analysis of a mechanical shear connector
in concrete illed steel tube column
Análise experimental de um conector mecânico de
cisalhamento em pilar misto de aço e concreto
Abstract
Resumo
This work includes an analytical and experimental study of the structural behavior of shear connectors in composite columns, composed of concrete-illed circular hollow section. For this study was adopted a structural bolt like a shear connector in order to verify the validity of the ana -lytical expressions in ABNT NBR 16239: 2014 [1]. Was carried out a series of push-out tests, ixing the outer diameter of the hollow section and varying the thickness, the bolt diameter, the strength of concrete and the hole dimension. Analysis of the results shows that is possible to use this type of shear connector. The Brazilian prescriptions results are conservative and may be adjusted to provide strength capacity value closest to the experiment.
Keywords: concrete illed steel tube, circular hollow section, push-out test.
Este trabalho compreende um estudo analítico e experimental do comportamento estrutural de conectores de cisalhamento em pilares mistos, formados por peris tubulares laminados de seção circular de aço preenchido por concreto simples. Para este estudo foi adotado um conector do tipo parafuso estrutural, a im de veriicar a validade das expressões analíticas constantes na ABNT NBR 16239:2014 [1]. Foi realizada uma série de ensaios experimentais de cisalhamento direto, ixando o diâmetro externo do tubo e variando a espessura, o diâmetro do parafuso, a resis-tência do concreto e a presença ou não de folga no furo. Da análise dos resultados observa-se que é viável a utilização desse tipo de conector, que as equações existentes para o dimensionamento dos mesmos estão a favor da segurança e podem ser ajustadas para fornecer valores de capacidade resistente mais próximo do experimental.
Palavras-chave: pilar misto preenchido, seção tubular circular, ensaio de cisalhamento direto.
a Pontiical Catholic University of Goiás, School of Civil Engineering, Goiânia, GO, Brasil; b Federal University of Ouro Preto, Departament of Civil Engineering, Ouro Preto, MG, Brasil.
Received: 13 Oct 2015 • Accepted: 03 Feb 2016 • Available Online: 12 Jun 2017
J. G. R. NETO a
A. M. SARMANHO b
the pavement useful area; possibility to size de section so it can resist to the ire conditions; and better ductility and seismic resis-tance can be point out among 7.j0 the advantages to the use of composite columns.
According to ABNT NBR 8800:2008 [2]: Proile I of steel totally en-volved by concrete (Fig. 1-a); proile I of steel partially surrounded by concrete (Fig. 1-b); and steel tube with rectangular or circu -lar section illed by concrete (Fig. 1-c and 1-d) can be mentioned among the usual types of composite columns.
The composite columns formed by steel tubes illed with concrete have advantages towards the simple elements, mainly in function of the in-crement of the structural properties due to the interaction between the tubular proile and the concrete core. Besides this, the coninement existing mainly in the circular sections increases the resistance of the
the interface steel-concrete must not exceed a value of resistance, natural or extended by the addition of mechanical connectors. According to [3], the natural adherence can be divided into three distinct transfer mechanisms: adhesion (related to the chemical adherence between the concrete and the steel tube, - Figure 2-a -, it is developed in the initial stages of loading for small displace-ments and can be neglected for resistance efect); mechanical ad-herence (it results of the mechanical gearing between the concrete of the core and the supericial irregularities of the steel tube - Fig-ure 2-b -, breaches in the initial loading stages due to the increase of the relative displacement between the materials); and friction (resistance portion that depends on the normal force applied in the interface and on the coeicient of friction - Figure 2-c - related to the degree of roughness of the steel surface and to the condition of the interface. For tubular sections illed with concrete, the rule [2]
Figure 1
Types of cross-sections of composite columns. Source: [2]
B
B
B
B
A
C
B
speciies, as natural resistance to the shear, values of 0.4 and 0.55 MPa to rectangular and circular sections, respectively.
For the adherence by adhesion in composite columns, [5] analyses the results of the experimental tests of 104 prototypes with circular tubes, 49 with rectangular tubes and medium D/t ratios between 15 and 35, which shows that the adherence tension: is larger for the illed columns of circular section than for the squares; do not have relation to the concrete resistance; reduces with the increase of the D/t ratio in function of the biggest inluence of the retraction. With these results, it is suggested the expression to calculate the adherence tension be-tween the concrete and the steel, given by the Equation (1):
(1)
Where
f
2σ is the adherence tension in MPa;D
is the external diameter of the tube in mm, andt
is the tube thickness.In the load introduction regions, which are those where localized variations of the requesting efort occur due to the beam-column connections, or in those where the interruption of the longitudinal reinforcement occurs, as in column redresses or basis connec-tions, signiicant slip should be avoided in the interface between the two materials. Therefore, the length of the load introduction region represented by the parameter
l
v, as showed in Figure 3, does not have to exceed two times the smaller dimension of the column section or one third of the distance between points of load introduction, being adopted the smaller of these two values. An average value for the shear tension transferred longitudinally in the interface can be obtained by the Equation (2):(2)
Figure 2
Idealized models of shear transfer in steel - concrete interface. Source: Adapted of [4]
Adhesion Mechanical adherence Friction
B
B
B
A
B
C
Figure 3
Components of loads and geometric properties to calculate the shear stress at the interface. Source: [4]
Where
τ
Sd is the shear tension of calculus;N
c Sd, is the com-ponent of the normal force in the concrete;u
a is the transversal perimeter of the interface between steel and concrete; andl
v is the length of load transference.When the shear tension of calculus
τ
Sd exceeds the resistant nat-ural shear tension of calculusτ
Rd, the use of additional mecha-nisms of load transference must be foreseen. A usual manner is the application of shear connectors, as it is illustrated in Figure 4. Some researches related to the behavior of shear connectors and load transference in the interface steel-concrete for composite ele-ments are found in the literature. Among them, can be cited: [7], [8], [9], [10], [11] and [12], among others.[13] performed a number of experimental tests of 71 models for analysis of the structural behavior and load transference in tubular composite
col-umns, without and with the use of mechanical connectors of shear. The connector used was the M16 bolt degree 5.6 with 65 mm of length, acting on three conditions of loaded introduction: only applied to the steel tube; only applied to the concrete; and applied to both simultaneously. From the analyses of the relative displacements and the measured strains in the two components, it was observed that the load transference between the two materials is better with the use of connector.
This work studies a shear connector of the structural bolt type, with the objective to verify the validity of the analytical expressions con-tained in the tubular structures norm [1] and to analyze its structural behavior. A number of experimental push out tests was performed, ixing the external diameter of the tube and varying the thickness, the diameter of the bolt, the concrete resistance and the presence or not of looseness in the hole.
Figure 4
Example of application of load transfer device. Source: [6]
Join with steel plate welded Internal detail of shear connector fixed in CFST
B
B
A
B
Figure 5
2. Analytical model
The norm [1] presents two types of special devices that can be used as shear connectors in the load introduction region for composite columns. The model that will be studied in this work is the type 1 de-vice, where are used bolts (common or of high resistance) of which spacing between axles, in any direction, cannot be inferior to six times its diameter. The bolt head must be dotted with weld in the external side of the tubular proile to prevent its displacement during the concreting of the column. Figure 5 presents the referred device. The resistant force of calculus of each bolt is given by the lower obtained value of the Equations (3) and (4) presented below:
(3)
(4)
Where lb is the liquid length of the connecting bolt (deducting the thickness of the tube wall); db is the diameter of the connecting bolt; t is the thickness of the tube wall; fu is the breaking strength from the steel of the tube; fub is the breaking strength of the connecting bolt; and σc,Rd is the resistant tension of calculus of the concrete to
the contact pressure, obtained by the Equation (5).
(5)
Where fck is the distinctive concrete resistance to the compression; A2 is the loaded area; and A1 is the support area, considering A2/ A1 equal to 4.
3. Materials and experimental program
The experimental program was accomplished in the Structures Laboratory “Prof. Altamiro Tibiriçá Dias” of the Civil
Engineer-ing Department from the Federal University of Ouro Preto (UFOP), School of Mines. Two series of experimental push out tests were accomplished. In the series A, the external diameter of the tube was fixed and the thickness, the bolt diameter, the concrete resistance and the presence or absence of looseness in the puncture were varied. The series B was accomplished without the presence of shear connectors, in order to evalu-ate the natural adherence between the internal surface of the steel tube and the concrete core, besides the influence of the confinement.
3.1 Coniguration of the prototypes
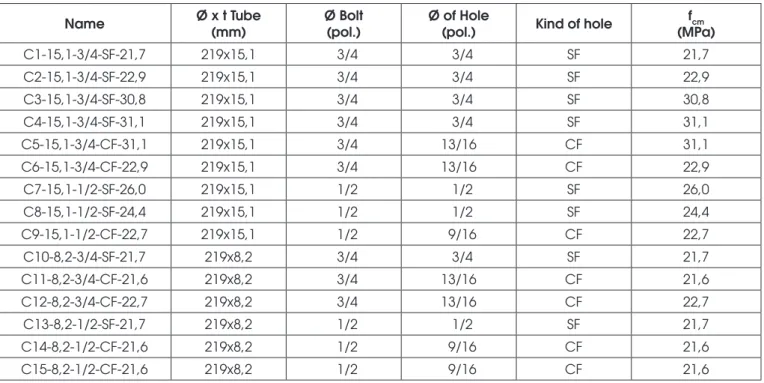
In series A, 15 experimental push out tests were accomplished using two sections of circular tubular steel proiles with diameter (D) of 219 mm and thicknesses (t) of 8.2 mm and 15.2 mm, in order to evaluate the inluence of the D/t slenderness in the composite column behavior.<0} All the bolts possess length of 4 “ (101.6 mm) and diameters of 1/2 “ (12.7 mm) and 3/4 “ (19 mm), being used a total of 4 units for each model. The total length of all the prototypes was of 1000 mm and two typologies of concrete fck were adopted, 20 and 30 MPa. Another evaluated factor was the inluence that the puncture looseness, usually adopted in the manufacture process to facilitate the structure assembly, could have on the connector’s behavior. Thus, mod-els with adjusted punctures had been confectioned, i.e., without looseness (SF), and others with looseness (CF) varying the type of drill used for the perforation.
Table 1 shows the nomenclature and the geometrical and mechan-ical characteristics of the prototypes. It is observed that the values of fcm were obtained through characterization tests in the test day of each prototype. The models C11 and C14 did not had their results availed for analysis, due to problems that occurred during the ex-ecution of their tests.
The connectors were positioned at half height of the steel tube and organized symmetrically, as indicated in Figure 6-a. The head of all the bolts were welded in the external wall of the tube, to prevent
Table 1
Names and characteristic of experimental models of serie A
Name Ø x t Tube (mm)
Ø Bolt (pol.)
Ø of Hole
(pol.) Kind of hole
fcm (MPa)
C1-15,1-3/4-SF-21,7 219x15,1 3/4 3/4 SF 21,7
C2-15,1-3/4-SF-22,9 219x15,1 3/4 3/4 SF 22,9
C3-15,1-3/4-SF-30,8 219x15,1 3/4 3/4 SF 30,8
C4-15,1-3/4-SF-31,1 219x15,1 3/4 3/4 SF 31,1
C5-15,1-3/4-CF-31,1 219x15,1 3/4 13/16 CF 31,1
C6-15,1-3/4-CF-22,9 219x15,1 3/4 13/16 CF 22,9
C7-15,1-1/2-SF-26,0 219x15,1 1/2 1/2 SF 26,0
C8-15,1-1/2-SF-24,4 219x15,1 1/2 1/2 SF 24,4
C9-15,1-1/2-CF-22,7 219x15,1 1/2 9/16 CF 22,7
C10-8,2-3/4-SF-21,7 219x8,2 3/4 3/4 SF 21,7
C11-8,2-3/4-CF-21,6 219x8,2 3/4 13/16 CF 21,6
C12-8,2-3/4-CF-22,7 219x8,2 3/4 13/16 CF 22,7
C13-8,2-1/2-SF-21,7 219x8,2 1/2 1/2 SF 21,7
C14-8,2-1/2-CF-21,6 219x8,2 1/2 9/16 CF 21,6
the displacement during the concreting and to assure the horizon-tality (see detail in Figure 6-b).
In series B, 4 experimental push out tests were accomplished us-ing two sections of circular tubular steel proiles with diameter (D) of 219 mm and thicknesses (t) of 8.2 mm and 15.2 mm, without shear connector (SC), with total length also of 1000 mm. This se-ries was tested in order to verify the behavior of the natural adher-ence tension between the internal wall of the steel tube and the illing concrete, in addition to evaluate the inluence the D/t slen-derness on its behavior.
The Table 2 shows the nomenclature and the geometrical and me-chanical characteristics of the prototypes. It is observed that the values of fcm are equal for all the pieces, since only one character-ization of the concrete was accomplished, due to the prototypes that were tested during four consecutive days.
3.2 Concreting
The concreting of the series A models was accomplished in two stages, one for each type of concrete fck (20 and 30 MPa). Before the concreting, the pieces were cleaned internally.Figure Figure 7-a shows the prototypes prepared for concreting and the Figure 7-b indicates an internal detail of the load transference mechanism. To get a startle region of concrete in the top of the column and a re-gion of void in the root that could enable the relative displacement between the steel tube and the core of concrete, a ring of 50 mm was welded (see Figure 8-a), formed by the same proile of each model, in the top of the prototype. The pieces were concreted in inverted position of the test and on a wooden plate, so that a sur-face of leveled and smooth load application was obtained when the ring was removed. This way, a space of approximately 50 mm was left unilled during the concreting, as is shown in Figure 8-b. This procedure was adopted in the concreting of the series A and B.
The concreting of the series B models followed the same proce-dure of the A series. However, a single stage was accomplished, since there was only one type of concrete fck (20 MPa).
3.3 Characterization of the steel
The structural tubes used were manufactured by the company Val-lourec & Mannesmann (V&M) Tubes do Brasil, which provided the results for the tests of mechanical characterization of the steel in Table 3. The steel used in the tubular proiles manufacture was VMB350 type (values of reference: fy ≥ 350 485 MPa and fu ≥ MPa, the 501 norm ASTM degree B).
The structural bolts were manufactured by the CISER company, which provided the results of the steel characterization tests pre-sented in Table 4. The steel of the bolts was of the SAE J429 type (fu≥ 414 MPa, dimensional norm ASME B18.2.1).
3.4 Instrumentation
All the prototypes of the series A were instrumented with two
Figure 6
Position of bolts in the steel tube and welding darning detail of serie A
A
B
Table 2
Names and characteristic of experimental models
of serie B
Name Ø x t Tube (mm)
Ø Bolt (pol.)
Figure 7
Preparation of models of the serie A to concreting
A
B
Figure 8
Details to obtain a gap of 50 mm in concrete
A
B
Table 3
Mechanical properties of steel of tubes
Table 4
Mechanical properties of steel of bolts
Ø x t Tube (mm)
fy (MPa)
fu (MPa)
Elongation (ΔL) (%)
219x8,2 385 582 33
219x15,1 384 598 41
Bolt Ø x l
linear displacement transducers (Linear Variable Displacement Transducer - LVDT) located on the top of the column, measuring the relative displacement between the steel tube and the concrete core (see Figure 9). The LVDTs were ixed in the external surface of the steel tube with the help of magnetic bases. To enable the
reading of the relative displacement between the steel tube and the concrete core, a rigid plate supported in the superior surface of the concrete region (between the prototype and the kneecap) and an angled connector ixed in the lateral of the concrete (to see detail in Figure 10) were used.
Figure 9
Representation of LVDT´s position
Figure 10
This measurement in two spots was fulilled so that, having failure in the reading of one LVDT, the other could continue the measure-ments. Due to problems in the setting of the angled connector that appeared during the course of some tests, its results in the series A were discarded, without prejudice to the results obtained by the other LVDT. Yet, in series B, this system of additional measurement was not adopted.
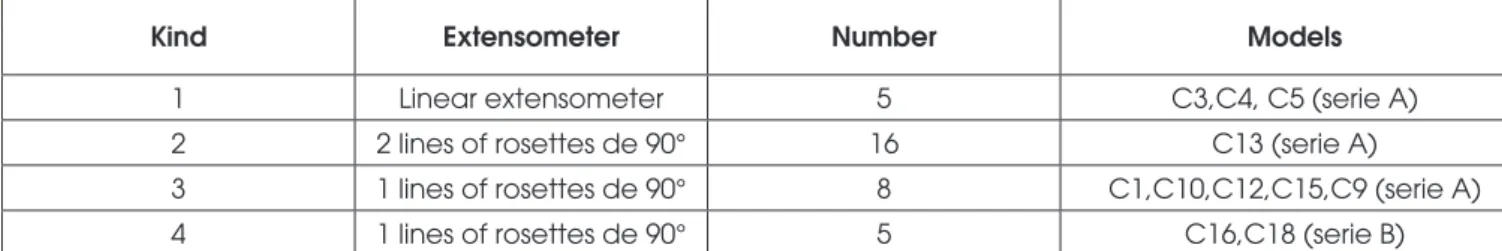
The strain gauges was not same for all the prototypes, sufering changes of typology of electrical resistance strain gauge (EER) and of position, during the evolution of the tests. The irst strain gauges typology adopted was with the use of linear strain gaug-es (KFG-5-120-C1-11 model). The other ongaug-es were adopted with the use of 90º rosettes (model KFG-2-D16-11), both of the KYOWA brand. Table 5 shows the models distribution for each one of the four typologies of strain gauges adopted, presenting the type of strain gauge and the quantity. The pieces that are not
displayed in the table, did not receive strain gauges.
Figure 11 illustrates the position of the strain gauges in the steel tube and the general instrumentation of the pieces.
3.5 Experimental procedure
For the accomplishment of the tests, a serf hydraulic press HVL model of the SATEC series was used, manufactured by the com-pany Instron with load cell with capacity of 2.000 kN.
The compression load was directly applied to the concrete core by displacement control. Once there was not a standard test procedure to be followed, an adaptation of the procedure speciied by the Euro-code [14] was made for tests in shear connectors, as follows: n The approach of the load application plate for all the stages
was made by displacement control of 2 mm/min until reaching a load of 3 kN.
Table 5
Distribution of models for each kind of extensometer adopted
Kind Extensometer Number Models
1 Linear extensometer 5 C3,C4, C5 (serie A)
2 2 lines of rosettes de 90° 16 C13 (serie A)
3 1 lines of rosettes de 90° 8 C1,C10,C12,C15,C9 (serie A)
4 1 lines of rosettes de 90° 5 C16,C18 (serie B)
Figure 11
Example of instrumentation models
Strain gages position Test setup and instrumentation of test specimen
B
B
The results of the prototypes C11 and C14 were discarded of this analysis, due to problems occurred during the execution of its tests. The Table 6 shows the values of the maximum forces applied to the extremity of the concrete core, compared with the following resis-tant capacities of the transversal sections: concrete by the simple compression (Acfc), concrete in conined state (Acσc,Rd), yield (Aafy) and crushing of the steel tube (Aafu).
It is observed that the applied force overcomes the simple compres-sive strength of the concrete (relation (1)/(2)) from 1.68 to 3.19 times. This shows that the concrete is found in a multiaxial state of tensions, generated by the coninement efect of the concrete core through the walls of the steel tube, which extends its resistant capacity.
Analyzing the relation between the applied force and the resistant capacity of the conined concrete (relation (1)/(3)), it is veriied that the values are between 1.18 and 2.24. This fact evinces that the consideration of the coninement efect leads to the results closer to the experimental ones. It can also be observed that the Equation (5), used to determine σc,Rd, leads to conservative values if
com-that, in this point, the connector loses the admitted elastic-linear behavior for the project conditions. Similarly to what occurs in push out tests for evaluation of composite beams connectors [15], the results of identical models present signiicant variability that can be caused mainly by the form of concreting, densiication and ag-gregates arrangement.
Of the values presented in Table 7, it can be observed that the dominant failure mechanism of the norm analytical expressions [1] is the crush of the concrete in the region of contact with the bolt. However, it is observed that the experimental values pres-ent a variation of 1.71 to the 6.11 times bigger that the theo-retical. This indicates that the simpliied analysis and isolation of failure mechanisms leads to resistant conservative capacity values. The experimental analysis suggests that there is an in-crease in the load capacity of the connector. This gain can be explained by the interaction between the collapse mechanisms, ampliied by the coninement efect in concrete.In the columns C2 and C15 openings were made to observe the deformed coniguration of the end connectors 3/4 “and 1/2 “ respectively
Table 6
Comparison between applied force and resistant capabilities of steel and concrete
Model
Applied force
(KN)
Concrete Steel Relarion
Compression resistence (kN) Afc Confinement resistence (kN) Aσc,Rd
Yield resistence (kN) Afy Ultimate resistence (kN) Afu (1) / (2) (1) / (3) (1) / (4) (1) / (5)
(1) (2) (3) (4) (5)
C1 1.940 608 868 3.714 5.629 3,19 2,24 0,52 0,34
C2 1.800 641 915 3.714 5.629 2,81 1,97 0,48 0,32
C3 1.894 862 1.232 3.714 5.629 2,20 1,54 0,51 0,34
C4 1.900 871 1.243 3.714 5.629 2,18 1,53 0,51 0,34
C5 1.889 871 1.243 3.714 5.629 2,17 1,52 0,51 0,34
C6 1.813 641 915 3.714 5.629 2,83 1,98 0,49 0,32
C7 1.375 728 1.039 3.714 5.629 1,89 1,32 0,37 0,24
C8 1.190 683 977 3.714 5.629 1,74 1,22 0,32 0,21
C9 1.925 636 907 3.714 5.629 3,03 2,12 0,52 0,34
C10 1.451 700 999 2.091 3.247 2,07 1,45 0,69 0,45
C12 1.699 732 1.045 2.091 3.247 2,32 1,63 0,81 0,52
C13 1.334 700 999 2.091 3.247 1,91 1,33 0,64 0,41
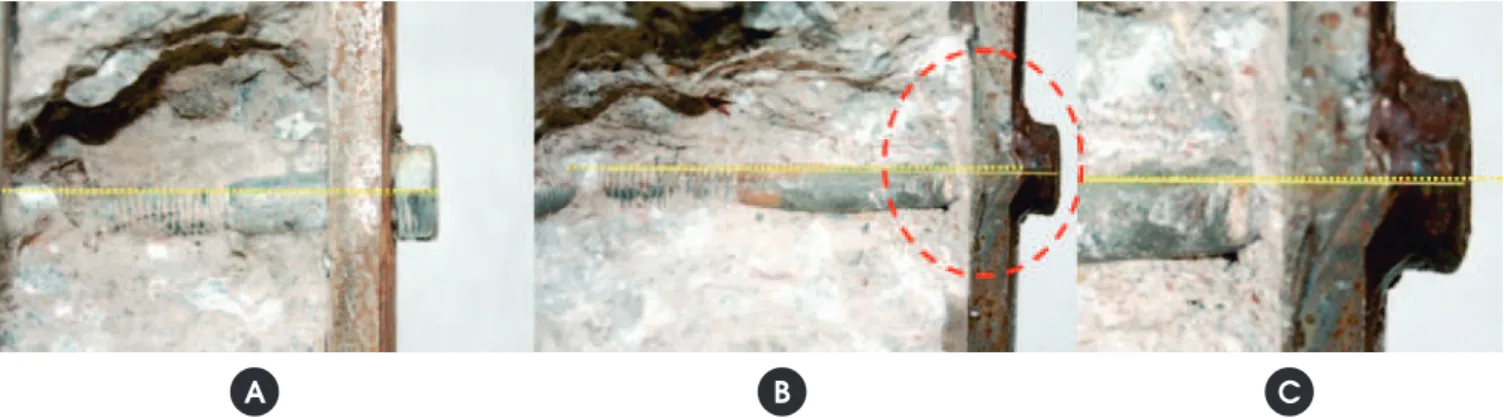
(Figure 12-a and Figure 12-b ). It can be observed in detail the bending of the bolt and the concrete shows no cracks around. Figure 12-c shows a detail of the shearing deformation at the interface region between the steel tube and the concrete to the model with connector 1/2 “ , with visible stem vertical displace-ment relative to the bolt head.
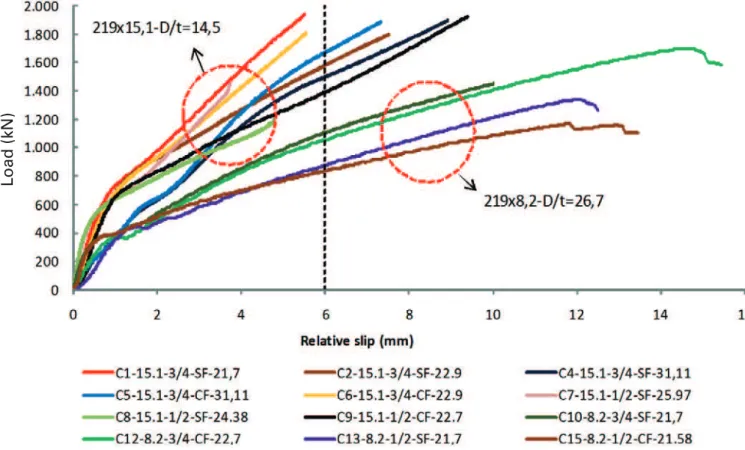
Figure 13 shows the curves load versus relative displacement to all the prototypes of series A. The 6 mm ofset value is high -lighted as a reference to characterize the behavior and stifness, according to the classiication criterion [14].
A clear separation of the curves in two groups can be observed, the ones of 219x8.2 proiles with index of slenderness D/t of 26.7, and the ones of 219x15.1 with D/t of 14.5. It is veriied, this way, that the tube slenderness inluences in the load capacity and the ductility of the connector. The tubes with slenderness of 26.7 are more lexible and ductile than the ones of slenderness 14.5. It is observed that all the tubes with thickness 8.2 mm pre-sented values of relative displacements well above 6 mm, while
some of the tubes of 15.1 mm present lower values and slightly superior others.
Analyzing Figure 14, that presents the load curves versus rela-tive displacement only for the prototypes manufactured with 219x8.2 tube and concrete with fck of 20MPa, we can observe that the 3/4” connectors present a bigger rigidity and support more load than the ones of 1/2”. The other prototypes have simi-lar behavior.
To verify the inluence of the puncture looseness in the struc-tural behavior of the connector and in the resistance, Figure 15 Figure presents the curves of the C8 and C9 models, in the initial phase of the loading. It can be observed that the model with looseness (C9) presents a bigger relative displacement for the same load level than the model without looseness (C8) until a level of displacements of approximately 1.0 mm, value next to half the puncture looseness (0.8 mm, dashed line on the graph). Once after this two curves values meet and continue parallel, it can be concluded that the looseness is eliminated and the
Table 7
Comparison of resistance of shear connectors
Model Concrete verification (kN) Concrete verification (kN) Shear of bolt (kN) Crushing the tube wall (kN)
VRd, teo (kN)
VRd,exp (kN)
VRd,exp VRd, teo
(3) (4) (5)
C1-15.1-3/4-SF-21,7 51 56 76 413 51 163 3,18
C2-15.1-3/4-SF-22,9 54 59 76 413 54 191 3,55
C3-15.1-3/4-SF-30,8 73 80 76 413 73 124 1,71
C4-15.1-3/4-SF-31,1 73 81 76 413 73 133 1,81
C5-15.1-3/4-CF-31,1 73 81 76 413 73 140 1,91
C6-15.1-3/4-CF-22,9 54 59 76 413 54 171 3,18
C7-15.1-1/2-SF-26,0 41 30 33 275 30 125 4,17
C8-15.1-1/2-SF-24,4 38 28 33 275 28 133 4,72
C9-15.1-1/2-CF-22,7 36 26 33 275 26 160 6,11
C10-8.2-3/4-SF-21,7 55 56 76 218 55 95 1,72
C12-8.2-3/4-CF-22,7 58 59 76 218 58 98 1,69
C13-8.2-1/2-SF-21,7 37 25 33 146 25 105 4,20
C15-8.2-1/2-CF-21,6 37 25 33 146 25 88 3,51
Figure 12
Deformed final configuration of the connectors: (a) Detail of connector of model C2; (b) Detail of
connector of model C15; (c) Shear detail on connector of the model C15
columns now have the same structural behavior.
Figure 16 presents the vertical and diametrical deformation curves measured along the tube length for prototype C1, 400 mm above and below the connectors’ position (center) for dif-ferent loading levels, varying from 10 to 100% of the maximum load applied. It is observed that, for the initial loading stages un-til 387 kN (20%), the deformations are approximately constant along the tube length, indicating that the load transfer between the concrete core and the tube wall is done in a gradual way through the natural adherence mechanisms. For the loading lev-els from 580 kN (30%), it is veriied that the mechanic connec-tors start to be requested and to be part of the loading transfer system, due to the non-parallelism of the vertical deformations. For the diametrical deformations, it is observed the same efect
for the initial loading stages with large increases of deforma-tions for the levels from 580 kN (30%) in the nearest region, below the connector. This fact evidences the emergence of the coninement tensions that tend to expand the tube diametrically.
4.2 Series B
This series was accomplished without the presence of shear connectors, in order to evaluate the natural adherence between the internal surface of the steel tube and the concrete core, besides the inluence of the conine-ment. Figure 17 presents the overlay of the load curves versus relative displacement obtained for the four tested prototypes. The inluence of the D/t slenderness is observed graphically in the tension of natural adher-ence, caused mainly by the action of the coninement efect.
Table 8 presents the values of applied load and relative displace-ment, measured in the point of natural adherence loss between
Figure 13
Overriding load curves versus displacement on the series A
Figure 14
Curves load versus displacement relative for the tests
with tubular section 219x8,2 mm e fck de 20 MPa
Figure 15
the concrete core and the steel tube, considered as being the irst point of inlection of the curves.
Table 9 presents the values of the experimental adherence tension (τexp), calculated based on the Equation (2). A comparison with the
value of reference (τRd) established by the norm [2] for illed circular
tubes and the value of f2σ proposed by [5], which is calculated by the Equation (1), is also done.
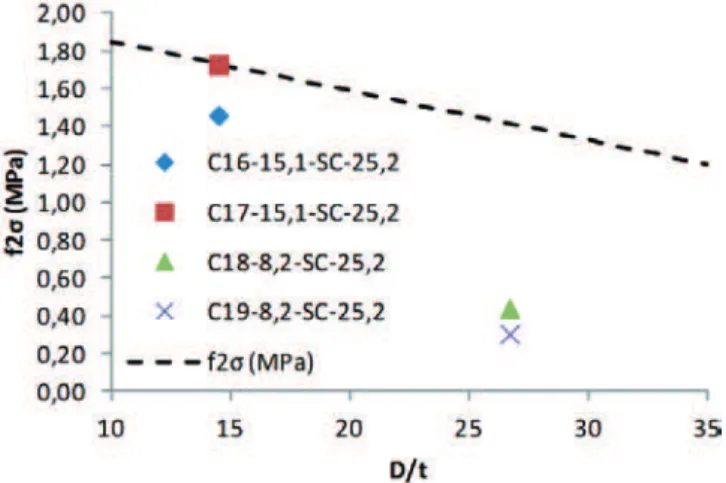
It can be observed that the relations between the tension of ex-perimental adherence and the tension obtained by the Equation (1) (τexp/f2σ), for the C16 and C17 models (219x15.1), present values
of 0.84 and 1.00 with average of 0.92. Yet, for the C18 and C19 models (219x8.2), these values are of 0.31 and 0.22 with average of 0.27. This indicates that, for sections with lower slenderness (D/
t=14.5), the proposal of the equation presents a good correlation with the experimental values. However, when it comes to sections with greater slenderness (D/t=26.7) the obtained values are over-estimated with relation to the ones obtained experimentally. This behavior can be observed in Figure 18Figure , which presents the curve f2σ versus D/t compared with the natural adherence tensions obtained from the tests.
When the experimental values are compared with the reference value (τRd) equal to 0.55 MPa, it is observed that, for the C16 and C17 prototypes, the relations are of 2.66 and 3.14 with average of 2.9. Yet, for the C18 and C19 models, these values are of 0.80 and 0.56 with average of 0.68. Of these values, it can be veriied that, for sections with lower slenderness (D/t=14.5) the
experimen-Figure 16
Distribution curves of the strains along the tube - C1-15.1-3/4-SF-21,7
Vertical strain
Diametral strain
B
B
A
Table 8
Load applied and relative slip of loss of natural
bond – série B
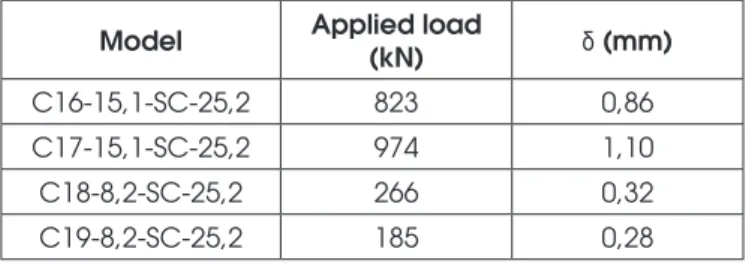
Model Applied load
(kN) δ (mm) C16-15,1-SC-25,2 823 0,86 C17-15,1-SC-25,2 974 1,10
C18-8,2-SC-25,2 266 0,32
C19-8,2-SC-25,2 185 0,28
Figure 17
Curves load versus relative displacement series B
tal values are well superior to the normative referential. However, for sections with greater slenderness (D/t=26.7), these values are lower, being against the security for the conditions admitted in proj-ect situation.
Figure 19 presents the overlay of the load curves versus rela-tive displacement for all the prototype confectioned with 219x8.2 tube of the series A and the B. The division of the curves in three groups, characterized by the absence of connector, and presence of 1/2 “ and 3/4 “ connectors, can be observed. It is veriied that the presence of the connector inluences in the load capacity of the prototype, increasing, as well, with the increase of the bolt di-ameter. It is observed that, for a same loading level, the relative displacements decrease with the presence and increase of de con-nector diameter.
Figure 20 presents the overlay of the load curves versus rela-tive displacement for some of the confectioned prototypes with 219x15.1 tube of the series A, in order to facilitate the visualiza-tion, and the two of series B with relative displacement limited to 4 mm. It can be observed that the division of the curves into three groups characterized by the absence of connector, pres-ence of 1/2” connectors and 3/4” connectors. Diferently from
what was observed for the confectioned models with 219x8.2 tubes, it is veriied that the presence and the increase of the connector diameter reduces the load capacity of the proto-type. It is observed that, for a same loading level, the relative displacements increase with the presence and increase of de connector diameter. This behavior can indicate that, for sec-tions with lower D/t slenderness where the natural adherence tension is enough to assure the total interaction between the
Table 9
Experimental bond stress
Model Applied
load (kN) (MPa)τexp
f2σ
(MPa) (MPa)τRd τexp/f2σ τexp/τRd
C16-15,1-SC-25,2 823 1,46 1,73 0,55 0,84 2,66
C17-15,1-SC-25,2 974 1,73 1,73 0,55 1,00 3,14
C18-8,2-SC-25,2 266 0,44 1,41 0,55 0,31 0,80
two materials, the utilization of shear connectors can reduce the resistance capacity of connection and increase the relative displacements. A possible reason for this is that the presence of the shear connectors introduces regions of tensions concentra-tion in the interface between the steel and the concrete, which induce to a premature loss of the natural adherence tension be-tween the two materials.
Figure 21 presents the distribution of vertical and diametrical ten-sions for the C16-15.1-SC-25.2 prototype. It is observed that, due to the absence of shear connector, the distribution of the verti-cal tensions (Figure 21-a) occur homogeneously along the tube length. In relation to the distributions of the diametrical tensions (Figure 21-b), it is veriied that they occur homogeneously and ap-proximately constant along the length, presenting a variation re-gion close to the load application point. This behavior indicates that the low slenderness of the 219x15.1 section promotes a strong inluence of the coninement in the composite column that, even
without shear connector, presents high rigidity and load capacity when compared with the 219x8.2 tube.
5. Conclusions
The analysis of the experimental results of push out tests (se-ries A), aiming to the study of the structural behavior of bolts as mechanic shear connector in composite steel tubular column, demonstrates that the utilization of this type of element is vi-able. It can be observed, as well, that the results of the resis-tance obtained by the tests were above the obtained values by the expressions of resistance presented in the ABNT NBR 16239:2014. This way, it is veriied that the equations are in favor of the security and can be adjusted to provide a value of resistance closer to the experimental.
From de analysis of the load curves versus relative displacement, it can be concluded that the bolts present a ductile and lexible be-havior, being this a fundamental characteristic for its application as shear connector. The D/t slenderness of the tube inluences in the rigidity and in the resistance of the connection, due to the increase of the concrete coninement tensions. The presence of looseness in the puncture exert inluence in the rigidity of the connection, just in the initial stages of loading, not interfering in a signiicant way in the global behavior of the connector.
The distribution of the vertical and diametrical deformations along the tube wall conirms the eiciency of the mechanical connection mechanism in the transference of the shear eforts in the interface between the two materials, mainly for the proto-types with tube thickness of 8.2 mm that possess a lower natural adherence. It is also clear the presence of the coninement ten-sions that tend to expand the tube diametrically and increase the concrete resistance.
For the obtained results in series B, it is observed that the refer-ence value of the natural adherrefer-ence tension established by the ABNT NBR 8800:2008 is underestimated for the circular sections with low D/t slenderness, but overestimated for the lower thick -ness sections when compared with the experimental values. Such
Figure 18
Comparison between curve f2
σ
in function of D/t
ratio, and the variation of the experimental natural
bond stress for the tested models
Figure 19
Comparison between the curves load versus
displacement relative to the tube 219x8,2 of series A
and B
Figure 20
Comparison between the curves load versus
Figure 21
Distribution curves of the strains along the tube - C16-15,1-SC-25,2
Diametral strain
B
Vertical strain
B
A
connection between the steel interface and the concrete. This ob-servation is not entirely conclusive, requiring further analysis.
6. Acknowledgements
The authors of this work acknowledge the furtherance organs CNPq, CAPES, FAPEMIG, and the company Vallourec & Man-nesmann do Brasil. To PUC-GO and, principally, to UFOP for the logistical and inancial support.
7. References
[1] ASSOCIAÇÃO BRASILEIRA DE NORMAS TÉCNICAS. Projetos de estruturas de aço e de estruturas mistas de aço e concreto de ediicações com peris tubulares. - NBR 16239, Rio de Janeiro, 2014.
[2] ASSOCIAÇÃO BRASILEIRA DE NORMAS TÉCNICAS. Projetos de estruturas de aço e de estruturas mistas de aço e concreto de edifícios. - NBR 8800, Rio de Janeiro, 2008. [3] OLIVEIRA, W. L. A. Análise teórico - experimental de
pila-res mistos preenchidos de seção circular, São Carlos, 2008, Tese (doutorado) - Escola de Engenharia de São Carlos, Universidade de São Paulo, 251 p.
[4] JOHANSSON, M. Composite action in connection regions of concrete-illed steel tube columns. Steel and composites Structures, v. 3, n. 1, 2003.
[5] ROEDER, C. W., CAMERON, B., BROWN, C. B. Compos-ite action in concrete illed tubes. Journal of Structural Engi-neering, v. 125, n. 5, p. 477-484, 1999.
[6] CODEME, E. Edifício para hotel. Guaratinguetá - SP, 2012. [7] VERÍSSIMO, G. S. Desenvolvimento de um conector de
cis-alhamento em chapa dentada para estruturas mistas de aço e concreto e estudo do seu comportamento. Belo Horizonte, 2007, Tese (doutorado) - Escola de Engenharia Civil, Univer-sidade Federal de Minas Gerais, 316 p.
[8] SIMÕES, R.. Efeito do coninamento em pilares mistos cur-tos de aço e concreto. Campinas, 2008, Dissertação (mes-trado) - Faculdade de Engenharia Civil, Arquitetura e Urban-ismo, Universidade Estadual de Campinas, 152 p.
[9] NGUYEN, H. T. e KIM, S. E. Finite element modeling of push-out tests for large stud shear connectors. Journal of Constructional Steel Research, n. 6, p. 273-284, 2009. [10] JACOBS, W.P. e HAJJAR, J. F. Load transfer in composite
constructions. ASCE 2010 Structures Congress, Orlando, Flórida, 2010.
[11] BEZERRA, L. M.. Estudo Teórico Experimental da ligação entre pilares mistos preenchidos e vigas pré-moldadas de concreto. São Carlos, Tese (doutorado) - Escola de Engen-haria de São Carlos, Universidade de São Paulo, 260 p. [12] ALMEIDA, P. H. F. Modelo numérico para um dispositivo de
transferência de carga em pilares mistos tubulares preen-chidos com concreto. Iberian Latin American Congress on Computational Methods in Engineering - CILAMCE, Ouro Preto, 2011.
[13] STAROSSEK, U. e FALAH, N. The interaction of steel tube and concrete core in concrete-illed steel tube columns. Tu -bular Structures XII, London, 2011.
[14] EUROPEAN COMMITTEE FOR STANDARDISATION. De-sign of composite steel and concrete structures. EURO-CODE 4, Brussels, 2001.