The growing demand for knowledge about the effect of high temperatures on structures has stimulated increasing research worldwide. This article presents experimental results for short composite steel and concrete columns subjected to high temperatures in ovens with or without an axial compression load, numerically analyzes the temperature distribution in these columns after 30 and 60 minutes and compares them with experimental results. The models consist of concrete-illed tubes of three different thicknesses and two different diameters, and the concrete ill has conventional properties that remained constant for all of the models. The stress-strain behavior of the composite columns was altered after exposure to high temperatures relative to the same columns at room temperature, which was most evident in the 60-minute tests due to the higher temperatures reached. The computational analysis adopted temperature rise curves that were obtained experimentally.
Keywords: ire, composite columns, steel, concrete.
A crescente demanda por conhecimento sobre a ação de altas temperaturas nas estruturas vem impulsionando pesquisas em todo o mundo. Este artigo tem por objetivo apresentar resultados experimentais de pilares mistos curtos de aço e concreto submetidos a altas temperaturas em fornos, com e sem ação de carregamento de compressão centrada, assim como analisar numericamente a distribuição da temperatura nesses pilares, nos tempos de 30 e 60 minutos e compará-los aos resultados experimentais. Os modelos adotados são tubos preenchidos com concreto, com três espessuras e dois diâmetros diferentes para os tubos, e o concreto de preenchimento com propriedades convencionais que se mantive-ram constantes para todos os modelos. O comportamento força – deformação dos pilares mistos foi alterado após exposição à altas temperaturas em relação aos mesmos pilares em temperatura ambiente, sendo mais evidente nos ensaios de 60 minutos, os quais atingiram temperaturas mais elevadas. Na análise numérica adotaram-se curvas de elevação de temperatura que foram obtidas experimentalmente.
Palavras-chave: concreto autoadensável. métodos de dosagem. propriedades no estado fresco e endurecido.
Short steel and concrete columns under high
temperatures
Pilares mistos curtos de aço e concreto sob altas
temperaturas
A. E. P. G. A. JACINTHO a [email protected] V. P. SILVA b [email protected] J. A. V. REQUENA c [email protected] R. C. C. LINTZ d [email protected] L. A. G. BARBOSA e [email protected] L. L. PIMENTEL f [email protected]
a PUC-Campinas, Civil Engineering, [email protected], Rodovia Dom Pedro km136 s/n 13086-900, Campinas-SP, Brazil; b USP, POLI, PEF, [email protected], São Paulo-SP, Brazil;
c UNICAMP, FEC, DES, [email protected], Campinas-SP, Brazil; d UNICAMP, FT, [email protected], Limeira-SP, Brazil; e UNICAMP, FT, [email protected], Limeira-SP, Brazil;
f PUC-Campinas, Civil Engineering, [email protected], Campinas-SP, Brazil.
Abstract
1. Introduction
Structures lose their load bearing capacity when they are exposed to high temperatures. The strength and rigidity of steel are reduced with increasing temperature, and in addition to losing these proper-ties, concrete suffers a reduction in area due to the “spalling” phenom-enon.The composite system of concrete-illed steel tubes, beyond in -creasing the structure’s load bearing capacity at room temperature, allows for greater exposure times to high temperatures compared to the same materials evaluated separately. Because the concrete is conined, it does not suffer from spalling, as the wall of the steel tube prevents the displacement of the concrete by not allowing a reduction in area. The presence of microcracks in the concrete helps to slow the deformation and internal heating of the illed steel tube. This type of composite structure collapses when the steel and concrete lose their load bearing capacity due to reductions in strength and rigidity, caus-ing them to be incapable of supportcaus-ing the applied load.
Studies conducted in Europe and the United States concluded that the reduction in the strength of composite columns at high tem-peratures depends on the following factors: the duration of the ex-posure, temperature, column diameter, type of concrete, thickness of the steel tube and strengths of the concrete and steel.
Figure 1 – Temperature elevation
curve with pre-heating
0 5 10 15 20 25 30 35 40 45 50 55 60 65 70 75 80 85 90 0
200 400 600 800 1000
Temperature (ºC)
Time (min)
Pré heating ISO 834
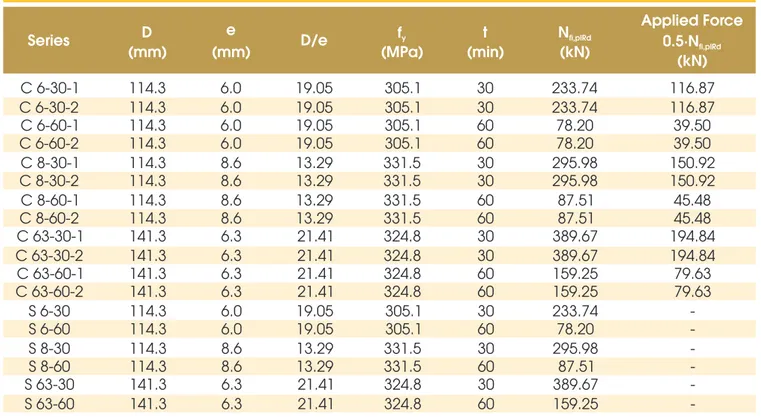
Table 1 – Characteristics of the models tested and the load applied during the tests
Series
D
(mm)
(mm)
e
D/e
(MPa)
f
yt
(min)
N
fi,plRd(kN)
Applied Force
0.5·N
fi,plRd(kN)
C 6-30-1
114.3
6.0
19.05
305.1
30
233.74
116.87
C 6-30-2
114.3
6.0
19.05
305.1
30
233.74
116.87
C 6-60-1
114.3
6.0
19.05
305.1
60
78.20
39.50
C 6-60-2
114.3
6.0
19.05
305.1
60
78.20
39.50
C 8-30-1
114.3
8.6
13.29
331.5
30
295.98
150.92
C 8-30-2
114.3
8.6
13.29
331.5
30
295.98
150.92
C 8-60-1
114.3
8.6
13.29
331.5
60
87.51
45.48
C 8-60-2
114.3
8.6
13.29
331.5
60
87.51
45.48
C 63-30-1
141.3
6.3
21.41
324.8
30
389.67
194.84
C 63-30-2
141.3
6.3
21.41
324.8
30
389.67
194.84
C 63-60-1
141.3
6.3
21.41
324.8
60
159.25
79.63
C 63-60-2
141.3
6.3
21.41
324.8
60
159.25
79.63
S 6-30
114.3
6.0
19.05
305.1
30
233.74
-
S 6-60
114.3
6.0
19.05
305.1
60
78.20
-
S 8-30
114.3
8.6
13.29
331.5
30
295.98
-
S 8-60
114.3
8.6
13.29
331.5
60
87.51
-
S 63-30
141.3
6.3
21.41
324.8
30
389.67
-
S 63-60
141.3
6.3
21.41
324.8
60
159.25
-
D – external diameter (mm) e thickness of the tube (mm)
fy characteristic strength of the steel (MPa) t time
Nfi,plRd value for the calculated normal compression strength in the situation of a fire, as obtained by the computational program SuperTempcalc (ANDERBERG [2])
– – –
also determined in the present study by computational analysis using the program SuperTempcalc (ANDERBERG [2]).
As observed in Figure 2, for the case of a general composite col-umn illed with concrete with the application of a constant stress and temperature variations, at the instant when the curve of axial displacement versus time reaches a maximum (part I), the steel tube is absorbing almost the entire applied load. After this point (part II), the steel tube begins to lose its strength and begins plastic deformation, thereby transferring stresses to the concrete. Thus, when using a load equal to 50% of the load bearing capacity of the composite section at the temperature of a ire, this deforma -tion peak in part I will not be reached, and the sec-tion will not suffer plastic deformation. The results of tests at room temperature were obtained by Simões [3], whose tested prototypes that had identical dimensions to those used in the present study.
3. Characteristics of the short columns
As shown in Figure 3, 3/16’’-diameter holes were made in the steel tubes before the concrete was added to allow for the insertion of thermocouples at standardized internal points for all of the tests. After curing, the plugs used to prevent the closure of the holes during the curing process were removed to permit insertion of the thermocouples.
Five thermocouples were placed in each model: two in the con-crete core, two at the steel-concon-crete interface and one on the ex-ternal surface of the steel tube.
4. Environment and equipment
The Structures Laboratory of the State University of Campinas (Universidade Estadual de Campinas) was used for the tests. A 5,000-kN capacity press, a 600-kN capacity press and an oven capable of achieving temperatures up to approximately 1,200ºC were used for the tests.
The oven used for the tests has the capacity to produce tempera-The main objective of the present study was to analyze the
loss of load bearing capacity of short columns after they are subjected to a fire; the short columns used are those whose normal compression strength is not affected by their slender-ness. For this purpose, the behavior of short composite steel-concrete columns was studied using physical experimental tests, measuring the increase in temperature of the surface and internal points of these columns for 30 and 60 minutes of heating according to temperature elevation curves similar to the ISO 834 [1] curve, as shown in Figure 1. Pre-heating to 200ºC was necessary so that the curve followed the ISO 834 [1] curve after reaching this temperature.
2. Experimental research methodology
The average compressive strength of the concrete was 28 MPa, with a modulus of elasticity of 22.975 MPa. The height of the tubes, 30 cm, was the same for all of the models.
To describe the studied series, the models were differentiated based on their load (L loaded and N not loaded – two columns with load and one without load were made for each type of tube), the thickness of the tube (6 mm, 8 mm or 6.3 mm) and the duration of exposure to the high temperature (30 min or 60 min). The studied models were grouped into series, as presented in Table 1. During the heating process, axial loads were applied at 50% of the intensity of the normal compression strength for the composite sec-tion at high temperatures. This compression strength was obtained for each model using the program SuperTempcalc (ANDERBERG [2]). The models were loaded before heating with monotonic load -ing, which was maintained until the models reached the set tem-perature. The models were then cooled to room temperature and subjected to static stress tests until failure. This procedure was performed to evaluate the reduction in the columns’ normal com-pression strength after being subjected to a ire.
The cross-sectional temperature distribution in the columns was
Figure 2 – Axial displacement as a function
of exposure duration (KODUR [4])
The oven temperature was monitored using internal rod thermo-couples coupled to a data acquisition system.
After the tests in the oven, the models were cooled and tested with a monotonic load on the 5000-kN press.
4.1 Experimental results and data analysis
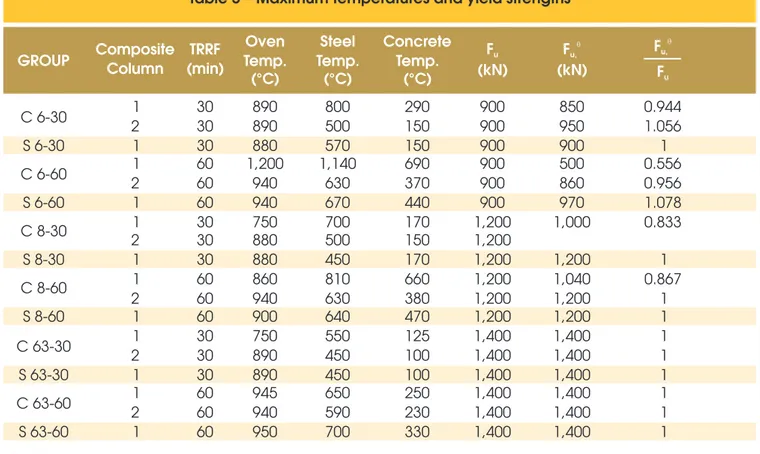
Table 2 presents the stress values that caused the initiation of plastic deformation at room temperature, as obtained by SIMÕES [3], and at high temperatures, as obtained by ARAÚJO [5]. Figure 5 was prepared to better visualize the data. The stress values for plastic deformation were obtained according to the procedure presented by HAN et al. [6].
For the columns tested at 30 and 60 minutes, which were then cooled and tested under a static load, it can be observed that the yield strength was less than that obtained for the same columns left at room temperature. This reduction in strength occurred main-ly for the columns that were loaded during heating. The columns with a 30-minute exposure time that were not loaded during the test were not different in terms of yield strength from those that were not heated.
Table 3 presents the maximum axial yield strength values for the columns at room temperature and the columns that were heated and cooled. Figure 5 was prepared to better visualize the data. Figure 6 shows the Speciic Linear Stress-Strain Diagram of col -ture elevation curves for different cases, as well as the standard ire
curve ISO 834 [1]. A test system was prepared that coupled the oven with the 600-kN press to allow static loads to be applied and maintained while the temperature was varied, as shown in Figure 4.
Figure 4 – High-temperature load
application system
Table 2 – Maximum temperatures and yield strengths
F – Yield strength for the columns at room temperatureesc
q
Fesc, – Yield strength for the columns after cooling
Group
Composite
TRRF
Oven
Temp.
Temp.
Steel
Concrete
Temp.
F
escF
esc,qF
escq
F
esc,Column
(min)
(°C)
(°C)
(°C)
(kN)
(kN)
C 6-30
2
1
30
30
890
890
800
500
290
150
780
780
750
640
0.962
0.821
S 6-30
1
30
880
570
150
780
780
1
C 6-60
2
1
60
60
1,200
940
1,140
630
690
370
780
780
680
500
0.872
0.641
S 6-60
1
60
940
670
440
780
700
0.897
C 8-30
1
30
750
700
170
1,150
950
0.826
2
30
880
500
150
1,150
S 8-30
1
30
880
450
170
1,150
1,150
1
C 8-60
2
1
60
60
860
940
810
630
660
380
1,150
1,150
1,000
1,150
0.870
–
–
–
–
–
–
1
S 8-60
1
60
900
640
470
1,150
C 63-30
2
1
30
30
750
890
550
450
125
100
1,200
1,200
1,000
0.833
S 63-30
1
30
890
450
100
1,200
1,190
0.992
C 63-60
2
1
60
60
945
940
650
590
250
230
1,200
1,200
1,050
880
0.875
0.733
umn 1 in the series C63-60 (C63-60-1) as an example. Although the yield strength diminished for the column subjected to the oven before the static test, the behavior of the column was modiied rela -tive to the column that remained at room temperature, increasing its ultimate strength. The actual yield strength also ceases to be well deined for the heated column. This inding was repeated in all of the tests. A potential cause for this result could be a modiica -tion in the microstructure of the steel, which caused the composite column to behave differently.
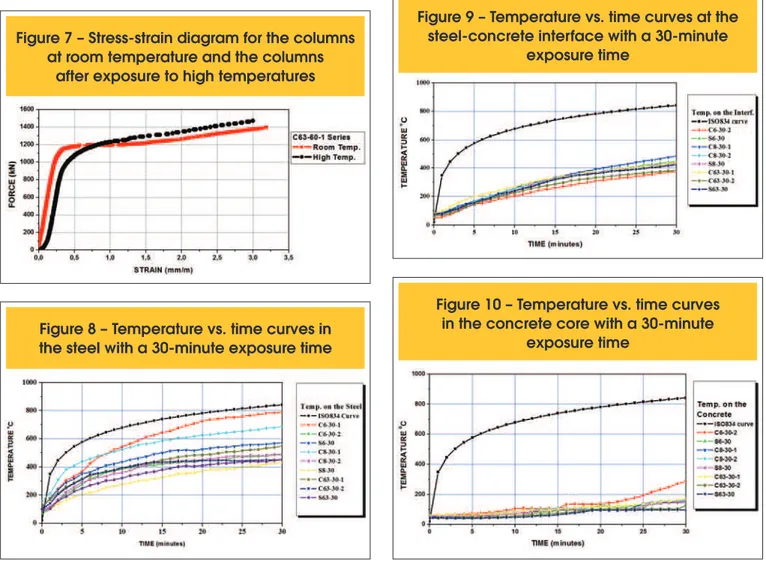
Figures 7 – 9 and 10 – 12 present the temperature increase on the surface of the steel tube, at the steel-concrete inter-face and in the concrete core for the 30- and 60-minute tests, respectively.
Figure 9 shows the behavior of the temperature in the concrete core and suggests that the temperature was lower in the tubes with larger diameters and thicknesses.
Figures 10 – 12 show the graphs for the 60-minute exposure time for the elevation of temperature on the surface of the steel
Figure 5 – Yield Strength: columns at room temperature X columns after exposure to high temperatures
Table 3 – Maximum temperatures and yield strengths
F – Yield strength for the columns at room temperature u
q
Fu.– Yield strength for the columns after cooling
GROUP
Composite
TRRF
Oven
Temp.
Steel
Temp.
Concrete
Temp.
F
uq
F
u,F
uq
F
u,Column
(min)
(°C)
(°C)
(°C)
(kN)
(kN)
C 6-30
2
1
30
30
890
890
800
500
290
150
900
900
950
850
0.944
1.056
S 6-30
1
30
880
570
150
900
900
1
C 6-60
2
1
60
60
1,200
940
1,140
630
690
370
900
900
860
500
0.556
0.956
S 6-60
1
60
940
670
440
900
970
1.078
C 8-30
2
1
30
30
750
880
700
500
170
150
1,200
1,200
1,000
0.833
S 8-30
1
30
880
450
170
1,200
1,200
1
C 8-60
1
60
860
810
660
1,200
1,040
0.867
2
60
940
630
380
1,200
1,200
1
S 8-60
1
60
900
640
470
1,200
1,200
1
C 63-30
2
1
30
30
750
890
550
450
125
100
1,400
1,400
1,400
1,400
1
1
S 63-30
1
30
890
450
100
1,400
1,400
1
C 63-60
2
1
60
60
945
940
650
590
250
230
1,400
1,400
1,400
1,400
1
1
tube, at the steel-concrete interface and in the concrete core. Figures 9 and 12 show the behavior of the temperature in the con -crete core where it is evident that, as expected, the temperature was lower in the tubes with larger diameters and thicknesses. The graph in Figure 13 shows the temperatures of the columns tested in the oven with and without loads at 30 min. and 60 min. The results indicate that at 30 min. the steel tube surface was
ap-proximately 400 to 500ºC, with practically no loss of load bearing capacity for this temperature range. In the case of a 60-minute ex -posure time, however, the columns showed temperatures ranging from 600 to 700ºC. An indication of the inluence of the thickness of the tube wall and the diameter of the tube on the temperature of the concrete core can also be observed.
Figure 6 – Maximum axial stress: columns at room temperatures X columns after exposure
to high temperatures
FORCE kN
TESTS
Figure 7 – Stress-strain diagram for the columns
at room temperature and the columns
after exposure to high temperatures
Figure 9 – Temperature vs. time curves at the
steel-concrete interface with a 30-minute
exposure time
Figure 10 – Temperature vs. time curves
in the concrete core with a 30-minute
It is noted that there was a slight increase in the temperature of the concrete core in the columns without loads inside the oven. This inding is due to the load inhibiting the evaporation of free water in the concrete, thereby slowing the increase in tempera-ture, as the press system prevented evaporation from the ends of the composite columns, even with the presence of lateral holes in the steel tubes that allow for the liberation of vapor. For the larger diameter columns, it was found that the temperature
of the concrete was lower, as observed in column S63-60. This column showed a higher temperature on the surface of the steel tube (Figure 10), although it showed a lower temperature in the concrete core (Figure 12).
It is evident that the thickness of the steel tube influenced the increase in the temperature of the concrete core (Fig-ure 13).
Figures 14 and 15 show the curves for the oven obtained during
Figure 11 – Temperature vs. time curves in
the steel with a 60-minute exposure time
Figure 12 – Temperature vs. time curves
at the steel-concrete interface
with a 60-minute exposure time
Figure 13 – Temperature vs. time curves for
the concrete with a 60-minute exposure time
Figure 14 – Temperatures for the steel,
interface and concrete for
the 30- and 60- minute tests
Figure 15 – Oven temperature curves
for the 30-minute tests
!"#$%&'()&*$ +
the tests, in comparison with the ISO 834 curve for the 30 and 60 min. test times. It is noted that the curves obtained were very simi -lar to the standard ISO 834 curve.
5. Computational results
The SuperTempcalc Program (ANDERBERG [2]) was used to determine the temperature distribution in the cross-section of the columns and to compare the measurements from the physical ex-perimental tests.
The actual temperature elevation curves obtained for the oven dur-ing the experimental tests were used for computational analysis. The thermal conductivity and speciic heat values for the steel and the concrete as a function of temperature were based on the BS EN 1994 standard [7] and [8]. The values adopted for the emissiv -ity and convection factor were 0.7 and 25 W/m2, respectively. The
density of the concrete was 25 kN/m3.
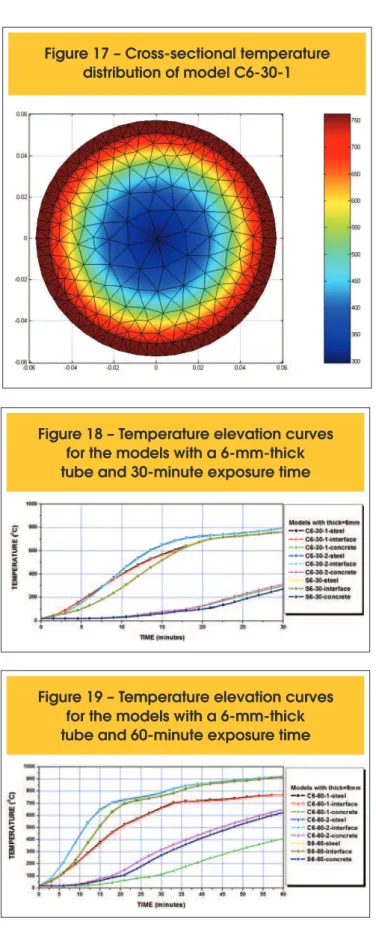
Figure 16 shows the temperature distribution in the cross-section of model C6-30-1 as an example of what was performed for all of the models.
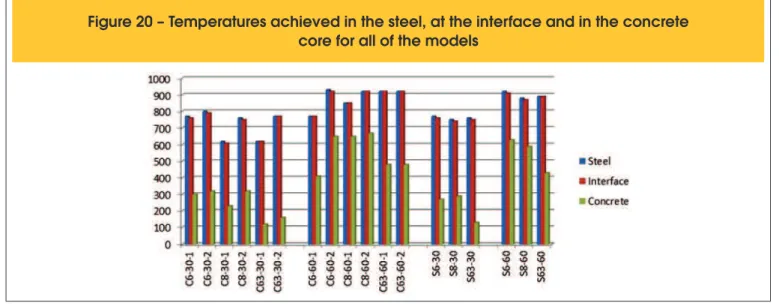
In Figures 17 and 18, the graphs for temperature increases are shown for the models with a 6 mm tube thickness, for 30 and 60 minutes of exposure to the high temperatures, respectively. Figure 19 shows the temperatures achieved on the steel, at the steel-concrete interface and in the concrete core through compu-tational analysis.
The inluence of the thickness of the tube on the inal temperature of the concrete core can also be observed in this graph.
6. Conclusion
The load bearing capacity of the composite columns suffered a small reduction when they were subjected to high temperatures. This effect only occurred for the models that were heated for 60 minutes, for which the temperatures in the concrete core reached 300 to 400ºC. The load bearing capacity for the columns that re -mained in the oven for 30 minutes was very similar to that of the columns that were left at room temperature.
The stress-strain behavior of the composite columns was altered after exposure to high temperatures relative to the same columns at room temperature. This effect was most evident for the 60-min-ute exposure tests, which achieved higher temperatures. When these tests were compared to those conducted at room tempera-ture, the yield strength and proportionality limit were lower for the columns that were subjected to high temperatures compared to those that remained at room temperature; however, the ultimate strength of the former group increased slightly to compensate for these reductions.
With regards to the application of a load to the columns inside of the oven, it can be concluded that the level of applied load did not affect the inal temperatures achieved by the concrete core or its residual load bearing capacity.
In the tests where the diameter of the tube remained constant while the thickness varied, the maximum temperature at the inter-face between the metallic tube and concrete was lower for larger thicknesses. This effect was also observed in the computational analysis for all of the C6 and C8 models, with a diameter of 114.3 mm. Comparing the results of the same cited models revealed that the diameter inluenced the inal temperature of the concrete core. The composite columns with steel tubes of larger diameter (141.3 mm) showed lower yield strengths compared to those with steel tubes of smaller diameter (114.3 mm) but the same thickness. This
Figure 17 – Cross-sectional temperature
distribution of model C6-30-1
Figure 18 – Temperature elevation curves
for the models with a 6-mm-thick
tube and 30-minute exposure time
123456789:6;<65=>4566? 6@ =>2ABC 45@ 6D
EA 5>F6;AG6?DH2>F=IJ;;J>F2CK
pattern occurred for the tests with the 60-minute exposure time. The computational and experimental results were similar regarding the following points in the cross-sectional analysis: the external steel portion of the model and the concrete core. These indings show that the coeficients used by the program and standardized by the BS EN 1994 [7] and [8] were suitable for the theoretical analysis.
The experimental results obtained for the steel-concrete interface and the computational analysis differ somewhat. This divergence could be due to the fact that the experimental measurement was made by placing the thermocouple into the model in a hole created in the metallic tube prior to the curing of the concrete. Thus, the thermocouple was pressed against the concrete.
7. Acknowledgements
The authors would like to thank the São Paulo Research Founda -tion (Fundação de Amparo à Pesquisa do Estado de São Paulo, FAPESP) for the research grant that inanced the experimental portion of this study and the Thematic Project (Projeto Temático) of the same body, which provided conditions for the continuation of the research.
8. References
[01] INTERNATIONAL STANDARDIZATION FOR ORGANIZATION – Fire resistance tests – Elements of building construction. ISO 834. Genève. 1994. [02] ANDERBERG, Y.; TCD 5.0 - User’s Manual. Fire
Safety Design, Lund, 1997.
[03] SIMÕES, R. (2008). Efeito do coninamento em pilares misto curtos de aço e concreto. [Effect of coninement on short composite columns of steel and concrete]. Master’s Dissertation. FEC-UNICAMP. São Paulo.
[04] KODUR, V.K.R. Performance-based ire resistance design of concrete-illed steel columns. Journal of Constructional Steel Research 51 (1999) 21-36. [05] ARAÚJO, C.J.R.V. (2008). Estudo experimental do
efeito do fogo em pilares mistos curtos de aço e concreto. [Experimental study of the effect of ire on composite columns of steel and concrete]. Master’s Dissertation. FEC-UNICAMP. São Paulo.
[06] HAN, L.N. et al. Compressive and lexural behaviour of concrete illed steel tubes after exposure to standard ire. Journal of Constructional Steel Research 61 (2005) 882-901.
[07] EUROPEAN COMMITTEE FOR STANDARDIZATION (CEN). Eurocode 4: Design of composite steel and concrete structures – part 1.2: General rules – Structural ire design. prEN 1994-1-2. CEN: Brussels, 2005.
[08] EUROPEAN COMMITTEE FOR STANDARDIZATION. Eurocode 4: Design of composite steel and concrete structures - part 1-1: General rules and rules for buildings. prEN 1994-1-1 CEN: Brussels, 2001.
![Figure 2 – Axial displacement as a function of exposure duration (KODUR [4])](https://thumb-eu.123doks.com/thumbv2/123dok_br/18859941.417754/3.892.65.435.174.537/figure-axial-displacement-function-exposure-duration-kodur.webp)
![Table 2 presents the stress values that caused the initiation of plastic deformation at room temperature, as obtained by SIMÕES [3], and at high temperatures, as obtained by ARAÚJO [5]](https://thumb-eu.123doks.com/thumbv2/123dok_br/18859941.417754/4.892.64.435.176.494/presents-initiation-deformation-temperature-obtained-simões-temperatures-obtained.webp)