Association between Inflammatory Markers and Cardiovascular Risk
Factors in Women from Kolkata, W.B, India
Debdutta Ganguli
1, Nilanjan Das
1, Indranil Saha
1,4, Krishna Rao Sanapala
2, Debnath Chaudhuri
3, Saurabh Ghosh
2,
Sanjit Dey
1Department of Physiology, University College of Science and Technology, University of Calcutta, West Bengal, India1; Human Genetics Unit, Indian Statistical Institute, Kolkata, India2; Department of Biochemistry and Nutrition, All India Institute of Hygiene and Public Health, West Bengal, India3; Present Address: Department of Community Medicine, RG Kar Medical College and Hospital, Kolkata, India4
Mailing address: Sanjit Dey •
Department of Physiology, University College of Science and Technology, University of Calcutta, 92, APC Road, Kolkata- 700 009, West Bengal - India E-mail: [email protected]
Manuscript received February 11, 2010; revised manuscript received Febru-ary 11, 2010; accepted May 28, 2010.
Abstract
Background: Recent research has focused on the use of inflammatory biomarkers in the prediction of cardiovascular risk. However, information is scant regarding the association between these inflammatory markers with other cardiovascular risk factors in Asian Indians, particularly in women.
Objective: To explore the association between inflammatory markers such as high-sensitivity C-reactive protein (hs-CRP) and white blood cell (WBC) count and cardiovascular risk factors such as overall and central adiposity, blood pressure, lipid and lipoprotein variables and fasting glucose.
Methods: We conducted a cross-sectional analysis on 100 women aged 35 to 80 years. Participants were selected following cluster sampling methodology from 12 different randomly selected urban wards of Kolkata Municipal Corporation.
Results: Hs-CRP has a significant association with body mass index (BMI) (p < 0.001) and waist circumference (WC) (p = 0.002). Significant inverse associations were observed between high-density lipoprotein cholesterol (HDL-C) and both inflammatory markers, hs-CRP (p = 0.031) and WBC count, (p = 0.014). Apolipoprotein A1 (Apo A1) was also negatively associated with hs-CRP. WBC count has significant correlation with fasting glucose and total cholesterol (TC) /HDL-C ratio. Using logistic regression, adjusting for age, BMI (odds ratio/OR, 1.186; confidence interval/CI, 1.046-1.345; p=0.008) and WC (OR, 1.045; CI, 1.005-1.087; p=0.027) were the covariates significantly associated with hs-CRP.
Conclusion: In the present study, risk factors like BMI, WC, and HDL-C and apo A1 show significant association with hs-CRP. WBC count was significantly correlated with HDL-C, fasting glucose, TC/HDL-C ratio in women. (Arq Bras Cardiol 2011; 96(1): 38-46)
Keywords: Inflammation; reactive protein C; risk factors; leukocyte count; adiposity; dyslipidemias; women: India.
cross-sectional studies have already established the fact that hs-CRP and WBC count have been found to significantly correlate with components of metabolic syndrome8-10.
In India, data are scarce regarding the association of these inflammatory biomarkers with other CVD risk factors in adults, particularly among women. Thus the objectives of the present study were to investigate the association between hs-CRP and WBC count with risk factors such as body mass index, waist circumference, waist-hip ratio, blood pressure, lipid and lipoprotein variables and fasting glucose.
Materials and method
Study participants
We randomly selected a population of 100 women aged between 35 and 80 years from an existing epidemiological study on cardiovascular risk assessment involving 701 women residing at urban wards staying for an average 29.8 years in Kolkata. The study was carried out following the WHO prescribed cluster sampling methodology11 from 12
Introduction
different wards out of 141 urban wards of Kolkata Municipal Corporation according to the most recent census data. The wards or clusters were included in the study by simple random sampling without replacement. According to the cluster sampling strategy, in each of the chosen ward or cluster, a location near the center of the ward was taken as the starting point and a random direction was selected. Then the households were chosen randomly along the direction after checking for the compliance with inclusion criteria such as- women aged 35 or above regardless of her marital status, but not pregnant ones. The exclusion criteria were acute illness or any treatment of inflammatory or chronic infectious disease either before or at the time of the investigation. Subjects unwilling to participate in the study were excluded during the survey. Individuals using aspirin as a chronic medication were also excluded. None of the subjects reported taking lipid-lowering medication. Among the eligible subjects, 57 individuals were reported as postmenopausal and the remaining 43 were premenopausal women.
Subjects submitted their written consent to participate in the study prior to the survey, which was approved by the Human Ethical Committee of Department of Human Physiology, University of Calcutta.
Questionnaire
A questionnaire-based interview was used to collect information on smoking habits, use of chewing tobacco, alcohol consumption, personal and family medical history of hypertension, diabetes and myocardial infarction. The participants were interviewed about their menopausal status and history of any surgical intervention, such as hysterectomy. Women were considered pre-menopausal if they had experienced 1 or more regular bleeding episodes in the past 12 months. Women were considered postmenopausal if their menses had ceased naturally or surgically (e.g. hysterectomy) for a period of at least 12 months. The participants were also interviewed about their history of dyslipidemia, current use of anti-hypertensive or hypoglycemic or lipid-lowering drugs and use of postmenopausal hormone therapy. The validity of responses to questions on drug use was confirmed by checking medical records.
Anthropometric and biochemical measurements
Height was measured to the nearest 0.5 cm without shoes using an anthropometer. Weight was recorded in light clothing after removal of shoes to the nearest 0.1 kg. WC was measured using a non-stretch measuring tape at the midpoint between the lowest rib and the iliac crest in the horizontal plane. Maximum hip circumference was measured horizontally at the level of the maximum extension of the buttocks. For each of waist and hip circumference, two measurements to the nearest 0.5 cm were recorded. The mean of the two closest measurements was calculated. Waist-hip ratio (WHR) was calculated by the standard equation: WHR = Waist circumference (cm) / Hip circumference (cm).
Body mass index (BMI) was calculated as weight/height2 (kg/m2). Blood pressure was measured on the right arm of participants in a relaxed, sitting position with the arm supported
at heart level, using a standard mercury sphygmomanometer. Systolic and diastolic blood pressures were recorded as the onset of the first and fifth Korotkoff phases, respectively. For each of the measurement, two readings 5 minutes apart were taken and the mean of the two readings was calculated to obtain the final blood pressure. Participants were advised to avoid cigarette smoking, caffeinated beverages and exercise for at least 30 minutes before the blood pressure measurement.
Participants were requested to fast at least 10 hours before the blood samples were collected on next morning. Venipuncture was performed by a trained physician with the participants in a sitting position. Fasting serum glucose was measured by glucose oxidase-peroxidase method12, serum total cholesterol was determined by cholesterol oxidase-peroxidase-amidopyrine method13 and serum triglycerides (TG) were measured by glycerol phosphate oxidase-peroxidase-amidopyrine method14 using assay kits from Randox Laboratories Ltd (Crumlin, Co. Antrim, United Kingdom) on a spectrophotometer (Bio-rad, Hercules, California, USA). HDL-C was also determined by the same method after precipitation of very low density lipoprotein (VLDL) and low density lipoprotein (LDL) by the polyethylene glycol PEG 6000. LDL- cholesterol (LDL-C) was calculated using the formula: LDL-C = total cholesterol- HDL-C - (TG/5)15. Lipoprotein (a) (Lp(a)), apolipoproteins A1 and B were measured by an automated turbidimetric immunoassay16,17 with reagent kits from Randox Laboratories Ltd on a Randox RX Daytona Autoanalyzer system (Crumlin, Co. Antrim, United Kingdom).
Deinitions and diagnosis criteria
Obesity was defined as BMI greater than 25 kg/m2 18. According to the Seventh Report of the Joint National
Committee (JNC) on Prevention, Detection, Evaluation and Treatment of High Blood Pressure19, subjects were considered
hypertensive if the systolic blood pressure was ≥140 mm of Hg, diastolic blood pressure was ≥ 90 mm of Hg or both or
they were taking anti-hypertensive medication. Diabetes was defined as fasting serum glucose level of 7.0 mmol/l or more
(≥ 126 mg/dl) or on medication for diabetes by the criteria
laid down by the National Cholesterol Education Program (NCEP), Adult Treatment Panel III (ATP III)20. The following cut-off points were used to define dyslipidemias such as (i) Hypercholesterolemia: total cholesterol level of 5.18 mmol/l
or more (≥ 200 mg/dl) (ii) Hypertriglyceridemia: triglyceride level of 1.69 mmol/l or more (≥150 mg/dl) (iii) Low levels of
HDL-C: HDL-cholesterol level less than 1.03 mmol/l (<40 mg/dl) and (iv) High levels of LDL-C: LDL-cholesterol level of
3.36 mmol/l or more (≥ 130 mg/dl) according to the diagnostic
criteria of the NCEP, ATP III guidelines.
Measurement of hs-CRP and WBC count
limit was 0.05 mg/l. WBC counts were done manually with the help of Neubauer’s hemocytometer under the microscope within 24h after venipuncture21. For the sake of uniformity in the counting procedure, the same trained person was deputed during the whole investigative process. The procedure was repeated for at least three times for each of the specimens.
Statistical analysis
All statistical analyses were conducted in parallel for hs-CRP and WBC counts which were divided into respective tertiles based on the distribution in 100 study participants. One-way ANOVA (with Tukey’s pairwise comparisons) was used to compare group means for continuous variables across the tertiles, Wilcoxon’s rank-sum test was used for comparison of medians and the χ2 test was used to compare proportions. Before statistical testing, data were checked for normality. Because the distribution of hs-CRP and Lp(a) were skewed, the variables were natural-log-transformed for all analysis. Pearson’s correlation analysis was carried out to determine the association of inflammatory markers with cardiovascular risk factors. A between-group comparison of pre- and postmenopausal women was performed with analysis of covariance (ANCOVA) after adjustment of other covariates. Serum hs-CRP levels were divided into two categories (below and above) based on the median value of hs-CRP considered as the cut-off point (1.31 mg/l). Logistic unconditioned regression models were used to calculate odds ratios (OR) to evaluate the association between hs-CRP and other variables. All analyses were performed using Windows-based SPSS statistical package (version 10.0, Chicago) and MedCalc statistical software (version 10.1.6) and p-values <0.05 were considered significant.
Results
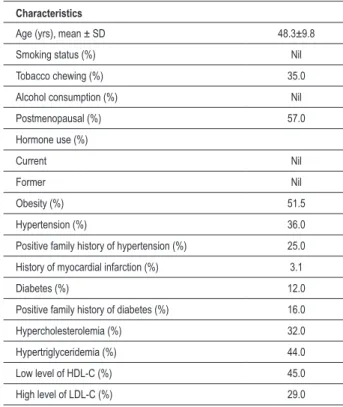
The prevalence of some baseline characteristics is shown in Table 1. The mean age of the study subjects was 48.3±9.8 yrs. A total of 35% of the women chewed tobacco at a regular or weekly frequency. No individual was reported to smoke either cigarettes or beedies or consume alcohol. Prevalence of postmenopausal women in the population was 57.0%, but none of them was found to take any hormone replacement therapy. The overall prevalence of obesity was 51.5% in the study population determined by BMI alone. Prevalence of hypertension and positive family history for hypertension were 36.0% and 25.0%, respectively. Diabetes was observed in 12.0% of women and 16.0% of subjects were reported with positive family history for diabetes. Overall 3.1% women were found with a history of myocardial infarction. Hypercholesterolemia was observed in 32.0% subjects. However, hypertriglyceridemia was observed in 44.0% of subjects and an almost similar percentage (45.0%) was observed for low levels of HDL-C. Furthermore, 29.0% of the women showed high-levels of LDL-C.
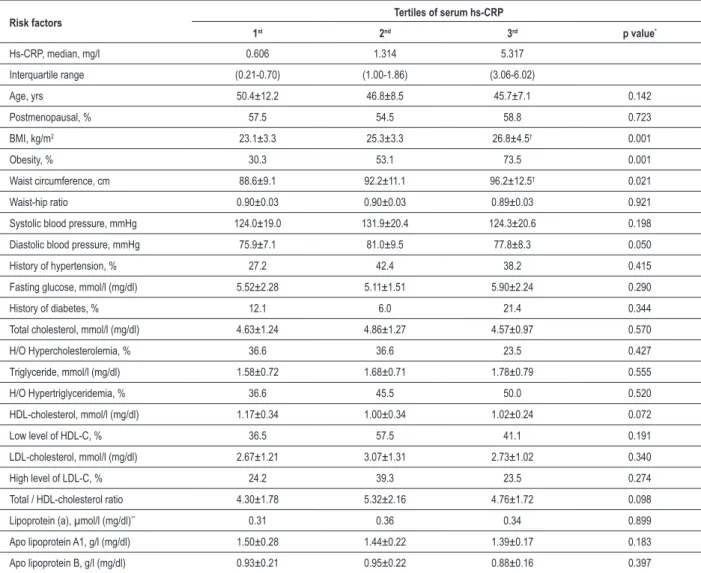
Table 2 shows the relationship between hs-CRP levels and various risk variables among the study subjects. BMI and waist circumference were each significantly higher (p= 0.001 and p= 0.021 for BMI and WC, respectively) across increasing tertiles of serum hs-CRP levels. Women in higher
tertiles of hs-CRP seemed to have a tendency toward higher incidence of diabetes as well as higher triglyceride and lower apolipoprotein A1 levels, although the differences were not statistically significant.
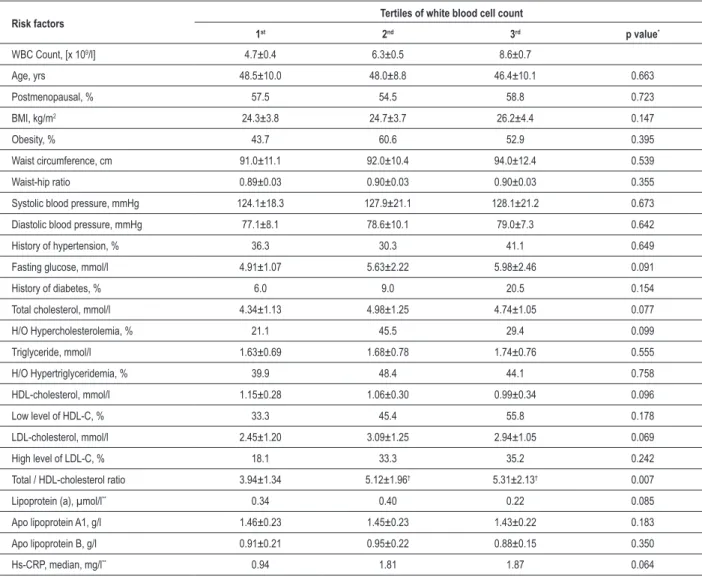
We next examined (Table 3) the relationship between WBC count and other risk variables in the study population. TC/HDL-C ratio increased significantly (p= 0.007) across the WBC count tertiles, whereas other variables such as fasting glucose, triglycerides, HDL-cholesterol, apolipoprotein A1 were non-significantly higher among the higher tertiles. BMI and waist circumference were higher in the higher tertiles of WBC count, but the differences were not statistically significant. Both systolic and diastolic blood pressures were also non-significantly higher among the higher tertiles. Women in higher tertiles have higher incidence of diabetes. The mean value of hs-CRP was higher across the tertiles of WBC count but was not statistically significant.
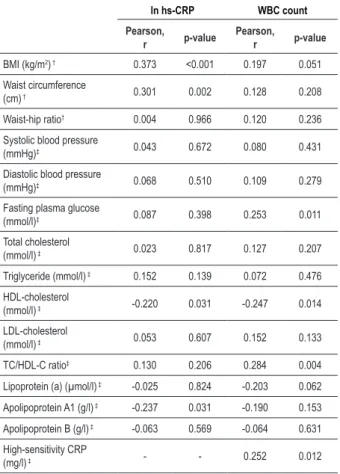
High-sensitivity C-reactive protein (hs-CRP) was significantly associated with measures of obesity such as BMI (r=0.373, p<0.001) and WC (r=0.301, p=0.002) after adjustment for age (Table 4), whereas no significant correlation was found with WHR (r=0.004, p=0.966). However, WBC count was non-significantly associated with BMI, WC and WHR after adjustment for age. Analysis of partial correlation coefficient revealed a significant negative correlation between HDL-C and hs-CRP (r= -0.220, p=0.031) and between HDL-C and WBC count (r= -0.247, p=0.014). Apolipoprotein A1 was also inversely associated (r=-0.237, p=0.031) with hs-CRP in women. Associations with WBC count were significant for biochemical variables such as fasting glucose (r=0.253,
Table 1 - Prevalence (%) of some baseline characteristics in 100 women
Characteristics
Age (yrs), mean ± SD 48.3±9.8
Smoking status (%) Nil
Tobacco chewing (%) 35.0
Alcohol consumption (%) Nil
Postmenopausal (%) 57.0
Hormone use (%)
Current Nil
Former Nil
Obesity (%) 51.5
Hypertension (%) 36.0
Positive family history of hypertension (%) 25.0
History of myocardial infarction (%) 3.1
Diabetes (%) 12.0
Positive family history of diabetes (%) 16.0
Hypercholesterolemia (%) 32.0
Hypertriglyceridemia (%) 44.0
Low level of HDL-C (%) 45.0
Table 2 - Distribution of various risk factors according to tertiles of high-sensitivity C - reactive protein
Risk factors Tertiles of serum hs-CRP
1st 2nd 3rd p value*
Hs-CRP, median, mg/l 0.606 1.314 5.317
Interquartile range (0.21-0.70) (1.00-1.86) (3.06-6.02)
Age, yrs 50.4±12.2 46.8±8.5 45.7±7.1 0.142
Postmenopausal, % 57.5 54.5 58.8 0.723
BMI, kg/m2 23.1±3.3 25.3±3.3 26.8±4.5† 0.001
Obesity, % 30.3 53.1 73.5 0.001
Waist circumference, cm 88.6±9.1 92.2±11.1 96.2±12.5† 0.021
Waist-hip ratio 0.90±0.03 0.90±0.03 0.89±0.03 0.921
Systolic blood pressure, mmHg 124.0±19.0 131.9±20.4 124.3±20.6 0.198
Diastolic blood pressure, mmHg 75.9±7.1 81.0±9.5 77.8±8.3 0.050
History of hypertension, % 27.2 42.4 38.2 0.415
Fasting glucose, mmol/l (mg/dl) 5.52±2.28 5.11±1.51 5.90±2.24 0.290
History of diabetes, % 12.1 6.0 21.4 0.344
Total cholesterol, mmol/l (mg/dl) 4.63±1.24 4.86±1.27 4.57±0.97 0.570
H/O Hypercholesterolemia, % 36.6 36.6 23.5 0.427
Triglyceride, mmol/l (mg/dl) 1.58±0.72 1.68±0.71 1.78±0.79 0.555
H/O Hypertriglyceridemia, % 36.6 45.5 50.0 0.520
HDL-cholesterol, mmol/l (mg/dl) 1.17±0.34 1.00±0.34 1.02±0.24 0.072
Low level of HDL-C, % 36.5 57.5 41.1 0.191
LDL-cholesterol, mmol/l (mg/dl) 2.67±1.21 3.07±1.31 2.73±1.02 0.340
High level of LDL-C, % 24.2 39.3 23.5 0.274
Total / HDL-cholesterol ratio 4.30±1.78 5.32±2.16 4.76±1.72 0.098
Lipoprotein (a), µmol/l (mg/dl)** 0.31 0.36 0.34 0.899
Apo lipoprotein A1, g/l (mg/dl) 1.50±0.28 1.44±0.22 1.39±0.17 0.183
Apo lipoprotein B, g/l (mg/dl) 0.93±0.21 0.95±0.22 0.88±0.16 0.397
All values are expressed as mean±SD except for the categorical and skewed variables. *For normally distributed variables, p-values were computed with one-way ANOVA;
for skewed variables, p- values were computed with Wilcoxon rank-sum test for the difference in medians and for categorical variables p-values were computed with chi-square test. **Values are medians. †Signiicantly different from 1st tertile (p<0.05).
p=0.011), TC/HDL-C ratio (r=0.284, p=0.004) and hs-CRP (r=0.252, p=0.012). As strong associations were observed between hs-CRP and measures of obesity like BMI and WC, we therefore adjusted these variables along with age for calculating partial correlation coefficients between hs-CRP and other variables in all the above models. Associations of WBC count with other variables were computed after adjustment for age.
A comparison of levels of inflammatory markers in premenopausal and menopausal women is shown in Table 5. Both hs-CRP and WBC count did not significantly differ between the premenopausal and postmenopausal group. Adjusted geometric means were 1.68 and 2.66 mg/l respectively for hs-CRP (1.58-fold increase with menopause). Because menopause may be associated with changes in measures of obesity and other biochemical profile, we adjusted the means for variables such as BMI, waist circumference and HDL-cholesterol in addition with age.
Logistic regression analysis was performed on variables that were significantly correlated with hs-CRP (Table 6). BMI (OR, 1.186; CI, 1.046-1.345; p=0.008) and WC (OR, 1.045; CI, 1.005-1.087; p=0.027) were the covariates significantly and positively associated with hs-CRP after adjustment for age. However, no significant independent association was observed between HDL-cholesterol and hs-CRP.
Discussion
There is an emerging consensus that CVD has a multifactorial etiology, including atherosclerotic, prothrombotic and inflammatory components. Therefore, in addition to the assessment of conventional risk factors, new markers have been explored in prospective observational studies with the hope that they might improve the ability to predict the risk of developing cardiovascular events.
Table 3 - Distribution of various risk factors according to tertiles of white blood cell count
Risk factors Tertiles of white blood cell count
1st 2nd 3rd p value*
WBC Count, [x 109/l] 4.7±0.4 6.3±0.5 8.6±0.7
Age, yrs 48.5±10.0 48.0±8.8 46.4±10.1 0.663
Postmenopausal, % 57.5 54.5 58.8 0.723
BMI, kg/m2 24.3±3.8 24.7±3.7 26.2±4.4 0.147
Obesity, % 43.7 60.6 52.9 0.395
Waist circumference, cm 91.0±11.1 92.0±10.4 94.0±12.4 0.539
Waist-hip ratio 0.89±0.03 0.90±0.03 0.90±0.03 0.355
Systolic blood pressure, mmHg 124.1±18.3 127.9±21.1 128.1±21.2 0.673
Diastolic blood pressure, mmHg 77.1±8.1 78.6±10.1 79.0±7.3 0.642
History of hypertension, % 36.3 30.3 41.1 0.649
Fasting glucose, mmol/l 4.91±1.07 5.63±2.22 5.98±2.46 0.091
History of diabetes, % 6.0 9.0 20.5 0.154
Total cholesterol, mmol/l 4.34±1.13 4.98±1.25 4.74±1.05 0.077
H/O Hypercholesterolemia, % 21.1 45.5 29.4 0.099
Triglyceride, mmol/l 1.63±0.69 1.68±0.78 1.74±0.76 0.555
H/O Hypertriglyceridemia, % 39.9 48.4 44.1 0.758
HDL-cholesterol, mmol/l 1.15±0.28 1.06±0.30 0.99±0.34 0.096
Low level of HDL-C, % 33.3 45.4 55.8 0.178
LDL-cholesterol, mmol/l 2.45±1.20 3.09±1.25 2.94±1.05 0.069
High level of LDL-C, % 18.1 33.3 35.2 0.242
Total / HDL-cholesterol ratio 3.94±1.34 5.12±1.96† 5.31±2.13† 0.007
Lipoprotein (a), µmol/l** 0.34 0.40 0.22 0.085
Apo lipoprotein A1, g/l 1.46±0.23 1.45±0.23 1.43±0.22 0.183
Apo lipoprotein B, g/l 0.91±0.21 0.95±0.22 0.88±0.15 0.350
Hs-CRP, median, mg/l** 0.94 1.81 1.87 0.064
All values are expressed as mean±SD except for the categorical and skewed variables. *For normally distributed variables, p-values were computed with one-way ANOVA;
for skewed variables, p- values were computed with Wilcoxon rank-sum test; for the difference in medians and for categorical variables p-values were computed with chi-square test. **Values are medians. †Signiicantly different from 1st tertile (p<0.05).
between hs-CRP levels and adiposity measures such as BMI and waist circumference. These results are consistent with the experimental findings suggesting that adipose tissue is a major source of cytokines, including IL-6, which is an important determinant of hepatic CRP synthesis8,22-24. However, in adults, stronger associations between body fat and CRP values have been reported for women compared with men25. The Third National Health and Nutrition Examination Survey (NHANES III) in United States including both men and women aged
≥20 years, revealed that higher BMI is associated with higher
CRP concentrations, even in younger adults26. A significant association of CRP levels with BMI was also reported among elderly men and women in the Cardiovascular Health Study22 as well as by Mendall et al23. Lemieux et al27 observed that despite the fact that the amount of total body fat (measured as BMI) was the best correlate of CRP levels, the highest plasma CRP concentrations were observed among individuals who had concurrent elevations in visceral adiposity (measured as
waist circumference) and in total body fatness. Additional support for this observation came from the study by Hak et al24 where they reported that CRP was strongly correlated with waist circumference even after BMI adjustment. The relative contributions of intra-abdominal and subcutaneous adipose tissue in the generation of CRP remain unclear. However, in the present study, waist circumference showed significant association with hs-CRP, although the association disappeared after controlling for BMI (data not shown). This phenomenon could be explained by the strong collinearity of waist circumference and BMI in the study subjects.
Table 4 - Correlation coeficients for hs-CRP and white blood cell count with anthropometric and biochemical variables in 100 women
ln hs-CRP WBC count
Pearson, r p-value
Pearson, r p-value
BMI (kg/m2) † 0.373 <0.001 0.197 0.051
Waist circumference
(cm) † 0.301 0.002 0.128 0.208
Waist-hip ratio† 0.004 0.966 0.120 0.236
Systolic blood pressure
(mmHg)‡ 0.043 0.672 0.080 0.431
Diastolic blood pressure
(mmHg)‡ 0.068 0.510 0.109 0.279
Fasting plasma glucose
(mmol/l)‡ 0.087 0.398 0.253 0.011
Total cholesterol
(mmol/l) ‡ 0.023 0.817 0.127 0.207
Triglyceride (mmol/l) ‡ 0.152 0.139 0.072 0.476
HDL-cholesterol
(mmol/l) ‡ -0.220 0.031 -0.247 0.014
LDL-cholesterol
(mmol/l) ‡ 0.053 0.607 0.152 0.133
TC/HDL-C ratio‡ 0.130 0.206 0.284 0.004
Lipoprotein (a) (µmol/l) ‡ -0.025 0.824 -0.203 0.062
Apolipoprotein A1 (g/l) ‡ -0.237 0.031 -0.190 0.153
Apolipoprotein B (g/l) ‡ -0.063 0.569 -0.064 0.631
High-sensitivity CRP
(mg/l) ‡ - - 0.252 0.012
†Partial correlation coeficients controlled for age. ‡Partial correlation coeficients
controlled for age, BMI and waist circumference.
Table 5 - Comparison of inlammatory biomarkers in premenopausal and menopausal women
Premenopausal (n=43) Postmenopausal (n=57)
Mean SE Mean SE
Age, years 39.6 3.37 53.7 8.28
hs-CRP, mg/l*† 1.68 0.88 to
2.47 2.66
2.00 to 3.32
WBC Count [x
109 /l]* 6.43 0.32 6.74 0.27
*Adjusted for age, BMI, Waist circumference and HDL-cholesterol. †Geometric
mean (95% CI) are shown for hs-CRP because its distribution is skewed.
Table 6 - Multiple logistic regression analysis with hs-CRP‡ as the dependent variable and other risk factors as independent variables in 100 women
Adjusted for age Adjusted for age + BMI + WC
β* OR(95%CI)† p-value β* OR(95%CI)† p-value
BMI (kg/m2) 0.171 1.186(1.046, 1.345) 0.008
-Waist circumference (cm) 0.044 1.045(1.005, 1.087) 0.027
-HDL-cholesterol (mmol/l) - -0.023 0.977(0.943, 1.012) 0.202
‡A dichotomous datum high-sensitivity C-reactive protein (hs-CRP ≤ 1.31/hs-CRP > 1.31) was the dependent variable. *β indicates regression coeficient. †OR, odds ratio;
CI, conidence interval. Here, odds ratio or eβ is the increase in odds associated with a unit increase in the independent variable.
healthy individuals with genetically determined isolated low HDL-C levels are more susceptible to low-dose endotoxin challenge in comparison with subjects with normal or high HDL-cholesterol levels. The study revealed a strong inverse association between HDL-C and apo A-1 levels versus
leukocyte response and plasma CRP levels, supporting an anti-inflammatory effect of HDL-C. In our present investigation, the association between plasma CRP level and low-HDL-C values has been shown to persist even after adjustments for BMI and waist circumference, suggesting an independent association between these variables among the individuals.
Recent evidence supports a wide array of antiatherogenic effects by HDL-C, including anti-inflammatory effects30.
In the present investigation, WBC count showed a significant positive correlation with plasma hs-CRP levels and variables such as fasting blood sugar and TC/HDL-C ratio. The ARIC cross-sectional study of young and middle-aged people31 revealed that WBC count was associated with fasting insulin and blood glucose in an analysis not stratified by gender. A recent study in the Asian Indian population reported by Gokulakrishan et al32 has shown that leukocyte count was positively associated with fasting plasma glucose and insulin resistance. It is therefore possible that inflammation and endothelial function are among several common antecedents for both diabetes and coronary heart disease33. Association between plasma CRP concentrations and WBC count have also been consistently reported in many clinical findings2,34.
Inflammation plays a fundamental role in atherothrombosis38. Hs-CRP, a measure of inflammation, is a mediator as well as marker of atherothrombosis. Although a number of other inflammatory markers have been investigated, the ‘hs-CRP’ level has the most stability, assay precision, accuracy and availability. C-reactive protein has gained official recognition as a cardiac test by the Centers for Disease Control and Prevention (CDC) and the American Heart Association (AHA)4. The utility of CRP testing in patients with myocardial infarction, stable or unstable angina has been well established39. Elevated hs-CRP levels in these clinical settings identify patients with higher inflammatory burdens who are at higher risk of future ischemic events. In addition, an elevated CRP level provides additional prognostic value to traditional cardiac risk factors. Therefore, in a high-risk individual, an elevated hs-CRP level should even further alert both the physician and the individual to the need for aggressive risk-lowering strategies.
To the best of our knowledge, the present study is the first to examine the association between systemic inflammatory markers such as hs-CRP and WBC count and other cardiovascular risk factors in a general population-based sample from India and it focuses particularly on women. An additional strength of this study was the quality of sample collection and the precision in the measurement of CRP and other associated biomarkers. However, some issues of our study need to be addressed. This study was conducted in an apparently healthy population with a low or without current exposure to factors like clinically established CVD, such as- myocardial infarction and smoking, respectively. The above factors are strong determinants of CRP levels and therefore the choice of our population facilitates the investigation of confounders associated with CRP. So, additional studies are needed to verify the findings in both epidemiological and clinical settings in this population. Secondly, this study includes the use of a single measurement of inflammatory markers which may not accurately reflect long-term inflammation status. Multiple measurements over time and changes in those measurements may provide a more accurate mechanism for predicting risk in individuals.
Conclusion
Our results indicate that in an apparently healthy population of women with a low burden of smoking and clinically established cardiovascular disease, BMI and waist circumference were associated with levels of systemic biomarkers such as- hs-CRP and WBC count. Because inflammatory mediators are directly involved in atherogenesis, these results suggest an important mechanism through which obesity might affect the risk of cardiovascular disease. We also observed a significant association between inflammatory markers and lipoprotein variables such as HDL-C and apo-A1, which was independent from adiposity measures. These findings add to a growing body of evidence that HDL-C and apo-A1 protect against cardiovascular disease by mechanisms that extend well beyond their involvement in cholesterol transport. The present findings thus reinforce the importance of these inflammatory biomarkers for cardiovascular risk prediction algorithms along with the standard screening tools, particularly in women.
Acknowledgements
This work was supported by the Department of Science and Technology, Government of India, [Grant Number SSD/ WS/059/2004].
Potential Conflict of Interest
No potential conflict of interest relevant to this article was reported.
Sources of Funding
This study was funded by Department of Science and Technology Government of India.
Study Association
This article is part of the thesis of doctoral submitted by Debdutta Ganguli, from University of Calcuta.
References
1. Koenig W, Sund M, Frohlich M, Fischer HG, Lowel H, Doring A, et al. C-Reactive protein, a sensitive marker of inflammation, predicts future risk of coronary heart disease in initially healthy middle-aged men. Results from the MONICA (Monitoring Trends and Determinants in Cardiovascular Disease) Augsburg Cohort Study, 1984 to 1992. Circulation. 1999; 99 (2): 237–42.
2. Madjid M, Awan I, Willerson JT, Casscells SW. Leukocyte count and coronary heart disease : implications for risk assessment. J Am Coll Cardiol. 2004; 44 (10): 1945-56.
3. Yarnell JW, Baker IA, Sweetnam PM, Bainton D, O’Brien JR, Whitehead PJ, et al. Fibrinogen, viscosity, and white blood cell count are major risk factors for ischemic heart disease: The Caerphilly and Speedwell collaborative heart disease studies. Circulation. 1991; 83 (3): 836-44.
4. Pearson TA, Mensah GA, Alexander RW, Anderson JL, Cannon RO 3rd, Criqui M, et al. Markers of inflammation and cardiovascular disease: Application to clinical and public health practice: a statement for healthcare professionals from the Centers for Disease Control and Prevention and the American Heart
Association. Circulation. 2003; 107 (3): 499-511.
5. Ridker PM, Glynn RJ, Hennekens JS. C-reactive protein adds to the predictve value total and HDL cholesterol in determining risk of first myocardial infarction. Circulation. 1998; 97 (20): 2007-11.
6. Ridker PM, Buring JE, Cook NR, Rifai N. C-reactive protein, the metabolic syndrome and risk of incident cardiovascular events: an 8-year follow-up of 14,719 initially healthy American women. Circulation. 2003; 107 (3): 391-7.
7. Brown DW, Giles WH, Croft JB. White blood cell count: an independent predictor of coronary heart disease mortality among national cohort. J Clin Epidemiol. 2001; 54 (3): 316-22.
8. Yudkin JS, Stehouwer CDA, Erneis JJ, Coppack SW. C-reactive protein in healthy subjects: associations with obesity, insulin resistance and endothelial dysfunction: a potential role for cytokines originating from adipose tissue? Arterioscler Thromb Vasc Biol. 1999; 19 (4): 972-8.
et al. Correlations of C-reactive protein levels with anthropometric profile,percentage of body fat and lipids in healthy adolescents and young adults in urban North India. Atherosclerosis. 2003; 168 (2): 305-13.
10. Oliveira AC, Oliveira AM, Adan LF, Oliveira NF, Silva AM, Ladeia AM. C-reactive protein and metabolic syndrome in youth: a strong relationship? Obesity. 2008; 16 (5): 1094-8.
11. Lemeshow S, Stroh G Jr. Sampling techniques for evaluating health parameters in developing countries. Washington DC: National Academy Press; 1988.
12. Barham D, Trinder P. An improved colour reagent for the determination of blood glucose by the oxidase system. Analyst. 1972; 97 (151): 142-5.
13. Trinder P. Determination of glucose in blood using glucose oxidase with an alternative oxygen acceptor. Ann Clin Biochem. 1969; 6: 24-7.
14. Tietz NW. Clinical guide to laboratory tests. 2nd ed. Philadelphia: WB Saunders Company; 1990. p. 554-6.
15. Friedewald WT, Levy RI, Fredrickson DS. Estimation of the concentration of low-density lipoprotein cholesterol in plasma without use of the preparative ultracentrifuge. Clin Chem. 1972; 18 (6): 499-502.
16. Tietz NW. Clinical guide to laboratory tests. Philadelphia: WB Saunders Company; 1995. p. 442-4.
17. Kronenberg F, Lobentanz EM, Konig P, Utermann G, Dieplinger H. Effect of sample storage on the measurement of lipoprotein[a], apolipoproteins B and A-IV, total and high-density lipoprotein cholesterol and triglycerides. J Lipid Res. 1994; 35 (7): 1318-28.
18. World Health Organization. The Asia-Pacific perspective: redefining obesity and its treatment. International diabetes Institute. Geneva; 2000.
19. Chobanian AV, Bakris GL, Black HR, Cushman WC, Green LA, Izzo JL, et al. The seventh report of the Joint National Committee on Prevention, Detection, Evaluation and Treatment of High Blood Pressure: the JNC 7 Report. JAMA. 2003; 289 (19): 2560-72.
20. Executive summary of the Third Report of the National Cholesterol Education Program (NCEP) Expert Panel on detection, evaluation, and treatment of high blood cholesterol in adults (adult treatment panel III). JAMA. 2001; 285 (19): 2486-97.
21. Mukherjee LK. Medical laboratory technology: a procedure manual for routine diagnostic tests. 3rd ed. New Delhi: McGraw Hill Publication; 1990.
22. Tracy RP, Psaty BM, Macy E, Bovill EG, Cushman M, Cornell ES, et al. Lifetime smoking exposure affects the association of C-reactive protein with cardiovascular disease risk factors and subclinical disease in healthy elderly subjects. Arterioscler Thromb Vasc Biol. 1997; 17 (10): 2167-76.
23. Mendall MA, Patel P, Asante M, Ballam L, Morris J, Strachan DP, et al. Relation of serum cytokine concentrations to cardiovascular risk factors and coronary heart disease. Heart. 1997; 78 (3): 273-7.
24. Hak AE, Stehouwer CDA, Blots ML, Polderman KH, Schalkwijk CG, Westendorp ICD, et al. Associations of C-reactive protein with measures of obesity, insulin resistance, and subclinical atherosclerosis in healthy, middle-aged women. Arterioscler Thromb Vasc Biol. 1999; 19 (8): 1986-91.
25. Visser M, Bouter LM, McQuillan GM, Wener MH, Harris TB. Elevated C-reactive protein levels in overweight and obese adults. JAMA. 1999; 282 (22): 2131-5.
26. Ford ES. Body mass index, diabetes and C-reactive protein among US adults. Diabetes Care. 1999; 22 (12): 1071-7.
27. Lemieux I, Pascot A, Prud’homme D, Almeras N, Bogaty P, Nadeau A, et al. Elevated C-reactive protein: another component of the atherothrombotic profile of abdominal obesity. Arterioscler Thromb Vasc Biol. 2001; 21 (6): 961-7.
28. Mendall MA, Patel P, Ballam L, Strachan D, Northfield TC. C-reactive protein and its relation to cardiovascular risk factors: a population based cross sectional study. BMJ. 1996; 312 (7038): 1061-5.
29. Birjmohun RS, Leuven SI, Levels JHM, Veer CV, Kuivenhoven JA, Meijers JCM, et al. High-density lipoprotein attenuates inflammation and coagulation response on endotoxin challenge in humans. Arterioscler Thromb Vasc Biol. 2007; 27 (5): 1153-8.
30. Rye KA, Barter PJ. Antiinflammatory actions of HDL:a new insight. Arterioscler Thromb Vasc Biol. 2008; 28 (11): 1890-1.
31. Nieto FJ, Szklo M, Folsom AR, Rock R, Mercuri M. Leukocyte count correlates in middle-aged adults: the Atherosclerosis Risk in Communities (ARIC) Study. Am J Epidemiol. 1992; 136 (5): 525-37.
32. Gokulakrishnan K, Deepa R, Sampathkumar R, Balasubhramanyam M, Mohan V. Association of leukocyte count and hs-CRP with metabolic abnormalities in subjects with normal glucose tolerance (CURES-64). J Assoc Physicians India. 2009; 57: 27-32.
33. Saito I, Folsom AR, Brancati FL, Duncan BB, Chambless LE, McGovern PG. Nontraditional risk factors for coronary heart disease incidence among persons with diabetes: the Atherosclerosis Risk in Communities (ARIC) Study. Ann Intern Med. 2000; 133 (2): 81-91.
34. Ryu SY, Kim KS, Park J, Kang MG, Han MA. The association between circulating inflammatory markers and metabolic syndrome in Korean rural adults. J Prev Med Public Health. 2008; 41 (6): 413-8.
35. Sites CK, Toth MJ, Cushman M, L’Hommedieu GD, Tchernof A, Tracy RP, et al. Menopause-related differences in inflammation markers and their relationship to body fat distribution and insulin-stimulated glucose disposal. Fertil Steril. 2002; 77 (1): 128-35.
36. Folsom AR, Golden SH, Boland LL, Szklo M. Association of endogenous hormones with C-reactive protein, fibrinogen, and white blood count in post-menopausal women. Eur J Epidemiol. 2005; 20 (12): 1015-22.
37. Pradhan AD, Manson JE, Rossouw JE, Siscovick DS, Mouton CP, Rifai N, et al. Inflammatory biomarkers, hormone replacement therapy, and incident coronary heart disease: prospective analysis from the Women’s Health Initiative Observational Study. JAMA. 2002; 288 (8): 980-7.
38. Libby P, Ridker PM, Maseri A. Inflammation and atherosclerosis. Circulation. 2002; 105 (9): 1135-43.