An Evaluation of the Rastreometro, a New Device for Populational
Screening of High Blood Pressure in Developing Countries
Andreas Forsvall*, Martin Oscarsson*, Lucelia Batista N. Cunha Magalhães**, Catia Palmeira**, Armênio Costa
Guimarães**, Marco Antonio Mota Gomes***, Dag Thelle*
Sahlgrenska Academy at Göteborg University, Gotemburg-Sweden* - Centrocor, Bahia-Brazil** - Faculdades de Ciências Médicas de Alagoas, Alagoas-Brazil*** - Gottemburg, Sweden - Salvador, BA - Maceió, AL - Brazil
objective: To test a simplified blood pressure device called Rastreometro that could be used by the Health Agents.
Methods:The measurements made by the Rastreometro were compared with those by the auscultatory method, and were carried out in 268 patients, by two operators. The influence on the results of confounding variables such as age, gender, BMI,onfounding variables such as age, gender, BMI, arm length, upper arm circunference, skin colour and antihypertensive treatment were taken into consideration, as well as intra and interobserver variation.
results: In the whole group, sensitivity was 95.1%, specificity 63.1%, positive preditive value 62.4% and negative preditiveIn the whole group, sensitivity was 95.1%, specificity 63.1%, positive preditive value 62.4% and negative preditive value 95.3%. Hypertensive treatment significantly affected specificity, 32.7% as compared to 77.8% for the non-treated group. Both operators improved their results over time.
conclusion: This study suggests that the Rastreometro technique, as a screener for hypertension, has a good sensitivity. Con-This study suggests that the Rastreometro technique, as a screener for hypertension, has a good sensitivity. Con-cerning specificity, it is acceptable, provided the patient is not on regular antihypertensive treatment. In this latter situation, it can be improved by a proper standardization of the method to read the systolic pressure by needle oscillations . Furthermore, the use of this technique requires well trained operators.
Key words: Screening for high blood pressure, new devices for hypertension, populacional screening for undeveloping country.
Mailing Address: lucelia batista n. cunha Magalhães •
It is commonly accepted that hypertension is a major risk factor for cardiovascular disease1.
In Brazil the prevalence of hypertension is around 22%, with no significant bias or interaction to gender2. Stroke is the major cause of cardiovascular mortality in 99% of the 5,529 counties3.
The Brazilian Ministry of Health (BMH) in order to reduce cardiovascular morbidity and mortality rate has developed a multi-step plan, which involves many of the largest national health organizations, to address this great and escalating health issue. Since its beginning in 1996 they have managed to reduce the mortality rate by 19.6%4. The objective of the project is to increase cardiovascular disease prevention and detection through basic education, campaigns, organization of the primary care network and the development of new diagnostic devices. This would in turn facilitate the detection and control of important risk factors such as hypertension and diabetes.
Countries with adequate detection and control of hypertension show considerably lower death rates of cardiovascular complications such as cardiac failure, stroke and end-stage renal disease5.
One of the main strategies for this objective is the commitment of the 180,000 Community Health Agents (CHA) with hypertension screening. The CHA is trained to execute
basic health actions under the supervision of a registered nurse, including the conventional measurement of blood pressure. They are stationed all over Brazil, even in areas without medical doctors .
However concerns were raised by the Nursing Federal Council (Coren) regarding the possibility to obtain very well trained agents in the conventional blood pressure measurement technique all over Brazilians counties, in order to have reliable measurements and to delegate to these agents the decision of the primary diagnosis of hypertension.
These facts motivated Dr. Magalhães and Dr. Gomes to develop a more simple way of detection of high blood pressure by a modification of the conventional aneroid sphygmomanometer. This new device was called “Rastreômetro”, the Portuguese name for “screenometer”. Their use is very simple, indeed. No stethoscope is required and interpretation of the systolic pressure is made by visually observing the onset of the needle oscillations. This new screening device, if it worked, would be much more cost effective and easier to implement than screening the population by the auscultatory method.
responsible for the screening with the Rastreometro. Then, if someone is diagnosed as “red”(probable hypertension), the CHA would refer him to the nurse at the Basic Health Unit for further evaluation. However, to be accepted as a screening tool for the primary detection of arterial hypertension the Rastreometro needed to be validated, and its sensitivity and specificity determined, the reason for this study to have been carried out.
Methods
The study performed by two Swedish third-year medical students (MO,AF), with no experience with the Rastreometro other than one day of training (15 patients). Patients were selected at four different clinics. Three in the city of Salvador, capital of the state of Bahia, northeast Brazil (Centrocor, University of Bahia Medical Service (SMURB) and Bahia Diabetes Center (Cedeba) and one in the city of Camaçari (Centrocardio), at 40 km from Salvador. The study comprised 268 patients, of which 5 had to be excluded from the study due to incomplete results. The patients were asked to participate in the study by a nurse, while they were waiting for a doctor’s or nurse’s appointment.
The patients answered a brief questionnaire and had their weight, height, waist circuference, upper arm length and circunference and blood pressure measured. Blood pressure were measured twice with the Rastreometro and twice with the conventional aneroid sphygmomanometer, in a random sequence concerning both the methods and operators. All pressure data were registered using two different protocols, allowing the operators to work independently and unaware of each other’s results.
The patients were weighed (kg) with light clothing, without shoes, on a calibrated wave (Filizola). Height was measured with a rigid meter stick, using the standard technique.
Body Mass Index (BMI) (kg /m²) was calculated and those
individuals with indexes ≥35 were classified as severely obese. Those with BMI ≥30 and <35 were classified as obese and those with BMI ≥25 <30 were classified as overweight. Those with BMI ≥18 <25 were classified as normal while those with
BMI <18 were classified as underweight .
Waist circunference was measured at the umbilicus, using
a conventional soft scale. A waist circunference ≥102 cm for males, and ≥88 cm for women was classified as central
obesity6. Upper arm length was measured from the acromion to the olecranon on the patients’ right arm while the forearm was positioned at a 90° angle. Upper arm circunference of the right arm was measured at one third of the total distance of the upper arm length measured from the olecranon, on an extended arm.
The assessment of the patients began after at least five minutes of resting in the waiting room. The sequence was the following: in a standing position weight, height, waist circumference and upper arm length was measured. In a sitting position the patients were interviewed. The questionnaire contained questions concerning age, history of hypertension and current regular use of blood pressure medication. Skin colour was graded using a scale from 1-5 (white, mixed with predominantly white, mixed, mixed with predominantly
black and black).
Blood pressure was then measured four times, one operator measured twice conventionally and the other twice with the Rastreometro. The operators worked with both methods. Both the patients and the operators were randomly selected to start with either method. The measurements were taken on the patients’ right arm, in a sitting position with the arm supported at heart level. The first two measurements were made with at least 15 seconds interval, followed by at least a 30 second interval before readings were taken using the other method, again with at least 15 seconds between the third and the fourth measurements. Cuffs designed for arm circunferences between 24cm and 32 cm were used both for the conventional and for the Rastreômetro measurements, regardless of the patients’ actual arm cicunference. Both blood pressure sphygmomanometers were calibrated before the study.
The Rastreometro is an adaptation of the conventional sphygmomanometer. It is done by covering its aneroid numerical display by a plastic adhesive with two coloured zones: the red one at the level and above the the mark of 140mmHg, indicative of high blood pressure (140-300mmHg), and a yellow zone below, indicative of normal blood pressure(<140mmHg). This bicolour plastic adhesive will cover completely the aneroid, except for a narrow 30° opening at the first quadrant, just to allow the identification of the line of zero position. The adhesive is positioned using two reference points, the zero position and a black marker corresponding to the 210 mmHg pressure of the aneroid. The cost of the sticker is very low, with an approximated price of less than US$3.00 for 100 adhesives.
The onset of oscillations of the sphygmomanometer needle was taken as an indication of the systolic blood pressure. For each measurement the zone correlating to the onset of aneroid needle oscillations was registered. Final estimate of the Rastreometro measurement was interpreted as high systolic blood pressure if one of the two measurements was in the red zone. All the measurementss with the Rastreometro were done with the same sphygmomanometer (Umedico, CE, 12x35 cm).
Estimates of both systolic and diastolic blood pressure were obtained by the conventional sphygmomanometer, calculating the mean value of the first and second measurements, both with an accuracy of 5 mmHg, and were made with the same equipment. The systolic value corresponded to the first regular sound (Korotkoff phase I), and the diastolic value to its disappearance (Korotkoff phase V). In accordance with international criteria, high blood pressure was considered if
final pressure values were ≥140/90 mmHg7,8
Statistical analysis - The statistical analysis included estimation of means and standard deviation for continuous variables, and percentages for categorical variables.
conventional method. Positive predictive value was calculated by the equation: PPV= Total of positive persons by both methods/Total of positive persons by the “Rastreometro”). Negative predictive value was calculated by the equation: NPV= Total of negative persons by both methods/ Total of negatives by the “Rastreometro”(9)
The results were analysed using EpiInfo version 6.04b.
Results
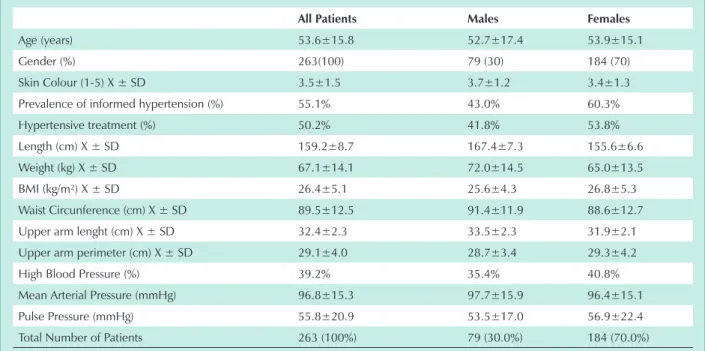
Clinical characteristics of the patients studied are depicted on Table 1. Mean age was 53.6 ±15.8 years, ranging from 9-94 years. Seventy nine (30%) patients were males and 184 (70%) were females.
When asked about a past history of hypertension and whether they were currently taking regular blood pressure medication, 55.1% of the patients claimed they were hypertensive; 60.3% females versus 43.0% males , respectively, and 50.2% that they were currently on drug treatment, 53.8% females and 41.8% males, respectively.
Mean BMI was 26.4 ±5.1 kg/m², making the average
patient overweight (BMI ≥25 kg/m�). This is also valid for≥25 kg/m�). This is also valid for25 kg/m²). This is also valid for both males and females, with mean BMI of 25.6±4.3 and 26.8±5.3, respectively. Females also had a mean waist circumference of 88.6±12.7 cm, slightly above the upper limit of 87.9 cm set by WHO criteria for central obesity. Mean arm circunference was within the limits for the blood pressure
cuffs used (≥24 and <32 cm) for both genders, 29.3�4.2≥24 and <32 cm) for both genders, 29.3�4.224 and <32 cm) for both genders, 29.3±4.2<32 cm) for both genders, 29.3±4.232 cm) for both genders, 29.3±4.2 cm for females and 28.7±3.4 cm for males, respectively. However, 17 patients had an arm circunferencer < 24 cm< 24 cm 24 cm
and 48 persons ≥ 32 cm.≥ 32 cm. 32 cm.
An elevated blood pressure was detected, by the conventional method, in 103 (39.2%) patients, 40.8% of females and 35.4% of males. Of them, 53 (51.5% had isolated
high systolic blood pressure, 44 (42.7%) high systolic and diastolic blood pressure, and 6 (5.8%) isolated high diastolic blood pressure. As expected, isolated high systolic blood pressure predominated among the elderly, while combined and isolated high diastolic blood pressure among the young and middle-aged groups.
In this population, the Rastreometro method showed sensitivity of 95.1%, specificity of 63.1%, Positive Predictive Value of 62.4% and Negative Predictive Value of 95.3%.
Aditional sensitivity analysis was performed in order to assess the influence of some covariates, like arm circunference, and to be or not to be on hypertensive treatment. (tab. 2). Then, arm circunference within the range of length (24-32 cm) of the used cuff (199 patients) was associated with mild elevation of sensitivity to 97.2% , while specificity remained the same, 63.0%. Nevertheless, for the minority of the patients (25%) with arm circunference out of this range, sensitivity dropped for all, but specificity decreased for patients with arm circunference above 32 cm (54.2%) and increased for those with values below 24 cm (80.0%). For those who claimed to be on hypertensive treatment (132 out of 263 patients [50.2%]) sensitivity remained unchanged but specificity droped to 32.7%, even in those with arm circunference within the range of cuff length (35%). For patients not on hypertensive treatment (131 out of 263 [49.8%]), sensitivity also remained unchanged but specificity rose to 77.8%. However, if only patients with arm circunference within the range of cuff length are considered, sensitivity reached 100%, with only mild decrease of specificity (75.9%). None of the other variables in this study showed any statistical significant influence on the accuracy of the Rastreometro measurements.
The study was performed by two operators (observer 1= MO and observer 2= AF) who worked both with the Rastreometro and with conventional method. Neither
All Patients Males Females
Age (years) 53.6±15.8 52.7±17.4 53.9±15.1
Gender (%) 263(100) 79 (30) 184 (70)
Skin Colour (1-5) X ± SD 3.5±1.5 3.7±1.2 3.4±1.3
Prevalence of informed hypertension (%) 55.1% 43.0% 60.3%
Hypertensive treatment (%) 50.2% 41.8% 53.8%
Length (cm) X ± SD 159.2±8.7 167.4±7.3 155.6±6.6
Weight (kg) X ± SD 67.1±14.1 72.0±14.5 65.0±13.5
BMI (kg/m²) X ± SD 26.4±5.1 25.6±4.3 26.8±5.3
Waist Circunference (cm) X ± SD 89.5±12.5 91.4±11.9 88.6±12.7
Upper arm lenght (cm) X ± SD 32.4±2.3 33.5±2.3 31.9±2.1
Upper arm perimeter (cm) X ± SD 29.1±4.0 28.7±3.4 29.3±4.2
High Blood Pressure (%) 39.2% 35.4% 40.8%
Mean Arterial Pressure (mmHg) 96.8±15.3 97.7±15.9 96.4±15.1
Pulse Pressure (mmHg) 55.8±20.9 53.5±17.0 56.9±22.4
Total Number of Patients 263 (100%) 79 (30.0%) 184 (70.0%)
operators had been in contact with the Rastreometro prior to the project, with the exception of one day of training, using 15 patients, randomly selected. Both the patients and the operators were randomly selected to start with either method.
Observer 1 measured blood pressure of 135 (51.3%) patients and observer 2 of 128 (48.7%) patients. Rastreometro sensitivity was 92.2% and 98.1%, and specificity was 73.8% and 51.3%, respectively.
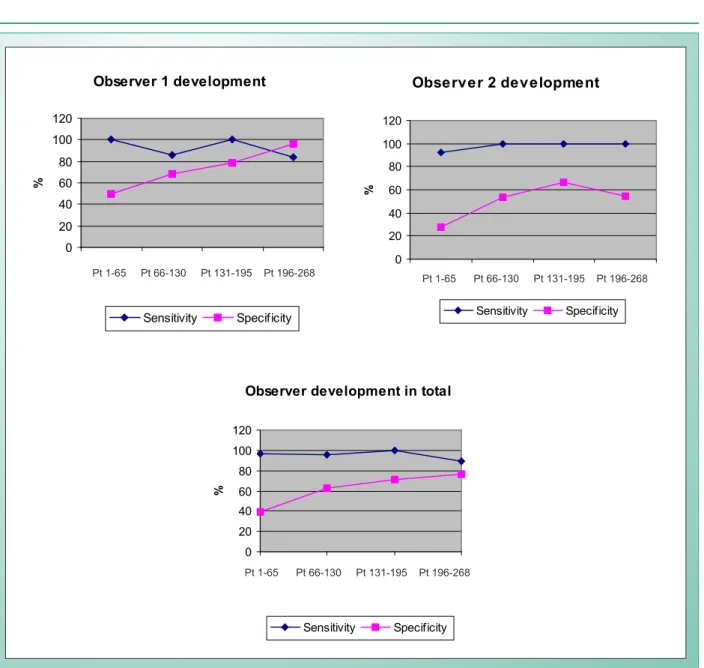
Stratifying the patients in 4 groups according their admission into the study (patients number 1-65, 66-130, 131-195 and 196-268) a learning curve for both observers was detected. While sensitivity for both operators was consistently high, ranging between 88.9-100%, specificity constantly increased from 38.9% in group1 (patients 1-65) to 76.1% in group 4 (patients 196-263). The same kind of development also occurred when individual observer data is compared, with sensitivity somewhat constant over time and the specificity improving (tab. 3).
In the whole patient group (n=263), 103 (39.2%) had an elevated blood pressure. Out of these 103 cases the Rastreometro interpreted five of them (4.9%) as false negatives. Four of them were missed by Observer 1 and one by Observer 2. Three of the five missed patients had an arm perimeter <24<2424 or >32 cm, meaning that the cuff that was used didn’t fit for>32 cm, meaning that the cuff that was used didn’t fit for32 cm, meaning that the cuff that was used didn’t fit for them. Of the remaining two patients, one of them had an isolated elevated diastolic pressure, for which detection the Rastreometro is not primarily designed. Interesting is, however,
that out of the six patients in the study with an isolated elevated diastolic pressure the Rastreometro identified five of them as true positives. So in summary when analysing the patients that the Rastreometro missed, only one result can not be explained by either wrong arm cirunference or an isolated diastolic elevation. If these two parameters are excluded the sensitivity for the remaining patients reaches 98.6% with a specificity of 63%.
Discussion
This study was the second ever made testing the validity of the Rastreometro10. In an attempt to further evaluate the validity of this device, we have taken several parameters into consideration. The problem with subgrouping the material is that in a study like this you end up with several groups with a rather small number of patients. The results should therefore be interpreted as an indication of the potential of the Rastreometro rather than pure evidence, and also as an inspiration for further studies.
The auscultatory method of measuring blood pressure was used as the “gold standard”. The conventional blood pressure was measured twice, with an accuracy of 5 mmHg, using the same two cuffs (one for the conventional method and one for the Rastreometro) for all patients, regardless of their actual arm circunference. With this we eliminated potential differences due to the use of different cuffs, and also made it possible to analyze whether or not the arm circunference influences the results. This is important, because it is not likely that a field working Community Health Agent will have the option to use different types of cuffs for different arm circumferences.
sensitivity specificity
All patients (263) 95.1% (103) 63.1% (160)
Arm
circunference(AC) 24-32 cm (199)
97.2% (72) 63.0% (127)
Arm circunference
<24 cm (17) 85.7% (7) 80.0% (10)
Arm circunference
>32 cm (48) 91.7% (24) 54.2% (24)
On Hypertensive Treatment (OHT) (132)
95.0% (80) 32.7% (52)
OHT and AC 24-32
cm (95) 96.4% (55) 35.0% (40)
Not On Hypertensive Treatment (NOHT) (131)
95.7% (23) 77.8% (108)
NOHT and AC 24-32
cm (104) 100.0% (17) 75.9% (87)
The PPV and NPV for the whole patient group are: Positive Predictive Value (PPV): 62.4%. Negative Predictive Value (NPV): 95.3%.
table 2 - rastreometro measurements of systolic blood pressure. sensitivity and specificity in different subgroups. the total number
of patients for each group is within parenthesis
sensitivity specificity
All Patients (263) 95.1% (103) 63.1% (160)
Total Obs 1 (135) 92.2% (51) 73.8% (84)
Total Obs 2 (128) 98.1% (52) 51.3% (76)
Pt 1-65 96.4% (28) 38.9% (36)
Pt 1-65 Obs 1 (33) 100.0% (15) 50.0% (18)
Pt 1-65 Obs 2 (31) 92.3% (13) 27.8% (18)
Pt 66-130 95.2% (21) 62.8% (43)
Pt 66-130 Obs 1 (35) 85.7% (7) 67.9% (28)
Pt 66-130 Obs 2 (29) 100.0% (14) 53.3% (15)
Pt 131-195 100.0% (27) 71.4% (35)
Pt 131-195 Obs 1 (24) 100.0% (10) 78.6% (14)
Pt 131-195 Obs 2 (38) 100.0% (17) 66.7% (21)
Pt 196-268 88.9% (27) 76.1% (46)
Pt 196-268 Obs 1 (43) 84.2% (19) 95.8% (24)
Pt 196-268 Obs 2 (30) 100.0% (8) 54.5% (22)
table 3 - variation in sensitivity and specificity of the rastreometro, method according the learning curve of the two observers. Patients were divided in four groups by order of admission in the study. observer 1 and observer 2. the total number of patients in each
Taking the results for the entire patient group (n=263), the Rastreometro showed a very high sensitivity (95.1%) and a still high, but significantly lower, specificity (63.1%). Since the Rastreometro is meant to be used as a screening instrument, these values are acceptable. It is much more important to have a very high sensitivity than a very high specificity, meaning that the device will identify almost all hypertensives, although at the cost of interpreting approximately one third of the normal pressures as false positives. For the whole group, the Positive Predictive Value (PPV) was 62.4% and the Negative Predictive Value (NPV) 95.3%. This means that if, for example, 1,000 patients are considered hypertensive with the Rastreometro, the true number of hypertensives will be 624, and if 1,000 patients are considered normotensive, 953 of them truly have a normal blood pressure. In this example, 47 out of 1,000 patients would be missed and 376 out of the 1,000 other patients would be submitted to further testing due to false positive results.
Stratification of the patients according arm circunference, only marginally affected sensitivity and specificity. The largest differences in the subgroups were seen when the medicated group was compared with the non-medicated group. Both groups had a high sensitivity, around 95%, but the medicated group had a significantly lower specificity (32.7%) as compared to the non-medicated group (77.8%). If these data are indeed correct, they strongly indicate that the Rastreometro is primarily intended to be used to screen the population for hypertension rather than in the follow-up of already diagnosed and treated patients.
However, this lower specificity in the medicated group was not confirmed by the pilot study of Mota Gomes et al10, who found a sensitivity of 98.7% and a specificity of 94.7%, what indicates the need of further studies to settle this controversy. The results of our study indicate that normotensive persons and patients under hypertensive treatment with a normal blood pressure give different readings on the Rastreometro, the oscillations of the needle having a tendency to start earlier in the medicated group. This explains why there are so many false positives in this latter group. So, the problem may be due to the interpretation by the observer regarding the intensity of oscillations that should be considered as indicative of the systolic pressure. In the medicated group, altered elastic properties of the arteries, secondary to hypertension, may propitiate the early onset of weak oscillations preceding those more strong ones indicative of the actual systolic pressure. This observer dependent factor, affecting specificity, may also be suggested if the data obtained in the whole group of patients by the two observers are compared. Observer 1 measurements showed a sensitivity of 92.2% and a specificity of 73.8%, while for observer 2 these values were 98.1% and 51.3%, respectively, suggesting a tendency of the second observer to reading weaker oscillations as indicative of the actual systolic pressure leading to a higher sensitivity and lower specificity. Further evidence in this regard is suggested by the learning curve of both observers. While sensitivity values were consistently highs, since the beginning, ranging between 89-100%, specificity values rose from 38.9%, at the very beginning (patients 1-65), to 76.1% at the end of the study
(patients 166-263), Fig 1. This means that both operators by themselves changed their interpretation regarding the amplitude of the initial oscillations that should be taken as related to the actual systolic pressure, leading to a higher specificity, without affecting the sensitivity too much.
Thus, the early oscillations that should be taken as indicative of actual systolic blood pressure is a key point to be considered in further studies, in order to improve the accuracy and reproducibility of the method as far as specificity is concerned.
This also calls for a well trained health agents.
The Rastreometro was designed to interpret the onset of oscillations, being only possible to determine the systolic blood pressure. In spite of most of the hypertensives have isolated systolic or combined systolic and diastolic elevation, a small number of patients, usually younger individuals , have isolated diastolic hypertension, with then a high probability to be missed by the Rastreometro.
However, a matter of interest is that five out of the six patients with isolated diastolic hypertension, in this study, were picked up as hypertensives by the Rastreometro. Nevertheless, in spite of this finding, they should be considered as false positives. Indeed, the fact that the Rastreometro can not screen people with isolated diastolic hypertension, is a disadvantage in its future use as a screener method for arterial hypertension.
Limitations of the study - The main limitation of the study was the absence of a well planned training period, having the plateau of the learning curve as its end-point before to consider the operators in conditions of beginning the screening. This is important in order to establish the stability of the Rastreometro accuracy over time.
Another point was the absence of definitive criteria for the early needle oscillations characteristics that should be taken as indicative of the systolic blood pressure. This certainly may improve the specificity of the method.
The third point is that the results represent a study conducted by medical students and not by health agents. So, the accuracy values obtained cannot be taken as the same if the operators were health agents. Ten, this needs further confirmation and it is fundamental to settle this technique as a based-population screener method for arterial hypertension.
Conclusions
This study tends to confirm the Rastreometro as a potential screener method for the detection of arterial hypertension to be used by health agents, showing a very high sensitivity and an acceptable specificity, when used by two medical students under controlled conditions. However, in patiens on anti-hypertensive drugs the specificity tended to be lower than in non treated patients, but further studies may improve this deficiency if standardization of the early oscillations to be read as indicative of elevated systolic blood pressure is provided.
References
1. Mulrow PJ Hypertension A worldwidw Epidemic in Hypertension Primer second edition American Heart Association 1999 chapter 98 pags271-273. Ed.David Charles Retford. Dallas- Taxas.
2. Barreto ML. Carmo EH. Situação de saúde da população brasileira: Tendências históricas, determinantes e implicações para as políticas de saúde. Informe Epidemiológico do SUS.1994;3:7-34.
3. Magalhães LBNC. Coordenação do grupo de trabalho da hipertensão arterial: A importância do problema Capítulo IV Diretrizes Brasileiras de Hipertensão Arterial. Sociedade Brasileira de Hipertensão Sociedade Brasileira de Cardiologia e Sociedade Brasileira de Nefrologia. Hipertensão 2002;6:1-2.
4. Souza MFM. Timerman A. Serrano CA et al. Tendência do risco de morte pôr doenças circulatórias nas cinco regiões do Brasil de 1979 a 1996.Arq Bras Cardiol.2001;77:562-568.
5. Chockalingam A. Balaguer-Vintró I. Impending global pandemic of cardiovascular disease. Challenges and opportunities for a prevention and control of cardiovascular disease in developing countries and economies in transition World Heart Federation- Introduction-White Book.1999; 11-50.
6. Grundy SM. Brewer HB. Cleeman JI. Et al. Definition of Metabolic Syndrome Report of the National Heart, Lung, and Blood Institute / American Heart Association Conference on Scientific Issues Related to Definition. Circulation. 2004;109:433-438
health agents, and technical improvements in the equipment in order to settle its usefulness as a based-population screener for hypertension, very helpful for developing countries.
Sensibilidade Especiicidade
Fig. 1 - Variation in sensitivity and specificity of the Rastreometro method according the Learning curve of the two observers. Patients were divided in four groups by order of admission in the study.
Observer 1 development
0 20 40 60 80 100 120
Pt 1-65 Pt 66-130 Pt
131-195
Pt 196-268
%
Sensitivity Specificity
Observer 2 development
0 20 40 60 80 100 120
Pt 1-65 Pt 66-130 Pt 131-195 Pt 196-268
%
Sensitivity Specificity
Observer development in total
0 20 40 60 80 100 120
Pt 1-65 Pt 66-130 Pt 131-195 Pt 196-268
%
Sensitivity Specificity
Potencial conflict of interest
No potential conflict of interest relevant to this article was reported.
Pt 1-65 Pt 66-130 Pt 131-195 Pt 196-268
Pt 1-65 Pt 66-130 Pt 131-195 Pt 196-268
7. Hansson L, Hedner T, Himmelmann A. The 1999 WHO-ISH Guidelines for the Management of Hypertension – new targets, new treatment and a comprehensive approach to total cardiovascular risk reduction. Blood Press 1999. (Suppl) 1:3-5.
8. Chalmers J, MacMahon S, Mancia G et al. World Health Organization-International Society of Hypertension Guidelines for the Manegemente of Hypertension Jpurnal of Hypertens. 1999;17:151-183.
9. Kleinbaum DG. Kupper LL. Morgenstern A. Epidemiologic Research. Nova
York: Van Nostrand Reinhold Company.1982.