Waist Circumference and Body Mass Index as Predictors of
Hypertension
Maria do Rosário Gondim Peixoto, Maria Helena D’Aquino Benício, Maria do Rosário Dias de Oliveira Latorre, Paulo
César Brandão Veiga Jardim
Hypertension League - Goiânia, GO - Brazil
Mailing Address: Maria do rosário gondim Peixoto •
objective: To evaluate the association between anthropometric indexes – body mass index (BMI) and waist circumference (WC) – and hypertension, and to evaluate the predictive value of these indexes in detecting hypertension.
Methods: Cross-sectional population study conducted in the city of Goiânia (GO) with a sample of 1,238 adults aged twenty
to 64 years, in 2001. Total obesity was defined as BMI ≥ 30 kg/m2; abdominal obesity was defined as level 2 WC ≥ 88 cm
for women and ≥ 102 cm for men, and hypertension was defined as systolic pressure ≥ 140 mmHg, or diastolic pressure ≥ 90 mmHg, or utilization of hypotensive drugs). Multiple logistic regression analysis was used to evaluate the associations
between anthropometric indexes and hypertension. The Receiver Operating Characteristic (ROC) curve analysis was used to
evaluate sensitivity and specificity of BMI (≥ 30) and level 2 WC as predictive factors of hypertension, and to determine the
best predictive cut-off points for hypertension.
results: WC was associated with hypertension in both genders. Level 2 WC and BMI ≥30 kg/m2 showed a low sensitivity in
identifying hypertension. The best predictive cut-off points for hypertension coincided with level 1 WC (≥ 80 cm) and with BMI ≥25 kg/m2 (overweight) for women, and were lower than the values of level 1 WC and of overweight for men.
conclusion: Level 2 WC and BMI ≥ 30 kg/m2 are not adequate to identify the groups at the highest risk of hypertension, since
this risk rises with small increases in adiposity.
Key words: Waist circumference, body mass index, hypertension, prediction.
Obesity is defined as an excess body fat resulting from a
chronic imbalance between food intake and energy expenditure1.
Among the harmful effects of obesity we can point out the fact that it is an independent risk factor for the development of cardiovascular diseases and some types of cancer. Obesity is also strongly associated with other cardiovascular risk factors (hypertension, diabetes, and dyslipidemias), thus increasing
cardiovascular morbidity and mortality1-4.
For the diagnosis of obesity, there are several indirect methods able to precisely estimate the total amount of body fat as well as its distribution. Among these methods we can point out computed tomography, dual-energy X-ray absorptiometry (DEXA), and magnetic resonance imaging. However, when simplicity and costs of the several methods are considered, the use of anthropometric indexes – body mass index (BMI), waist-hip ratio (WHR), or only waist circumference (WC)
and skinfolds (SF)4 – has been recommended to conduct
epidemiological studies.
Although BMI does not measure body composition, it is a potentially good indicator of the nutritional status in epidemiological studies. Its utilization is based on results of population studies showing that BMI is weakly correlated with height and strongly correlated with total fat mass, and on the association between high BMI and morbidity and mortality of
cardiovascular diseases, diabetes mellitus, colon cancer, and biliary diseases1,4,5,6.
However, the relation between BMI and risk of morbidities may be affected by body fat distribution since the main complications of obesity, which include cardiovascular diseases, diabetes mellitus, hypertension and hyperlipidemia, are associated with a higher accumulation of abdominal fat,
regardless of body weight7,8.
The comparison of anthropometric measurements with diagnostic imaging tests such as magnetic resonance and computed tomography shows that waist circumference was the anthropometric variable that had the best correlation with
visceral adipose tissue9. Thus, a more sensitive measurement
to assess abdominal fat may be more useful than BMI in identifying risk factors associated with obesity.
The cut-off points currently used to classify WC were
defined by Lean et al10 in a cross-sectional study with a sample
of 904 men and 1,014 women between 25 and 74 years of age, in the population of North Glasgow. WC cut-off points
associated with BMI 25 kg/m2 and 30 kg/m2 and/or with WHR
≥ 0.95 for men and ≥ 0.80 for women were identified. To 0.95 for men and ≥ 0.80 for women were identified. To≥ 0.80 for women were identified. To 0.80 for women were identified. To facilitate their use both in the clinical practice and in health promotion programs these cut-off points were described as
WC ≥ 94 cm for men), the individual has a higher risk of≥ 94 cm for men), the individual has a higher risk of 94 cm for men), the individual has a higher risk of morbidities associated with obesity and should be advised to stop gaining weight and to adopt a healthy lifestyle; at level
2 (≥ 88 for women and ≥ 102 for men), the individual has≥ 88 for women and ≥ 102 for men), the individual has 88 for women and ≥ 102 for men), the individual has≥ 102 for men), the individual has 102 for men), the individual has a very increased risk of morbidities associated with obesity and should seek urgent help from a health professional to lose weight and be assessed for other risk factors.
However, the universal use of these cut-off points is questioned, since their sensitivity in identifying risk factors associated with obesity may vary among the different
populations and age groups11-14.
The possibility of use of a measurement that is simple, inexpensive, easy to interpret, and mainly, that can be performed by individuals themselves as a form of screening in health promotion and cardiovascular risk-factor prevention programs,
encouraged thecarrying out of this study, whose purposes were
to asses the association between the anthropometric indexes – BMI and WC – and hypertension, their general predictive ability, the performance of the cut-off points recommended, and the best predictive cut-off points of these anthropometric indexes for the identification of the risk of hypertension in the adult population of the city of Goiânia.
Methods
Study design - This study was developed using data from the Estudo da Prevalência e do Conhecimento da Hipertensão
Arterial e alguns Fatores de Risco em uma Região do Brasil
(Study of the Prevalence and Knowledge of Hypertension and some Risk Factors in a Brazilian Region), a project approved
and financed by Conselho Nacional de Desenvolvimento
Científico e Tecnológico – CNPq (National Council for Scientific
and Technological Development – CNPq). This is a
cross-sectional population study conducted in the capitals and in two cities in the interior of the States of Goiás and Mato Grosso. In the present study only the data collected from June, 2001 to December, 2001 regarding Goiânia were analyzed.
The sample size for the city of Goiânia was calculated
considering a population of 1,004,098 inhabitants15, the
prevalence of hypertension in Brazil (20% of the adult
population)16, a 95% confidence interval and an estimation
error of 10%. Thirty per cent were added to the sample obtained (n = 1,534) to compensate the losses (n = 1,994). The sample effectively studied consisted of 1,454 individuals older than eighteen years of age, of both genders, not institutionalized and residing in the urban area (72.9% of the total sample and 95% of the required sample).
The households were selected by clusters in two phases using probabilistic sampling. The first phase consisted of the
identification, in the IBGE(Instituto Brasileiro de Geografia e
Estatística – Brazilian Institute of Geography and Statistics), of the census sectors used in the 1998 National Household
Sampling Survey (Pesquisa Nacional por Amostragem de
Domicílios – PNAD) in the urban zone of the city of Goiânia. The second phase consisted of the selection of households. For this selection, the number of households in each sector and the total size of the sample were considered. Based on the calculation of the sample size by sector, the households of each sector were randomly and systematically raffled out.
In the households selected only one resident chosen by lot among the residents over eighteen years of age was interviewed to avoid problems of information interdependence between interviewees. Pregnant women and mothers of children under six months of age were excluded from the lot drawing to avoid errors in data interpretation. Hospitalized residents were also excluded.
In the original study, the sample from twenty to 64 years of age corresponded to 1,252 individuals, 433 men and 819 women. Of these, two men were excluded (the WC measurement of one of them was missing, and the other had a biologically implausible WC); thirteen women were also excluded (blood pressure measurement was missing for nine of them, and blood pressure and WC measurements were missing for four of them). Thus, the final sample of this study consisted of 1,237 individuals.
Data collection was performed by trained interviewers who filled out a standardized questionnaire including questions on social and demographic conditions, diet, physical activities, alcohol consumption, smoking, and use of hypotensive drugs, in addition to blood pressure, weight, height, and WC measurements. The interview was conducted after individuals had signed the written consent whose protocol was approved by the Ethics Committee on Human and Animal Medical Research of Hospital das Clínicas da Universidade Federal de Goiás.
Study variables - The anthropometric measurements wereThe anthropometric measurements were
taken according to Lohman et al17 recommendations. The
individuals were weighed and measured barefoot and in light clothing, with a Plenna® electronic scale, model Giant Lithium, with a 150-kg capacity and 100-g precision, and a portable stadiometer (Seca®), with a 0.1-cm precision.
BMI was calculated by dividing weight (kg) by square
height (m). BMI values were classified in: < 18.5 kg/m2
(low weight); 18.5 to 24.9 kg/m2 (normal); 25 to 29.9 kg/m2
(overweight); and ≥ 30 kg/m≥ 30 kg/m 30 kg/m2 (obesity, named total obesity
in the present article)4.
WC measurement was taken using a non-extensible tape measure at the natural waist level, average point between the anterior superior iliac crest and the last rib, with a 0.1-cm precision. The accumulation of fat around the waist, or abdominal obesity, was classified in two levels. Level 1 corresponded to WC values between 80.0 and 87.9 cm for women, and between 94.0 and 101.9 cm for men; level 2
corresponded to a WC≥ 88.0 cm and ≥ 102.0 cm for women≥ 88.0 cm and ≥ 102.0 cm for women 88.0 cm and ≥ 102.0 cm for women≥ 102.0 cm for women 102.0 cm for women and men, respectively. Values below 80.0 cm for women and
94.0 cm for men were classified as adequate4.
For blood pressure measurement (BP) a semi-automatic monitor was used (OMRON – HEM 705 CP). This monitor was chosen because it minimizes the influence of the interviewer on blood pressure reading, and because it has already been
validated18, and also its data are comparable to those obtained
with a mercury column (reference standard). Blood pressure was measured twice, at a minimum interval of 5 minutes. The measurement was taken on the left arm following the recommendations proposed by the National Program of Hypertension Control. For analysis purposes, the second measurement was considered. Individuals were considered
140 mmHg and/or the diastolic blood pressure (DBP) was ≥
90 mmHg, or when they were taking hypotensive drugs19.
Control variables used were gender, age (in full years: 20-24; 25-34; 35-44; 45-54; 55-64), parity (total number of children of each woman interviewed), educational level (years
of schooling: 0-3 years, 4-8 years, and ≥ 9 years); per capita
monthly family income (expressed in quartiles); smoking (smoker, former smoker, and never smoked); consumption of alcoholic beverages in the past week (categorized according
to daily intake of ethanol in grams: < 30 g or ≥ 30 g for≥ 30 g for 30 g for
men, and < 15 g or ≥ 15 g for women), and performance of≥ 15 g for women), and performance of 15 g for women), and performance of physical activities during leisure time.
Physical activity during free or leisure time was classified in four categories of level of effort: (1) sedentary – no physical activity, only activities such as reading and watching television; (2) light – occasional physical activities, such as walking, bicycle riding, and performing light exercises; (3) moderate – regular physical activity (running, gymnastics, swimming, team games); (4) intense – heavy training several times a week or regular participation in sports competitions. Because of the small number of individuals in the latter category, the third and fourth categories were grouped together.
Statistical analysis - After revision of the questionnaires, data were double-keyed for quality assessment of data keying. For
the analysis, STATA (version 7.0)20 was used.
The analyses were performed separately for men and women. Means and 95% confidence intervals of the variables
studied were presented.A trend test was performed to assess
the prevalence of hypertension in BMI and WC categories. BMI and WC were tested separately in logistic regression models adjusted for age, educational level, income, smoking, parity (in women), alcohol consumption, and physical activities during leisure time. Because of the high colinearity between BMI and WC these measurements were not considered as independent variables in the same regression model having hypertension as the endpoint.
Receiver Operating Characteristic (ROC) Curve analyses were used to assess and compare the ability of identifying hypertension using the anthropometric indexes BMI and WC. The areas under the ROC curve provide the global probability of these indexes to correctly classify the presence or the absence of hypertension. An optimal test has an area
under the ROC curve equal to 1.0 whereas an area equal to 0.5 means that the test performance is not better than what
is achieved at random21.
The sensitivity and specificity of level 2 WC (≥ 88 cm and ≥102 cm for women and men, respectively) and of BMI ≥ 30 kg/m2in identifying hypertension were calculated.
Sensitivity was defined as the proportion of hypertensive individuals correctly identified, and specificity was defined as the proportion of normotensive individuals correctly identified. The best predictive WC and BMI cut-off points for hypertension – the point where sensitivity and specificity
curves meet22, were also identified.
The statistical analyses were corrected by complex sample design using STATA’s SVY commands, which consider the complex structure of the sample using the weights associated to each sample cluster and the effect of the sample design. In all tests a 5% significance level was used.
Results
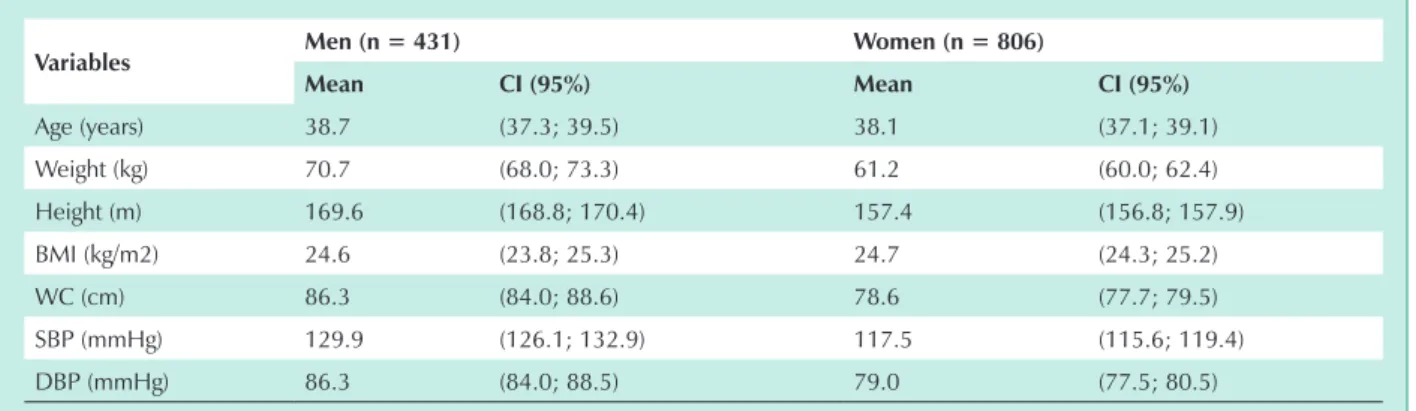
Characteristics of the population studied are shown in Table 1. Mean weight, height, WC, SBP, and DBP were higher in men than in women; mean age and BMI were similar.
The prevalence of total obesity (BMI ≥ 30 kg/m2) and
abdominal obesity (level II WC) were 10.6% and 9.3% for men, and 13.7% and 19.6% for women, respectively.
There was a significant increase in the prevalence of hypertension with the increase in WC for the total of males. However, for females regardless of age bracket, the prevalence of hypertension increased both with the increase in BMI, and with the increase in WC (Tab. 2).
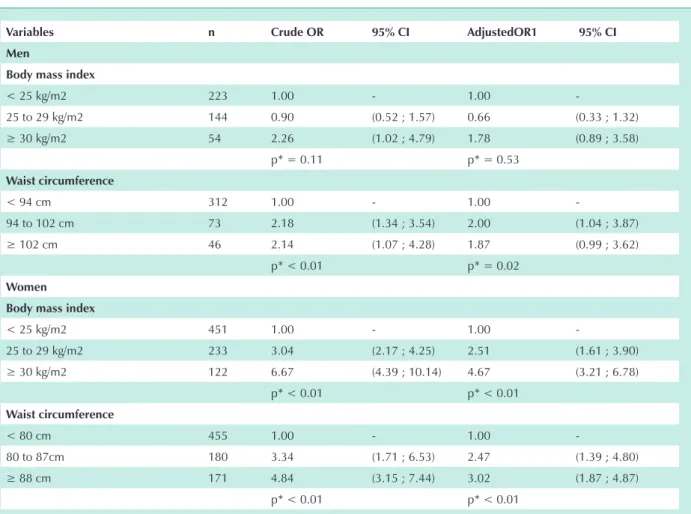
The multiple logistic regression analysis showed that the odds ratio for hypertension was approximately twice as high
for men with high values of WC (≥ 94 cm and ≥ 102 cm),≥ 94 cm and ≥ 102 cm), 94 cm and ≥ 102 cm),≥ 102 cm), 102 cm), when compared to the reference category (< 94 cm). High BMI was not associated with hypertension when adjusted by control variables. However, the magnitude of the association
for a BMI ≥ 30 kg/m≥ 30 kg/m 30 kg/m2 was close to the values observed for level
1 and level 2 WC. For women, high values of BMI and WC were associated with hypertension in the adjusted models, and
women with a WC ≥88 cm had an approximately three-fold≥88 cm had an approximately three-fold88 cm had an approximately three-fold
increase in odds ratio, and those with a BMI ≥30 kg/m≥30 kg/m30 kg/m2 had a
4.7-fold increase in comparison with the reference categories
variables Men (n = 431) Women (n = 806)
Mean ci (95%) Mean ci (95%)
Age (years) 38.7 (37.3; 39.5) 38.1 (37.1; 39.1)
Weight (kg) 70.7 (68.0; 73.3) 61.2 (60.0; 62.4)
Height (m) 169.6 (168.8; 170.4) 157.4 (156.8; 157.9)
BMI (kg/m2) 24.6 (23.8; 25.3) 24.7 (24.3; 25.2)
WC (cm) 86.3 (84.0; 88.6) 78.6 (77.7; 79.5)
SBP (mmHg) 129.9 (126.1; 132.9) 117.5 (115.6; 119.4)
DBP (mmHg) 86.3 (84.0; 88.5) 79.0 (77.5; 80.5)
Hypertension (%)
variables
Men Women
total (n = 431)
Age bracket Age bracket
20-39 (n = 239)
40-64 (n = 192)
total (n = 806)
20-39 (n = 444)
40-64 (n = 362)
bMi
< 25 38.4 34.6 46.1 17.4 11.5 30.2
25 – 29,9 35.9 35.7 36.0 39.0 19.4 56.2
≥ 30 58.5 54.0 61.9 58.4 44.7 66.1
p* = 0.06 p* = 0.50 p*=0.39 p* < 0.01 p* < 0.01 p* < 0.01
Wc
Adequate 34.8 33.0 38.0 17.3 11.3 32.3
Level 1 53.8 53.3 54.2 41.2 21.7 56.0
Level 2 54.2 59.2 51.9 50.3 37.2 57.5
p* < 0.01 p* = 0.07 p*= 0.12 p* < 0.01 p* < 0.01 p* < 0.01
Total 39.7 36.2 44.3 29.4 16.2 47.3
* p-value for the trend test.
table 2 - Prevalence (%) of hypertension according to bMi and Wc classification in men and women by age bracket. goiânia, brazil, 2001
variables n crude or 95% ci Adjustedor1 95% ci
Men
body mass index
< 25 kg/m2 223 1.00 - 1.00
-25 to 29 kg/m2 144 0.90 (0.52 ; 1.57) 0.66 (0.33 ; 1.32)
≥ 30 kg/m2 54 2.26 (1.02 ; 4.79) 1.78 (0.89 ; 3.58)
p* = 0.11 p* = 0.53
Waist circumference
< 94 cm 312 1.00 - 1.00
-94 to 102 cm 73 2.18 (1.34 ; 3.54) 2.00 (1.04 ; 3.87)
≥ 102 cm 46 2.14 (1.07 ; 4.28) 1.87 (0.99 ; 3.62)
p* < 0.01 p* = 0.02
Women
body mass index
< 25 kg/m2 451 1.00 - 1.00
-25 to 29 kg/m2 233 3.04 (2.17 ; 4.25) 2.51 (1.61 ; 3.90)
≥ 30 kg/m2 122 6.67 (4.39 ; 10.14) 4.67 (3.21 ; 6.78)
p* < 0.01 p* < 0.01
Waist circumference
< 80 cm 455 1.00 - 1.00
-80 to 87cm 180 3.34 (1.71 ; 6.53) 2.47 (1.39 ; 4.80)
≥ 88 cm 171 4.84 (3.15 ; 7.44) 3.02 (1.87 ; 4.87)
p* < 0.01 p* < 0.01
1Adjusted by age, educational level, income, smoking, alcohol consumption, physical activity during leisure time, and parity (females),*p of trend.
(Tab. 3). In these models, age interactions with both total obesity and abdominal obesity were tested, and they were not statistically significant.
In predicting hypertension, the area under the ROC curve for BMI was 0.71 (0.67; 0.75) for women and 0.57 (0.52; 0.63) for men. For WC, the area under the ROC curve was 0.71 (0.67; 0.75) for women, and 0.58 (0.52; 0.64) for men. These values show that WC and BMI have similar probabilities to correctly classify the presence or the absence of hypertension
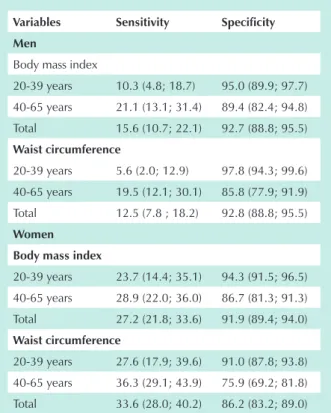
variables sensitivity specificity
Men
Body mass index
20-39 years 10.3 (4.8; 18.7) 95.0 (89.9; 97.7)
40-65 years 21.1 (13.1; 31.4) 89.4 (82.4; 94.8)
Total 15.6 (10.7; 22.1) 92.7 (88.8; 95.5)
Waist circumference
20-39 years 5.6 (2.0; 12.9) 97.8 (94.3; 99.6)
40-65 years 19.5 (12.1; 30.1) 85.8 (77.9; 91.9)
Total 12.5 (7.8 ; 18.2) 92.8 (88.8; 95.5)
Women
body mass index
20-39 years 23.7 (14.4; 35.1) 94.3 (91.5; 96.5)
40-65 years 28.9 (22.0; 36.0) 86.7 (81.3; 91.3)
Total 27.2 (21.8; 33.6) 91.9 (89.4; 94.0)
Waist circumference
20-39 years 27.6 (17.9; 39.6) 91.0 (87.8; 93.8)
40-65 years 36.3 (29.1; 43.9) 75.9 (69.2; 81.8)
Total 33.6 (28.0; 40.2) 86.2 (83.2; 89.0)
table 4 - Predictive ability of total obesity (bMi ≥ 30 kg/m2) and of level 2 waist circumference (Wc) for the detection of risk
of hypertension according to gender and age range. goiânia, brazil, 2001
Age range n Wc bMi
cut-off point (cm) s - e (%) cut-off point (kg/m2) s - e (%)
Men
20-39 years 239 82 60.5 24.5 58.0
40-65 years 192 88 62.8 25.6 56.0
Total 431 86 60.4 24.6 59.2
Women
20-39 years 444 76 62.8 23.5 59.5
40-65 years 362 83 63.2 25.6 66.5
Total 806 80 66.5 25.0 65.0
*The cut-off point where sensitivity equals specificity identifies the highest number of hypertensive and non-hypertensive individuals.
table 5 - Wc and bMi cut-off points where sensitivity equals specificity (s - e)* in predicting hypertension according to age bracketin men and women. goiânia, brazil, 2001
in both genders; this ability is slightly higher among women.
Level 2 WC and BMI ≥ 30 kg/m≥ 30 kg/m 30 kg/m2 showed a low sensitivity
in predicting hypertension, and the highest values were observed for men and women between forty and 65 years of age. Specificity was high for both genders (Tab. 4).
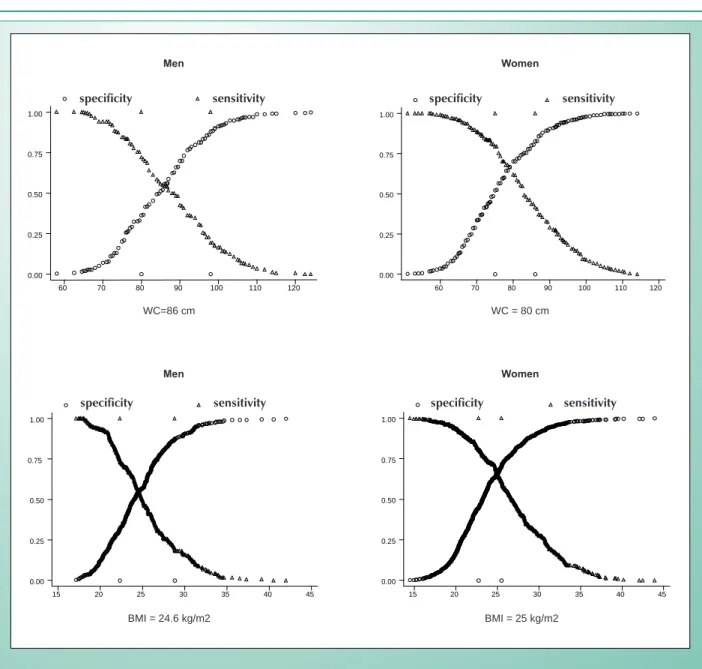
The best predictive WC and BMI cut-off points for hypertension are shown in Figure 1 and Table 5. At these cut-off points, sensitivity and specificity values are similar because they correspond to the point where sensitivity and specificity curves meet. For males, these points were 86 cm for WC, and 24.6
kg/m2 for BMI, whereas for females they were 80 cm for WC
and 25.0 kg/m2 for BMI. These values varied with age, and were
lower for individuals between twenty and 39 years of age, and higher for individuals between forty and 65 years of age.
Discussion
This study analyzed the association between obesity assessed by the anthropometric indexes – BMI and WC – and hypertension, and examined the predictive ability of these indexes to identify the risk of hypertension in the adult population of the city of Goiânia. The external and internal
validity of this study wereensured by using a representative
sample of the adult population of Goiânia, with information collected in the households by trained personnel, with standardized questionnaire and instruments, and by considering the effect of the complex sample design in the analyses. It is important to point out that, although 72.9% of the total sample had been effectively assessed, the comparison of the distribution of the population studied by age group and educational level with data from the 2000 demographic
census15 did not show significant differences for both genders,
which supports the hypothesis that the sample studied is representative of the adult population of Goiânia.
Fig. 1 - WC and BMI cut-off points where sensitivity equals specificity (S - E)* in predicting hypertension in men and women between twenty and 64 years of age. Goiânia, Brazil, 2001.
specificity sensitivity
60 70 80 90 100 110 120
0.00 0.25 0.50 0.75 1.00
Specificity Sensitivity
60 70 80 90 100 110 120
0.00 0.25 0.50 0.75 1.00
Specificity Sensitivity
15 20 25 30 35 40 45
0.00 0.25 0.50 0.75 1.00
Specificity Sensitivity
15 20 25 30 35 40 45
0.00 0.25 0.50 0.75 1.00
Men Women
WC=86 cm WC = 80 cm
Men Women
BMI = 24.6 kg/m2 BMI = 25 kg/m2
with obesity, such as dyslipidemia and diabetes, were not incorporated into this study.
Similar to other studies8,10,12, a high correlation between
WC and BMI was observed for both genders. However, for women, the prevalence of obesity varied according to the anthropometric index used, and central obesity assessed by
the level 2 WC (≥ 88 cm for women, and ≥ 102 cm for men) was more prevalent than total obesity (BMI ≥ 30 kg/m2). These
data suggest a difference between genders in the diagnostic ability of the cut-off points recommended for WC.
Hypertension was observed both in individuals with a normal BMI and in obese individuals. Among the individuals with a normal BMI, 38.4% and 17.4% of men and women were hypertensive, respectively. Among the obese, the proportion of hypertensive individuals raised to 59.1% among men and 58.4% among women. The prevalences of hypertension in
the presence of abdominal obesity were close to the values observed for total obesity. According to observations of other
studies23,24, these results show that both weight gain and
accumulation of abdominal fat increase the probability of an individual to become hypertensive.
In the multiple logistic regression analysis, level 1 and 2 WC were associated with the risk of hypertension in both genders. Overweight and total obesity, in turn, were associated with hypertension only in women. Although total obesity was not significantly associated with hypertension in men, the magnitude of the association was close to the values observed for WC, and the lack of statistical significance may have occurred because of the smaller sample size for men.
The excess adipose tissue is one of the major risk factors associated with hypertension both in prospective studies and in cross-sectional studies in several populations, regardless
specificity sensitivity specificity sensitivity
of age23-26.
In prospective studies, medium and long-term weight gain increased significantly the incidence of hypertension, and weight loss reduced this incidence. Estimates of Framingham’s study suggest that approximately 70% of the new cases of hypertension could be attributed to obesity
or to weight gain1. In the Nurses’ Health Study, a 1 kg/m2
increase in BMI was associated with a 12% increase in the
risk of hypertension27.
Cross-sectional population studies conducted in Brazil showed that in the city of Porto Alegre hypertension was equally associated with BMI, WHR, and WC in women,
whereas in men only BMI was associated with hypertension28.
In the Nutrition and Health Research conducted in the city of Rio de Janeiro, the waist-hip ratio showed a higher ability to predict hypertension and a lower correlation with BMI than
did WC29. In a study conducted in São Paulo, the waist-hip
ratio and WC were similarly associated with hypertension30. In
a sample of women from a health care center in the city of Belo Horizonte, WC was significantly associated with hypertension. However, the cut-off points assessed – 80 cm and 88 cm, showed moderate (63.8%) and low (42.8%) sensitivity for
hypertension, respectively31.
In the single Brazilian longitudinal population study (5.6 ± 1.1-year follow-up) exploring the association between different obesity indexes and the incidence of hypertension, the risk ratio for level 2 WC was 1.78 (0.76; 4.09) for men,
and 1.72 (1.09; 2.73) for women, whereas for BMI ≥ 30
kg/m2 the risk ratio was 1.08 (0.52; 2.24) for men, and
1.74 (0.93; 3.26) for women. The conclusion was that the hypertension incidence risk was more consistent when
obesity was defined using level 2 WC than using BMI ≥ 30
Kg/m2, for both genders32.
These studies corroborate the importance of excess total weight and of visceral fat accumulation in the prevalence of hypertension. However, the anthropometric indexes more frequently used in epidemiological studies (BMI, WC, and WHR) do not reflect the same amount of fat in different populations. The occurrence of differences in the relation between body fat and BMI and/or WC is already well established; this is partly due to genetic differences in body composition, as well as to differences in food intake and in the pattern of physical activity.
The cut-off points recommended for level 2 WC showed low sensitivity for both genders in identifying the risk of
hypertension, which was also observed for BMI ≥ 30 kg/m≥ 30 kg/m 30 kg/m2.
The high specificity observed provides the cut-off points used with an ability to classify few normotensive individuals as hypertensive; on the other hand, many hypertensive individuals are classified as normotensive because of low sensitivity.
In other studies, the sensitivity observed for these anthropometric indexes was low to moderate, and the differences both in the prevalence of risk factors and in body composition produce different sensitivities in the identification
of hypertension in different populations. In Lean et al’s study10,
the sensitivity of level 2 WC in predicting hypertension was 40.3% and 56.6% for adult men and women, respectively. In a sample of overweight American adults, the sensitivity of level 2 WC increased with age and was different among ethnic
groups. For men between forty and 59 years of age, 32.0%,
53.8% and 35.0% sensitivities were observed for White, Black
and Hispanic American, respectively13.
In the analysis of the ROC curve it was interesting to observe that, for the total of women, the best predictive cut-off points for risk of hypertension correspond to the values currently recommended for level 1 WC and for
overweight – 80 cm and 25 kg/m2, respectively. For men,
the balance point between sensitivity and specificity curves was observed below the values currently recommended for level 1 WC and for overweight – 86 cm and 24.6 kg/
m2, respectively. These cut-off points were lower among
the youngest individuals and higher for individuals above forty years of age for both genders. This corroborates the evidences that the relation between adiposity and hypertension is stronger among younger adults and that the risk for cardiovascular diseases is observed as of small increases in total or abdominal adiposity.
The universal use of WC and BMI has been questioned
by several researchers, mainly forAsian populations11,33.In
a sub-sample of White men (n = 4,388) and women (n = 4,631) participating in the Third National Health and Nutrition
Examination Survey (NHANES III) Zhu et al14 observed that
a WC ≥ 90 cm (men) and ≥ 83 cm (women) have the same≥ 90 cm (men) and ≥ 83 cm (women) have the same 90 cm (men) and ≥ 83 cm (women) have the same≥ 83 cm (women) have the same 83 cm (women) have the same odds ratio for the cardiovascular risk factors associated with a
BMI ≥ 25 kg/m≥ 25 kg/m 25 kg/m2, whereas a WC ≥100 cm and ≥ 93 cm for≥100 cm and ≥ 93 cm for100 cm and ≥ 93 cm for≥ 93 cm for 93 cm for
men and women, respectively, is equivalent to the odds ratio
observed for BMI ≥ 30 kg/m≥ 30 kg/m 30 kg/m2.
The results of the present study show that for men the impact of abdominal obesity on hypertension was higher than that of total obesity; for women, both abdominal and total obesity were significantly associated with hypertension. The cut-off points for abdominal obesity – level 2, and for
total obesity – BMI ≥ 30 kg/m2 showed a low sensitivity
in detecting hypertension for both genders. For men, the most adequate cut-off points for the screening of risk of hypertension were lower than the values recommended
for level 1 WC (≥ 94 cm) and for the classification of overweight (≥ 25.0 kg/m2). For women, in turn, the cut-off
points corresponded to the values recommended for level
1 WC (≥ 80 cm) and for the classification of overweight (≥
25.0 kg/m2). These results corroborate the relevance of
using these cut-off points as part of the strategies of public health programs both for the prevention and control of excess weight and to warn about the need to evaluate the presence of hypertension as well as of other risk factors associated with weight gain.
Potencial conflict of interest
References
1. Hubert HB, Feinleib M, Mcnamara M, Castelli W. Obesity as an independent risk factor for cardiovascular disease: A 26-year follow-up of participants in the Framingham Heart Study. Circulation 1983; 67 (5): 968-76.
2. Willet WC, Manson JE, Stampfer MJ, Colditz GA, Rosner B, Speizer FE, et al. Weight, weight change, and coronary heart disease in women. JAMA 1995; 273 (6): 461-5.
3. Okosun IS, Liao Y, Rotimi CN, Prewitt E, Cooper RS. Abdominal adiposity and clustering of multiple metabolic syndrome in White, Black and Hispanic American. Ann Epidemiol 2000; 10: 263-70.
4. World Health Organization. Obesity: Preventing and Managing the Global Epidemic. Report. Geneva; 1997.
5. Calle EE, Thun MJ, Petrelli JM, Rodriguez C, Weath CW. Body-mass index and mortality in a prospective cohort of U.S. adults. The New England Journal of Medicine 1999; 341 (15); 1097-105.
6. Stevens J. Impact of age on associations between weight and mortality. Nutrition Reviews 2000; 25 (5): 129-37.
7. Després J, Allard C, Tremblay A, Talbot J, Bouchard C. Evidence for a regional component of body fatness in the association with serum lipids in men an women. Metabolism 1985; 34 (10): 967-73.
8. Taylor RW, Keil D, Gold EJ, Williams SM, Goulding A. Body mass index, waist girth, and waist-to-hip ratio as indexes pf total and regional adiposity in women: evaluation using receiver operating characteristic curves. Am J Clin Nutr 1998; 67: 44-9.
9. Pouliot MC, Després JP, Lemieux S, et al. Waist circumference and abdominal sagittal diameter: Best simple anthropometric indexes of abdominal visceral adipose tissue accumulation and related cardiovascular risk in men and woman. Am Journal of Cardiology 1994; 73: 460-8.
10. Lean MEJ, Han TS, Morrison CE. Waist circumference as a measure for indicating need for weight management. BMJ 1995; 311: 158-61.
11. Ko GTC, Chan JCN, Woo J, Cockram CS. Waist circumference as a screening measurement for overweight or centrally obese Chinese. International Journal of Obesity 1996; 20: 791-93.
12. Foucan L, Hanley J, Deloumeaux J, Suissa S. Body mass index (BMI) and waist circumference (WC) as screening tools for cardiovascular risk factors in Guadeloupean women. Journal of Clinical Epidemiology 2000; 55: 990-96.
13. Okosun IS, Liao Y, Rotimi CN, Choi S, Cooper RS. Predictive values of waist circumference for dyslipidemia, type 2 diabetes and hypertension in overweight White, Black, and Hispanic American adults. Journal of Clinical Epidemiology 2000; 53: 401-8.
14. Zhu SK, Wang ZM, Heshka S, Heo M, Faith MS, Heymsfield S. Waist circumference and obesity-associated risk factors amosng whites in the National Health and Nutrition Examination Survey: clinical action thresholds. Am J Clin Nutr 2002; 76: 743-9.
15. 9- Fundação IBGE. Censo demográfico 2000 (2000). Disponível em URL: http://www.ibge.gov.br/.
16. Ministério da Saúde. Controle da hipertensão arterial: uma proposta de integração ensino-serviço. Rio de Janeiro: CDCV/NUTES, 1993. 233p.
17. Lohman TG, Roche AF, Martorel R. Anthropometric standardization reference manual. Illinois: Human Kinetics Books, 1988.
18. Artigao LM, Llavador JJ, Puras A, et al. Evaluation and validation of Omron Hem 705 CP and Hem 706/711 monitors for self-measurement of blood pressure. Atencion Primaria 2000; 25: 96-102.
19. Sociedade Brasileira de Hipertensão, Sociedade Brasileira de Cardiologia e Sociedade Brasileira de Nefrologia. IV Diretrizes Brasileiras de Hipertensão Arterial. Campos do Jordão, Arq Bras Cardiol 2004;82(Supl IV): 1-4.
20. Stata Corp. Stata Statistical Software: Release 7.0. Stata Corporation. (2001)
21. Hanley JA, Mcneil BJ. The meaning and use of the area under a receiver operating characteristic (ROC) curve. Radiology 1982; 143: 29-36.
22. Altman DG, Bland JM. Diagnostic tests 1: sensitivity and specificity. BMJ 1994; 308: 1552.
23. Guagnano MT, Ballone E, Colagrande V, et al. Large waist circumference and risk of hypertension. International of Obesity 2001; 25:1360-4.
24. Doll S, Paccaud F, Bovet P, Burnier M, Wietlisbch. Body mass index, abdominal adiposity and blood pressure: consistency of their association across developing and developed countries. International Journal of Obesity 2002; 26: 48-57.
25. Han TS, Leer EM, Seidell JC, Lean MEJ. Waist circumference action levels in the identification of cardiovascular risk factors: prevalence study in a random sample. BMJ 1995; 311: 1401-5.
26. Kroke A, Bergmann M, Klipstein-Grobusch K, Boeing H. Obesity, body fat distribution and body build: Their relation to blood pressure and prevalence of hypertension. International Journal of Obesity 1998; 22: 1062-70.
27. Huang Z, Willet WC, Manson JE, Rosner B, Stampfer MJ, Speizer FE, Colditz GA. Body weight, weight change, and risk for hypertension in women. Annals of Internal Medicine 1988; 128 (2): 81-8.
28. Gus M, Fuchs SC, Moreira LB, et al. Association between different measurements of obesity and the incidence of hypertension. American Journal of Hypertension 1998; 17 (1): 50-3.
29. Pereira RA, Sichieri R, Marins VMR. Razão cintura/quadril como preditor de hipertensão. Cad Saúde Pública 1999; 15 (2): 333-44.
30. Martins IS, Marinho SP. O potencial diagnóstico dos indicadores da obesidade centralizada. Rev Saúde Pública 2003; 37 (6): 760-7.
31. Meléndez-Velásquez G, Kac G, Valente JG, Tavares R, Silva CQ, Garcia ES. Evaluation of waist circumference to predict general obesity and arterial hypertension in women in greater Metropolitan Belo Horizonte, Brazil. Cad Saúde Pública 2002; 18 (3): 765-71.
32. Gus M, Moreira LB, Pimentel M Gleisener ALM, Moraes RS, Fuchs FD. Associação entre diferentes indicadores de obesidade e prevalência de hipertensão arterial, Arq Bras Cardiol 1998; 70 (2): 111-14.