Arq Bras Cardiol 2003; 80: 167-70.
Batista & Franceschini Nutritional counseling serum cholesterol
167
Universidade Federal de Viçosa (UFV)
Mailing address: Correspondência: Sylvia do Carmo Castro Franceschini – Depto. de Nutrição e Saúde – Universidade Federal de Viçosa – Campus Universitário – 36571-000 – Viçosa, MG – E-mail: [email protected]
Objective – To assess the impact of nutritional atten-tion on the lipid profile and nutriatten-tional status of hypercho-lesterolemic patients attended in health centers of Belo Horizonte.
Methods – Using nutritional attendance patient record cards from two health units, the evolution of the lipid profile and the nutritional state (BMI) was monito-red of 96 hypercholesterolemic patients who received diet. The patients were appraised at the following mo-ments: initial (1st consultation), after 3 months (2nd
consul-tation) and last consultation (variable for each patient).
Results – On the first attendance, 44,4% of the patients presented not only high total cholesterol and LDL-c, but also hypertriglyceridemia and 70.3% were overweight or obese, but most patients (75.6%) presented adequate HDL-c levels. There was significant reduction in the BMI, total cholesterol, LDL-c values (p < 0.01) and also in the triglyceride levels (p < 0.05) in the first three months, without alteration in the HDL-c levels. A signifi-cant reduction (p < 0.01) was observed in the frequency of individuals with high cholesterol (from 89.6% down to 47.9%), high and very high LDL-c (from 82.6% down to 45.7%), as well as high and very high triglyceride (from 43.6% down to 16.7%). The observed reduction in fre-quency of the low HDL-c was statistically meaningless.
Conclusion – This study evidences the effect of the nutritional attention on lipid profile in hypercholesterole-mic patients, reinforcing the need for a multiprofessional team to attend them at the public health services.
Keywords: hypercholesterolemia, nutritional status, diet
Arq Bras Cardiol, volume 80 (nº 2), 167-70, 2003
Maria da Conceição Rosado Batista, Sylvia do Carmo Castro Franceschini
Viçosa, MG - Brazil
Impact of Nutritional Counseling in Reducing Serum
Cholesterol in Public Health Service Patients
Original Article
Cardiovascular diseases account for 34% of deaths in Brazil, 11.6% of cerebrovascular disease, 9.8% of ischemic heart disease, 2.3% of arterial hypertension, and 10.3% of other cardiovascular causes 1.
Dyslipidemias are among the most important risk fac-tors for arteriosclerotic cardiovascular disease, together with hypertension, obesity, and diabetes mellitus 2,3.
Howe-ver, national and international studies show that coronary events are reduced when intervention is made on multiple risk factors 4,5.
Total cholesterol and LDL-c (Low-Density Lipoprotein Cholesterol) have a direct relationship with mortality and morbidity from coronary artery disease. Isolated hypertri-glyceridemia is not an independent risk factor for coronary disease but becomes one when associated with high LDL-c levels and low HDL-c (Higher-Density Lipoprotein Cho-lesterol) levels6. HDL-c acts in the reverse transport of
choles-terol, decreasing or reducing the formation of atherosclerotic plaque 3,6. In the third National Health and Nutrition
Exa-mination Study (NHANES III)7, held in the United States, many
factors were reported to affect serum cholesterol levels, including age, diet, genetic predisposition, and body weight.
Few Brazilian studies investigate the effects of dietary intervention on the lipid profile of hypercholesterolemic individuals 8. This study was carried out to assess the
im-pact of nutritional counseling on the lipid profiles of hyper-cholesterolemic patients treated at basic health units on the outskirts of Belo Horizonte and to assess patients’ nutritio-nal status before and after this intervention.
Methods
Patients with hypercholesterolemia, referred by health care professionals for nutritional guidance, were studied at 2 basic health units on the outskirts of Belo Horizonte.
Data were collected on nutritional counseling record forms of patients treated from 1994 to 1999, and the same nu-tritionist followed up and gave dietary advice.
168
Batista & Franceschini
Nutritional counseling serum cholesterol
Arq Bras Cardiol 2003; 80: 167-70.
preparation techniques. The instructions were provided after a dietary recall and basically consisted of adjusting total fat consumption, reducing saturated fat, cholesterol, and transfatty acids, and increasing fiber, mainly the solu-ble ones (fruits and vegetasolu-bles), according to the National Cholesterol Education Program(NCEP - 1993) 9.
The dietary prescriptions were individualized accor-ding to patient’s needs, and those excessively overweight patients were prescribed a low-fat diet while those with alte-red triglyceride levels were told to avoid the ingestion of simple sugarand alcoholicbeverages.
Ninety-six patients were selected according to the following criteria: over 20 years of age, with total serum cholesterol ≥ 200 mg/dL (borderline or high), had received dietary counseling and returned at least once to consult with the nutritionist and had not used lipid-lowering medi-cation during the study period. Diabetic patients and those with coronary artery disease were excluded so that the indi-viduals could be assessed for primary prevention.
The number of participants by sex was 83 (86.5%) females and 13 (13.5%) males. The average age at the first screening was 53.2 ± 12 years, 68.8% up to 59 years and 31.3% over 60.
The patients were weighed and measured by the same professional, on scales with an anthropometer, platform type, with a 150kg capacity and 100g precision.
The biochemical tests were carried out at municipal or licensed laboratories, and blood was collected after a 12-hour fast.
Nutritional status was defined by body mass index (BMI), and the individual classified according to the World Health Organization (WHO, 1998) 10 as low weight (BMI <
18.5), normal weight (18.5 – 24.9), pre-obese or overweight (25-29.9) obesity class I (30-34.9), obesity class II (35-39.9), and obesity class III (≥ 40). BMI greater than 27 was considered a risk factor regardless of coronary disease 11.
The reference levels of the serum lipids were defined according to the guidelines of the Brazilian Cardiology Society 12, that is: optimum cholesterol (< 200mg/dL),
borderline cholesterol (200-239mg/dL), high cholesterol (≥
240mg/dL), optimum LDL-c (< 100mg/dL), desirable LDL-c (100-129mg/dL), borderline LDL-c (130-159mg/dL), high LDL-c (160-189mg/dL), very high LDL-c (≥ 190mg/dL), low HDL-c (< 40mg/dL), high HDL-c (> 60 mg/dL), optimum triglycerides (<150mg/dL), borderline triglycerides (150-200mg/dL), high triglycerides (200-499mg/dL), and very high triglycerides (≥ 500mg/dL).
Castelli risk indices I and II (total cholesterol/HDL-c ratio and LDL-c/HDL-c ratio) were defined as low risk for men (cholesterol/HDL-c ≤ 5.1 and LDL-c/HDL-c ≤ 3.3), low risk for women (cholesterol/HDL-c < 4.4 and LDL-c/HDL-c ≤
2.9), high risk for men (cholesterol/HDL-c > 5.8 and LDL-c/ HDL-c > 3.8) and high risk for women (cholesterol/HDL-c > 5.3 and LDL-c/HDL-c > 3.5) 13,14.
Because the data were collected from routine patient records at a basic health care center, the sample size was dif-ferent for each variable. The time interval between the ap-pointments was not regular either, because many patients did not return for screening during the established period.
The median time intervals between appointments were first screening (first consultation), second screening (3 months after first screening) and the last screening (median of 11 months after the 1st screening).
The data were processed with the EPI-INFO program, version 6.04 15. The median values, obtained at the first and
second screenings were compared with the SIGMA STAT program 16, by using the Wilcoxon test. To compare the
fre-quencies observed before and after intervention, within each reference range of the serum lipids, the chi-square test was used, by adopting a p < 0.05 as significance level.
Results
Table I presents the BMI, total cholesterol, HDL-c, LDL-c, triglycerides and Castelli I and II indices values on the first occasion of nutritional counseling. There were high mean and median values for BMI, total cholesterol, LDL-c and Castelli I and II indices. Both the mean and median were within the recommended level for HDL-c (≥ 40 mg/dL). But for triglycerides, the mean was high and the me-dian was within the desirable value (≤ 200 mg/dL), due to great variability among the data.
Table II shows the results of the nutritional assess-ment by BMI of the hypercholesterolemic individuals on the first screening. Most of the hypercholesterolemic patients (70.3%) were overweight or obese when they sought treat-ment to control their cholesterol.
By comparing the BMI at the first and last screening, a decrease from 31.9% to 19.8% was observed in the frequen-cy of obesity (class I and II), although this difference was not statistically significant (p = 0.06).
When the patients were separated into 2 groups (BMI > 27 and BMI ≤ 27), the group that had the greatest BMI
Table I - Initial BMI values, total cholesterol, HDL-c, LDL-c, triglycerides and Castelli I and II indexes.
Indexes N X ± SD Minimum Median Maximum
BMI 91 27.7 ± 4.29 19 27.7 37.7
Total Cholesterol 96 272 ± 35.1 211 263.5 369
HDL-c 48 45.8 ± 9.5 21 46 67
LDL-c 46 182 ± 29.9 127 176 267
Triglycerides 81 206.5 ± 137.4 50 182 881
Cholest./HDL-c ratio 46 5.99 ± 1.53 3.7 5.75 11.2
Arq Bras Cardiol 2003; 80: 167-70.
Batista & Franceschini Nutritional counseling serum cholesterol
169
values had 35.5 mg/dL more in the median triglyceride level than the other group did, and this difference was 19.0 mg/dL in the women and 64.5 mg/dL in the men.
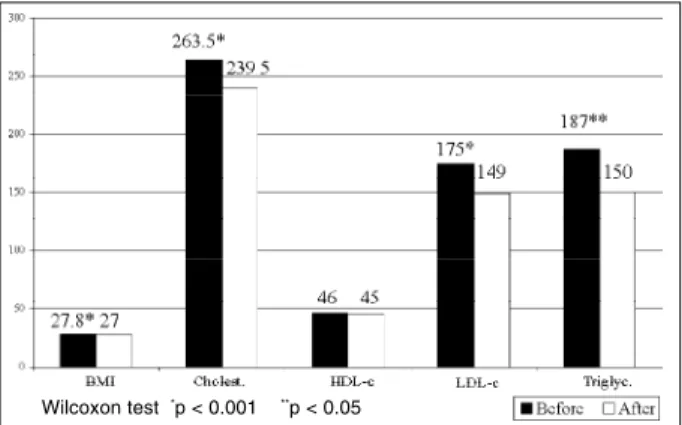
Figure 1 compares the initial median BMI values and the serum lipids with the values obtained 3 months after dietary counseling. A significant reduction occurred in the BMI, total cholesterol, and LDL-c values (p < 0.01) and also in the triglyceride values (p < 0.05). The median HDL-c value, which was within the normal range, was maintained, and no significant difference (p = 0.78) occurred between the 2 screenings.
Table III shows the frequency of the individuals in each reference range of the serum lipids at the first and last screenings. A significant reduction (p < 0.01) may be obser-ved in the percentile of high cholesterol (89.6% down to 47.9%), high and very high LDL-c (82.6% down to 45.7%), high and very high triglycerides (43.6% down to 16.7%), and the cholesterol/HDL-c ratio of high risk (65.9% down to 40.9%). Yet a reduction is noticed in the low HDL-c (24.4% down to 15.6%) and the LDL-c/HDL-c ratio of high risk (81.3% down to 56.3%), although these results were not sta-tistically significant.
Discussion
The higher percentage of women in this study may re-flect a greater female demand for primary prevention servi-ces, because of their greater concern with their own health. At the initial screening, by the inclusion criteria, the study population had high total cholesterol and LDL-c rates but adequate HDL-c levels. BMI was also high and the
triglyceride levels had very differentiated values. Although the levels of HDL-c were adequate, high mean values were observed for the Castelli I and II indexes, and according to the Framingham study, a total cholesterol/HDL-c ratio greater than 5.0 compared with a ratio of 3.5 increases the risk of arteriosclerotic coronary disease 3 times in women 17.
As for characterization of the nutritional status, it was found that less than a third of the patients had normal weight, and the majority was classified as overweight or obese. This fact reinforced the hypothesis of several rese-archers, who have suggested that excess weight is frequen-tly associated with lipid alterations 18 and also contributes
to the risk of coronary disease. Kuczmarski et al 11 defined
BMI > 27 as an independent risk factor for coronary disease for both sexes.
When the characterization of lipid risk for cardiovas-cular diseases was analyzed, it was observed that 100% and 98% had levels above the desirable values for total choles-terol and LDL-c, respectively, when they entered the health service. Most of the patients were borderline or high risk by the Castellli I and II indexes, and according to the Framin-gham study, the total cholesterol/HDL-c ratio identified the population at greatest risk among the women 17.
Table II - Nutritional state of hypercholesterolemic patients at the start of nutritional attendance.
Classification Frequency (%)
Normal 27 (29.6%)
Overweight 35 (38.5%)
Obesity class I 25 (27.5%)
Obesity class II 4 (4.4%)
Total 91 (100%)
Table III - Characterization of the lipid risk in hypercholesterolemic patients before and after the dietary intervention, according to the
norm Atherosclerosis Prevention Guide of the Brazilian Cardiology Society.
Frequency (%)
Lipids N 1ª consultation last
consultation
Total Cholesterol 96
Optimuma 0 14.6
Boderlineb 10.4 37.5
Highc 89.6 47.9
LDL-c 46
Optimumd 0 2.2
Desirablee 2.2 19,5
Boderlinef 15.2 32.6
Highg 47.8 26.2
Very highh 34.8 19.5
HDL-c 45
Lowi 24.4 15.6
Boderlinej 66.7 75.5
Highk 8.9 8.9
Triglycerides 78
Optimuml 41 50
Boderlinem 15.4 33.3
Highn 41.0 16.7
Very higho 2.6 0
Cholesterol/ HDL ratio 44
Low riskp 13.6 31.8
Boderlineq 20.5 27.3
High riskr 65.9 40.9
LDL/HDL ratio 16
Low risks 6.2 6.2
Boderlinet 12.5 37.5
High risku 81.3 56.3
χ2 Cholesterol (a + b x c) = 38.79 p < 0.0001*; χ2 Triglycerides (l + m x n +
o) = 13.43 p = 0.0002*; χ2 LDL-c ( d + e + f x g + h) = 13.66 p = 0.0002*; χ2
Cholesterol/HDL-c ratio (p + q x r) = 5.53 p = 0.02*;χ2 HDL-c (i x j + k) =
1.11 p = 0.29; χ2 LDL-c/HDL-c ratio (s + t x u) = 2.33 p = 0.13
Fig. 1 - Comparison of the mean BMI and serum lipid values before and after 3 months of dietary intervention.
170
Batista & Franceschini
Nutritional counseling serum cholesterol
Arq Bras Cardiol 2003; 80: 167-70.
It was further observed that almost half the patients concomitantly had high risk for triglycerides, which may be directly related to the high prevalence of overweight and obesity in this group.
Denke et al 19 researched American women and
obser-ved that higher BMI values were associated with triglyce-ride levels of 35 to 48 mg/dL higher and HDL-c levels of 5 to 9 mg/dL lower. In the present study, obese individuals (BMI > 27) also had greater triglyceride values, and the difference was more accentuated in the men. Regarding the HDL-c levels, no difference was found for BMI, which coincides with the initial characterization of risk for HDL-c where the majority had low risk even in the presence of high, frequent obesity and overweight.
In the first 3 months (second screening) after the dieta-ry intervention, significant improvement occurred in the lipid profile of the patients, because a fall occurred in the total cholesterol, LDL-c, and triglyceride levels, but the HDL-c levels, which were already adequate were not altered. In this period, the dietary guidance given had also reduced the BMI, which may have contributed to the reduction in triglyceride levels.
Ciorlia 8 studied a group of electricians with borderline
and high serum cholesterol who received dietary counse-ling and observed a similar result for total serum cholesterol reduction after 8 years. In this study, the author also obser-ved in the same time interval, increased cholesterol levels in
those who had previously desirable cholesterol levels, but who did not receive dietary guidance, showing that without preventative measures the cholesterol tended to increase with age 8.
Controlled studies of dietary or medical intervention in
References
1. Ministério da Saúde – Brasil. Coordenação de Doenças Cardiovasculares no Brasil: Sistema Único de Saúde. Brasília, 1993.
2. Castelli WP. Epidemiology of coronary heart disease: the Framingham study. Am J Med 1984; 27: 4-12.
3. Steinberg D. Lipoprotein and pathogenesis of atherosclerosis. Circulation 1987; 79: 508-14.
4. Lólio CA, Souza JMP, Laurenti R. Declínio da mortalidade por doenças cardio-vasculares no município de São Paulo, Brasil, no período de 1970 a 1983. Rev Saúde Públ S Paulo 1986; 20: 454-64.
5. Vartiainen E, Puska P, Jousilahti P, et al. Twenty-year trends in coronary risk factors in North Karelia and in other áreas of Finland. Int J Epidemiol 1994; 23: 495-504. 6. 2º Consenso Brasileiro sobre Dislipidemias. Avaliação, detecção e tratamento.
Arq Bras Cardiol 1996; 67: 109-27.
7. Sempos CT, Cleeman JI, Carrol MD, et al. Prevalence of high blood cholesterol among US adults: an up date based on guidelines from the second report of the National Cholesterol Education Program Adult Treatmet Panel. JAMA 1993; 269: 3009-14. 8. Ciórlia LAS. Intervenção dietética e níveis de colesterol plasmático em grupo de
eletricitários. Arq Bras Cardiol 1997; 68.
9. National Cholesterol Education Program: Second Report of the Expert Panel on Detection, Evaluation, and Treatment of High Blood Cholesterol in Adults (ATP-11). NIH Publication nº 93-3095, 1993.
10. World Health Organization. Preventing and managing the global epidemic: report of a WHO Consultation on Obesity. Geneva, 1997; 3-5.
11. Kuczmarski RJ, Flegal KM, Campbell SM, Johnson CL. Increasing prevalence of overweight among US adults: the National Health and Nutrition Examination Surveys, 1960 to 1991. JAMA 1994; 272: 205-11.
12. III Diretrizes Brasileiras sobre Dislipidemias e Diretriz de Prevenção da Ateros-clerose do Departamento de AterosAteros-clerose da Sociedade Brasileira de Cardiolo-gia. Arq Bras Cardiol 2001; 77 (supl III): 1-48.
13. Novazzi JP, Rabelo LM, Vale AAL, Pinto LESA, Martinez TLR. Conduta clínica no paciente dislipidêmico. In: Martinez TLR. Condutas Clínicas nas Dislipide-mias. Belo Horizonte: Ed. Saúde:, 1997: 119-137.
14. Castelli WP, Abbot WD, Mc Namara PM. Summary estimates of cholesterol used to predict coronary heart disease. Circulation 1983; 67: 730-4.
15. Centers for Disease Control & Prevention (CDC) – Epi-info, version 6: a word pro-cessing, database, and statistics program for Public Health. Geneva, WHO, 1997. 16. Fox E, Kuo J, Tilling L, Ulrich C. – User’s manual – Sigma Stat: statistical
soft-ware for windows. Germany: Jandel, 1994.
17. Martinez TLR, Rabelo LM, Barros MAV, Cendoroglo MS, Aldrighi JM. Dislipi-demias em mulheres. In: Martinez TLR. Condutas Clínicas nas DislipiDislipi-demias. Belo Horizonte: Ed. Saúde, 1997: 215-28.
18. Araújo LMB. Dislipidemias e obesidade. In: Martinez TLR. Condutas Clínicas nas Dislipidemias. Belo Horizonte: Ed. Saúde, 1997: 261-7.
19. Denke MA, Sempos CT, Grundy SM. Excess body weight. An under-recognized contributor to dyslipidemia in white American women. Arch Intern Med 1994; 154: 401-10.
hypercholesterolemic men without coronary disease sho-wed that a mean reduction of 10% in total cholesterol for 4 or 5 years resulted in a 26% lower frequency of coronary events than that observed in controls 6.
In the present study, the median reduction in total cho-lesterol and LDL-c was 9.1% and 14.9%, respectively. It is an expressive reduction, mainly when the hypothesis is consi-dered that many of these patients had dyslipidemia that was more difficult to control (possibly genetic) once they were referred by other health professionals who had detected this difficulty.
When comparing the reference ranges for serum lipids, before and after dietary intervention, a considerable increa-se is obincrea-served in frequency of the individuals with optimum and borderline cholesterol, the desirable and borderline LDL-c, and the optimum and borderline triglycerides. At the same time, a decrease occurs in the number of patients with high cholesterol, high and very high LDL-c, and high trigly-cerides. Thus, these results show an important reduction in the number of people with higher levels of serum lipids (high and very high), a fact that could represent a reduction in costs in primary prevention, since it may result in a de-creased need for lipid-lowering medication, which is res-ponsible for 90% of the total treatment cost 12.