INTRODUCTION
Depletion of nutritional status has been associated with many unsatisfactory clinical outcomes in hospitalized patients and in various clinical situations(3,4,14,24,32). For many years, many studies have reported undesirable outcomes that may occur during the hospital stay of patients diagnosed with malnutrition or even at some nutritional risk(28,31). These indings have been observed in patients with neoplasms, digestive tract diseases, and other clinical situations(22,24,31).
Hence, malnutrition, nutritional risk, recent weight loss, and low energy intake are considered risk factors for poor clinical outcomes in hospitalized patients, regardless of the underlying disease(3,4,14,22,28,31,32).
Given this hospital setting reality, many studies(3,4,22,28,29,34) have used different nutritional status assessment methods, especially the nutritional risk screening (NRS-2002)(28,29,34), subjective global
Relationship between nutritional status and the
clinical outcomes of patients with and without
neoplasms according to multiple
correspondence analysis
Vânia Aparecida
LEANDRO-MERHI
1and José Luiz Braga de
AQUINO
2Received 21/6/2016 Accepted 7/11/2016
ABSTRACT – Background – For many years, many studies have reported undesirable outcomes that may occur during the hospital stay of patients
diag-nosed with malnutrition or even at some nutritional risk. Objective – To investigate the relationship between nutritional status and clinical outcomes
during hospital stay using the multiple correspondence analysis technique. Methods – This cross-sectional study included 600 patients with and without
neoplasms. The following data were collected: subjective global assessment, nutritional indicators, nutritional risk screening, anthropometric data (body mass index (BMI), mid-upper arm circumference (MUAC), mid-upper arm muscle circumference (MUAMC), triceps skinfold thickness (TST), recent weight loss (RWL)), and habitual energy intake (HEI/ER <75%). The clinical outcomes of interest were complications, length of hospital stay (LOHS), and death. The data were analyzed by the chi-square or Fisher’s exact test at a signiicance level of 5%. Multiple correspondence analysis was used for the multivariate data analysis. Results – The multiple correspondence analysis map for the patients with neoplasms showed that the
following characteristics were associated and represented by death, complications, and a greater likelihood of LOHS ≥7 days: underweight according to BMI; TST, MUAC, and MUAMC ≤15th percentile; malnutrition according to the subjective global assessment; at nutritional risk according to the nutritional risk screening; being male; age ≥60 years; and HEI/ER <75%. The multiple correspondence analysis map for the patients without neoplasms showed that the following characteristics were associated and represented by death: underweight according to BMI; TST ≤15th percentile; malnutrition according to the subjective global assessment; and at nutritional risk according to the nutritional risk screening. Complications and LOHS ≥7 days represented the categories male, no recent weight loss, HEI/ER <75%, MUAC and MUAMC ≤15th percentile, TST between the 15th and 85th percentiles, and age <60 years. Conclusion – The results of this study conirm an association between unsatisfactory nutritional indicators
and undesirable clinical outcomes.
HEADINGS – Nutrition assessment. Nutritional status. Anthropometry. Weight loss. Neoplasms.
Declared conflict of interest of all authors: none Disclosure of funding: no funding received
1 Faculdade de Nutrição, PUC-Campinas, SP, Brasil; 2 Faculdade de Medicina, PUC-Campinas, SP, Brasil.
Correspondence: Vânia Aparecida Leandro-Merhi. Avenida Carlos Grimaldi, 1171, casa D-13 – CEP: 13091-906 – Campinas, SP, Brasil. E-mail: vapaleme@gmail.com
assessment(22,28,29,34), biochemical parameters(24,29), and anthropo-metry(3,22,24,29) to investigate the relationship between poor nutri-tional status and bad clinical outcomes, and many of these methods have been considered good predictors of bad clinical outcomes during hospital stay(24,28). Yet, other studies have suggested the combination of subjective and objective methods(29) for nutritional status assessment.
METHODS
Study characteristics, location, cases, ethical approval, and sample size
This cross-sectional study lasted two years (2014-2015). The sample consisted of 600 hospitalized patients with and without neoplasms from the surgery ward of the Hospital and Maternity Hospital Celso Pierro of the Pontiical Catholic University of Campinas-SP-Brazil. The study site is a general hospital institu-tion that provides clinical care, surgery, elective treatment, and emergency care. All study patients were surgical patients because they were recruited at the surgical ward. The group of patients with neoplasms (N=300) regarded patients submitted to cancer surgery (patients with gastrointestinal tract, pulmonary, and head and neck cancers). The group of patients without neoplasms (N=300) had undergone different types of surgery, such as es-ophagectomy to treat megaesophagus, other gastrointestinal tract surgeries, cholecystectomy, colectomy, fundoplication to correct esophageal hiatal hernia (patients with gastrointestinal tract dis-eases, abdominal wall hernias, megacolon, and megaesophagus). The study was approved by the local Research Ethics Committee (protocol no. 393.937).
Inclusion and exclusion criteria
The inclusion criteria were: nutritional assessment within 48 hours of hospital admission, all nutritional assessment data recorded in the medical records of the institution, and age above 20 years. The exclusion criteria were: patients with edema, ascites, or terminal disease; patients undergoing hemodialysis; isolated patients; or patients hospitalized only for tests or clinical investiga-tion. Bedridden patients and patients who could not communicate were also excluded as it was not possible to obtain body weight and energy intake data.
Data collection
The data collected from the medical records included gender, age, length of hospital stay (LOHS), type of disease, complications, mortality, and nutritional indicators to determine nutritional status and nutritional risk.
Variables for nutritional status diagnosis
The following nutritional indicators were analyzed: subjective global assessment (SGA), nutritional risk screening (NRS), an-thropometric data, and habitual energy intake (HEI). Nutritional status was classiied according to the established cut-off points for each one of these indicators.
1. Subjective global assessment (SGA)
SGA data were analyzed as recommended by Detsky et al.(10). SGA makes a subjective assessment by scoring weight loss, food intake, and clinical and physical signs of malnutrition, classifying individuals as well-nourished, mildly malnourished, moderately malnourished, and severely malnourished(10). Patients classiied as mildly, moderately, and severely malnourished were considered malnourished.
2. Nutritional risk screening (NRS)
NRS(19,20) is a means of detecting nutritional risk early in hos-pitalized patients. It has been validated and recommended by the European Society of Clinical Nutrition and Metabolism (ESPEN)
and used in many hospitals globally(27,28,29,34). NRS determines nutritional risk by investigating weight loss, body mass index, low food intake, and disease severity. A score ≥3 indicates nutritional risk, and <3, no nutritional risk(19,20).
3. Anthropometry
Body weight and height, mid-upper arm circumference (MUAC), and triceps skinfold thickness (TST) were collected, and body mass index (BMI) and mid-upper arm muscle cir-cumference (MUAMC) were calculated. The body composition indicators (MUAC, TST, and MUAMC) were classiied according to their percentile distribution as recommended by Frisancho(15) and Burr & Phillips(6) for adults and older adults aged >65 years, respectively. Lean mass depletion (LMD) was deined as MUAC and MUAMC equal to or lower than the 15th percentile (≤P15); a percentile above the reference percentile for lean mass was de-ined as MUAC and MUAMC above the 85th percentile (>P85); and lean mass preservation (LMP) was deined as MUAC and MUAMC between the 15th and 85th percentiles (P15-P85). Fat mass depletion (FMD) was deined as TST equal to or below the 15th percentile (≤P15); excess fat mass (EFM) was deined as TST above the 85th percentile (>P85); and fat mass preservation (FMP) was deined as TST between the 15th and 85th percentiles (P15-P85)(6,15).
BMI was classified as recommended by the World Health Organization(35) and Lipschitz(25) for adults and older adults, re-spectively. Recent weight loss reported by the patients on hospital admission was also investigated and classiied as recent weight loss (yes) and no recent weight loss (no).
4. Assessment of habitual energy intake (HEI)
The patients’ habitual energy intake was assessed during an interview on admission about the foods consumed on a typical day. The interview collected the habitual food history, and the type and amount of foods normally consumed. The energy intake was then calculated by nutrition analysis software(33). Habitual energy intake (HEI) was determined by analyzing habitual food intake data, with subsequent calculation of percent HEI adequacy in relation to individual energy requirement (%HEI/ER). The indi-vidual energy requirement was estimated by the equation proposed by Harris & Benedict(17). This method has already been described in other studies(22). Later, HEI was expressed as a percentage of the energy requirement. Low energy intake was deined as energy intake below 75% of the individual energy requirement (HEI/ ER<75%)(26,31).
Clinical outcomes
The clinical outcomes of interest were complications, LOHS, and death. Complications were deined as postoperative pulmo-nary and cardiovascular complications, anastomotic istula, and abdominal abscesses (sepsis). Length of hospital stay (LOHS) was classiied as ≤6 days or ≥7 days. An outcome was deined as death when the patient died during hospital stay.
Statistical analysis
Multivariate data analysis included multiple correspond-ence analysis (MCA), which studies cross-frequency tables (contingency tables) that explore the simultaneous relationships between variables(5,9,16,21). This exploratory technique uses maps to determine whether the interest groups can be differentiated by their elements (structures subjacent to the variable set). The maps’ interpretation was based on the points located approximately on the same direction of the origin and in the same region of space by parameters such as total inertia, the relative contribution to the inertia and supplementary variables(5,9,16,21). Multiple cor-respondence analysis was chosen because it allows analyzing all
outcomes simultaneously, characterizing the patients’ proiles and considering the three outcomes together with the other explora-tory variables(5,9,16,21).
RESULTS
The data of 600 hospitalized patients were analyzed by general descriptive analysis, comparing the study variables according to disease group (with or without neoplasms) and presence of com-plications (Table 1), death (Table 2), and length of hospital stay (LOHS) ≤6 days or ≥7 days (Table 3).
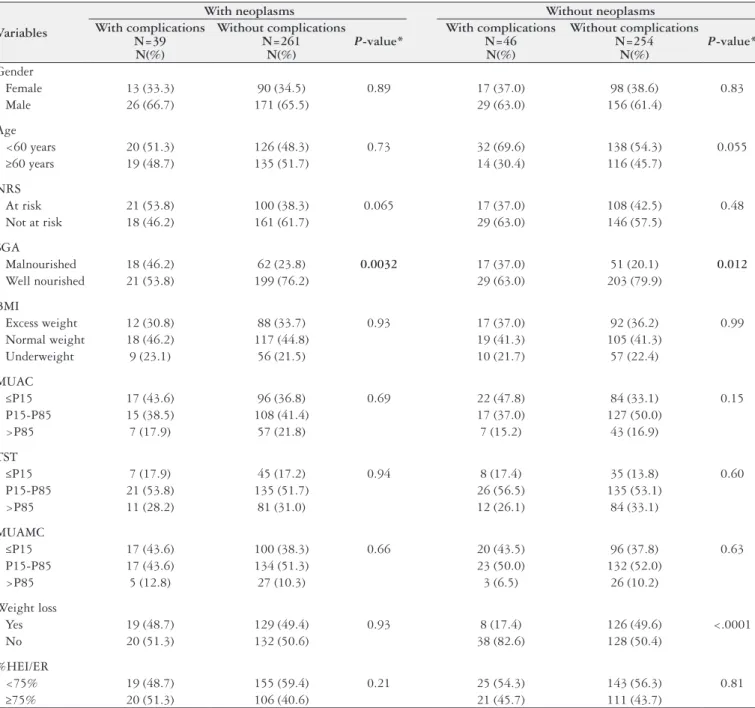
TABLE 1. Descriptive analysis and comparison of the variables by presence of complications in each disease group.
Variables
With neoplasms Without neoplasms With complications
N=39 N(%)
Without complications N=261
N(%)
P-value*
With complications N=46
N(%)
Without complications N=254
N(%)
P-value*
Gender
Female 13 (33.3) 90 (34.5) 0.89 17 (37.0) 98 (38.6) 0.83
Male 26 (66.7) 171 (65.5) 29 (63.0) 156 (61.4)
Age
<60 years 20 (51.3) 126 (48.3) 0.73 32 (69.6) 138 (54.3) 0.055
≥60 years 19 (48.7) 135 (51.7) 14 (30.4) 116 (45.7)
NRS
At risk 21 (53.8) 100 (38.3) 0.065 17 (37.0) 108 (42.5) 0.48
Not at risk 18 (46.2) 161 (61.7) 29 (63.0) 146 (57.5)
SGA
Malnourished 18 (46.2) 62 (23.8) 0.0032 17 (37.0) 51 (20.1) 0.012
Well nourished 21 (53.8) 199 (76.2) 29 (63.0) 203 (79.9)
BMI
Excess weight 12 (30.8) 88 (33.7) 0.93 17 (37.0) 92 (36.2) 0.99
Normal weight 18 (46.2) 117 (44.8) 19 (41.3) 105 (41.3)
Underweight 9 (23.1) 56 (21.5) 10 (21.7) 57 (22.4)
MUAC
≤P15 17 (43.6) 96 (36.8) 0.69 22 (47.8) 84 (33.1) 0.15
P15 -P85 15 (38.5) 108 (41.4) 17 (37.0) 127 (50.0)
>P85 7 (17.9) 57 (21.8) 7 (15.2) 43 (16.9)
TST
≤P15 7 (17.9) 45 (17.2) 0.94 8 (17.4) 35 (13.8) 0.60
P15 -P85 21 (53.8) 135 (51.7) 26 (56.5) 135 (53.1)
>P85 11 (28.2) 81 (31.0) 12 (26.1) 84 (33.1)
MUAMC
≤P15 17 (43.6) 100 (38.3) 0.66 20 (43.5) 96 (37.8) 0.63
P15-P85 17 (43.6) 134 (51.3) 23 (50.0) 132 (52.0)
>P85 5 (12.8) 27 (10.3) 3 (6.5) 26 (10.2)
Weight loss
Yes 19 (48.7) 129 (49.4) 0.93 8 (17.4) 126 (49.6) <.0001
No 20 (51.3) 132 (50.6) 38 (82.6) 128 (50.4)
%HEI/ER
<75% 19 (48.7) 155 (59.4) 0.21 25 (54.3) 143 (56.3) 0.81
≥75% 20 (51.3) 106 (40.6) 21 (45.7) 111 (43.7)
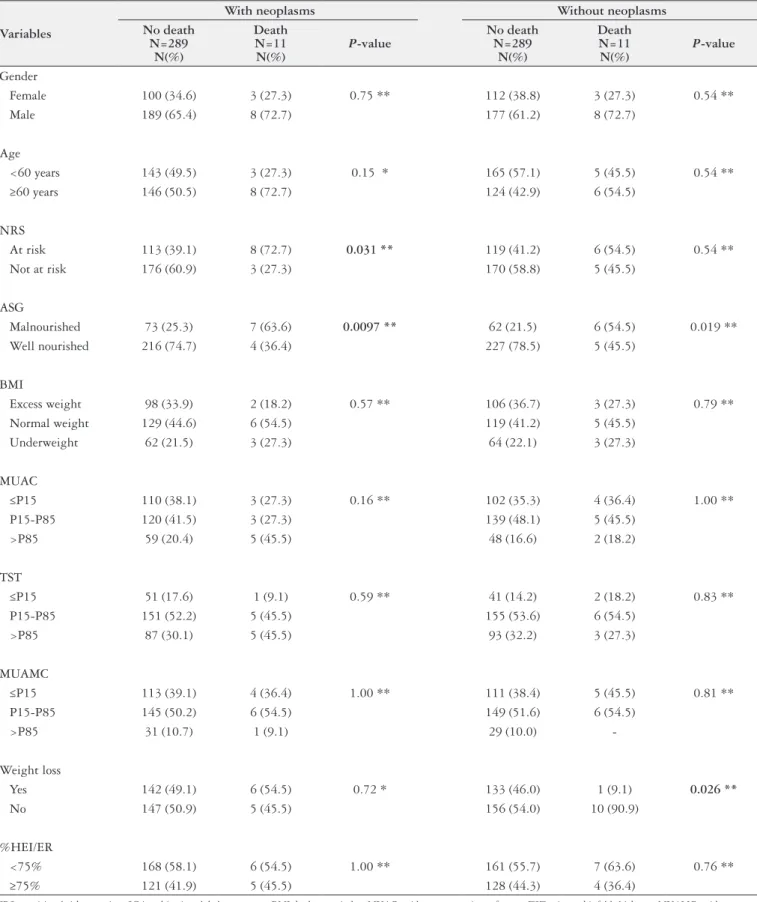
TABLE 2. Descriptive analysis and comparison of the variables by death in each disease group
Variables
With neoplasms Without neoplasms No death
N=289 N(%)
Death N=11 N(%)
P-value
No death N=289
N(%)
Death N=11 N(%)
P-value
Gender
Female 100 (34.6) 3 (27.3) 0.75 ** 112 (38.8) 3 (27.3) 0.54 **
Male 189 (65.4) 8 (72.7) 177 (61.2) 8 (72.7)
Age
<60 years 143 (49.5) 3 (27.3) 0.15 * 165 (57.1) 5 (45.5) 0.54 **
≥60 years 146 (50.5) 8 (72.7) 124 (42.9) 6 (54.5)
NRS
At risk 113 (39.1) 8 (72.7) 0.031 ** 119 (41.2) 6 (54.5) 0.54 **
Not at risk 176 (60.9) 3 (27.3) 170 (58.8) 5 (45.5)
ASG
Malnourished 73 (25.3) 7 (63.6) 0.0097 ** 62 (21.5) 6 (54.5) 0.019 **
Well nourished 216 (74.7) 4 (36.4) 227 (78.5) 5 (45.5)
BMI
Excess weight 98 (33.9) 2 (18.2) 0.57 ** 106 (36.7) 3 (27.3) 0.79 **
Normal weight 129 (44.6) 6 (54.5) 119 (41.2) 5 (45.5)
Underweight 62 (21.5) 3 (27.3) 64 (22.1) 3 (27.3)
MUAC
≤P15 110 (38.1) 3 (27.3) 0.16 ** 102 (35.3) 4 (36.4) 1.00 **
P15-P85 120 (41.5) 3 (27.3) 139 (48.1) 5 (45.5)
>P85 59 (20.4) 5 (45.5) 48 (16.6) 2 (18.2)
TST
≤P15 51 (17.6) 1 (9.1) 0.59 ** 41 (14.2) 2 (18.2) 0.83 **
P15-P85 151 (52.2) 5 (45.5) 155 (53.6) 6 (54.5)
>P85 87 (30.1) 5 (45.5) 93 (32.2) 3 (27.3)
MUAMC
≤P15 113 (39.1) 4 (36.4) 1.00 ** 111 (38.4) 5 (45.5) 0.81 **
P15-P85 145 (50.2) 6 (54.5) 149 (51.6) 6 (54.5)
>P85 31 (10.7) 1 (9.1) 29 (10.0)
-Weight loss
Yes 142 (49.1) 6 (54.5) 0.72 * 133 (46.0) 1 (9.1) 0.026 **
No 147 (50.9) 5 (45.5) 156 (54.0) 10 (90.9)
%HEI/ER
<75% 168 (58.1) 6 (54.5) 1.00 ** 161 (55.7) 7 (63.6) 0.76 **
≥75% 121 (41.9) 5 (45.5) 128 (44.3) 4 (36.4)
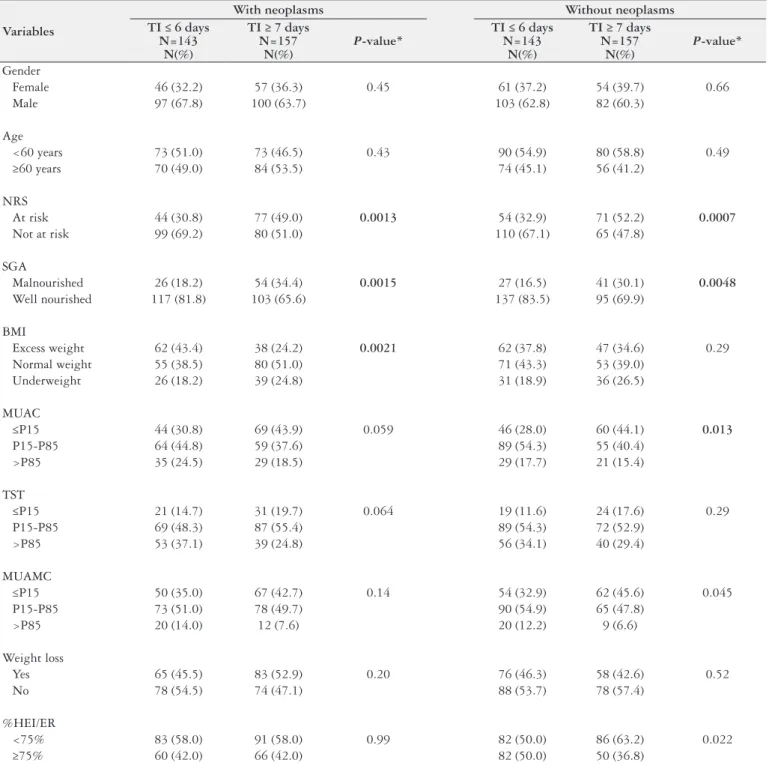
TABLE 3. Descriptive analysis and comparison of the variables by length of hospital stay in each disease group
Variables
With neoplasms Without neoplasms TI ≤ 6 days
N=143 N(%)
TI ≥ 7 days N=157
N(%)
P-value*
TI ≤ 6 days N=143
N(%)
TI ≥ 7 days N=157
N(%)
P-value*
Gender
Female 46 (32.2) 57 (36.3) 0.45 61 (37.2) 54 (39.7) 0.66
Male 97 (67.8) 100 (63.7) 103 (62.8) 82 (60.3)
Age
<60 years 73 (51.0) 73 (46.5) 0.43 90 (54.9) 80 (58.8) 0.49
≥60 years 70 (49.0) 84 (53.5) 74 (45.1) 56 (41.2)
NRS
At risk 44 (30.8) 77 (49.0) 0.0013 54 (32.9) 71 (52.2) 0.0007
Not at risk 99 (69.2) 80 (51.0) 110 (67.1) 65 (47.8)
SGA
Malnourished 26 (18.2) 54 (34.4) 0.0015 27 (16.5) 41 (30.1) 0.0048
Well nourished 117 (81.8) 103 (65.6) 137 (83.5) 95 (69.9)
BMI
Excess weight 62 (43.4) 38 (24.2) 0.0021 62 (37.8) 47 (34.6) 0.29
Normal weight 55 (38.5) 80 (51.0) 71 (43.3) 53 (39.0)
Underweight 26 (18.2) 39 (24.8) 31 (18.9) 36 (26.5)
MUAC
≤P15 44 (30.8) 69 (43.9) 0.059 46 (28.0) 60 (44.1) 0.013
P15-P85 64 (44.8) 59 (37.6) 89 (54.3) 55 (40.4)
>P85 35 (24.5) 29 (18.5) 29 (17.7) 21 (15.4)
TST
≤P15 21 (14.7) 31 (19.7) 0.064 19 (11.6) 24 (17.6) 0.29
P15-P85 69 (48.3) 87 (55.4) 89 (54.3) 72 (52.9)
>P85 53 (37.1) 39 (24.8) 56 (34.1) 40 (29.4)
MUAMC
≤P15 50 (35.0) 67 (42.7) 0.14 54 (32.9) 62 (45.6) 0.045
P15-P85 73 (51.0) 78 (49.7) 90 (54.9) 65 (47.8)
>P85 20 (14.0) 12 (7.6) 20 (12.2) 9 (6.6)
Weight loss
Yes 65 (45.5) 83 (52.9) 0.20 76 (46.3) 58 (42.6) 0.52
No 78 (54.5) 74 (47.1) 88 (53.7) 78 (57.4)
%HEI/ER
<75% 83 (58.0) 91 (58.0) 0.99 82 (50.0) 86 (63.2) 0.022
≥75% 60 (42.0) 66 (42.0) 82 (50.0) 50 (36.8)
LOHS: length of hospital stay; NRS: nutritional risk screening; SGA: subjective global assessment; BMI: body mass index; MUAC: mid-upper arm circumference; TST: triceps skinfold thickness; MUAMC: mid-upper arm muscle circumference; %HEI/ER: percent habitual energy intake adequacy with respect to the individual energy requirement. * Chi-square test.
Complications occurred in 39 (13%) patients with neoplasms and 46 (15.3%) patients without neoplasms (Table 1). Comparison of the study variables (gender, age, RWL, BMI, MUAC, TST, MUAMC, SGA, NRS, and % HEI/ER) of non-neoplastic and neoplastic patients with and without complications showed that only SGA differed in patients with neoplasms (P=0.0032) and
without neoplasms (P=0.012). In other words, the frequency of
malnutrition according to the SGA was higher in patients with complications than in those without complications.
Regarding death (Table 2), comparison of the study variables of non-neoplastic and neoplastic patients showed that SGA dif-fered between survivors and deceased with neoplasms (P=0.0097)
and without neoplasms (P=0.019). The prevalence of malnutrition
regardless of disease group. The same occurred in patients at nu-tritional risk according to the NRS (P=0.031): the frequency of death was higher in patients with neoplasms who were at nutritional risk according to the NRS. Finally, non-neoplastic survivors lost more weight (P=0.026).
Table 3 shows the comparison of the study variables by LOHS (≤6 days and ≥7 days). The rates of malnutrition according to the SGA and nutritional risk according to the NRS differed sig-niicantly in the two disease groups. Malnutrition according to the SGA (P=0.0015) and nutritional risk according to the NRS (P=0.0013) were more prevalent in neoplastic patients with a
hospital stay ≥7 days. Malnourished non-neoplastic patients ac-cording to the SGA (P=0.0048) and at nutritional risk according
to the NRS (P=0.0007) also had longer hospital stays. MUAC (P=0.013) and MUAMC (P=0.045) also differed signiicantly
in non-neoplastic patients, that is, non-neoplastic patients with longer hospital stays (≥7 days) had MUAC and MUAMC ≤P15, indicating lean mass depletion.
The variables included in the multiple correspondence analysis (MCA) were gender, age group, recent weight loss, nutritional status according to BMI, MUAC, MUAMC, TST, SGA, and NRS, and % HEI/ER. The clinical outcomes of interest, such as complica-tions, death, and LOHS ≤6 or ≥7days were used as supplementary variables.
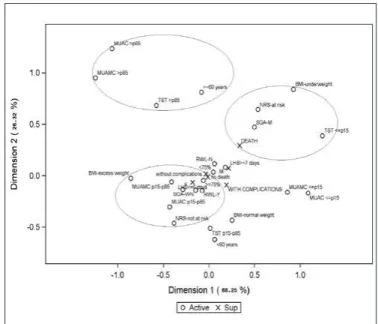
The MCA map for neoplastic patients (Figure 1) showed that the adjusted inertia for the two irst dimensions was 93.5%. The irst dimension explained 79.7% of data variability, and the categories are mainly organized along this axis. The nutritional status categories according to MUAC, MUAMC, and TST >85th
percentile were grouped and not represented by any of the study clinical outcomes. On the other hand, underweight according to BMI; TST, MUAC, and MUAMC ≤P15; malnutrition according to the SGA; nutritional risk according to the NRS; recent weight loss; being male; age ≥60 years; and HEI/ER<75% were associated and represented by death, presence of complications, and closer to a hospital stay ≥7 days. Absence of complications, LOHS ≤6 days, and survival represented the categories of well-nourished according to the SGA; HEI/ER ≥75%; no nutritional risk according to the NRS; no recent weight loss; MUAC, MUAMC, and TST between the 15th and 85th percentiles; age <60 years; being female; and appropriate BMI.
The MCA map for non-neoplastic patients (Figure 2) showed that the adjusted inertia for the two irst dimensions was 94.6%. The irst dimension explains 68.3% of the data variability, and the categories were organized mainly along this axis. MUAC, MUA-MC, and TST >85th percentile and age ≥60 years were grouped and not represented by any of the clinical outcomes. Meanwhile, underweight according to BMI; TST ≤P15; malnutrition according to the SGA; and nutritional risk according to the NRS were associ-ated and represented by death. Recent weight loss; excess weight according to BMI; MUAC and MUAMC between the 15th and 85th percentiles; HEI/ER ≥75%; well-nourished according to the SGA; being female; and no nutritional risk according to the NRS were represented by survivors without complications and with LOHS ≤ 6 days. Complications and LOHS ≥7 days represented the categories being male; no recent weight loss; HEI/ER <75%; MUAC and MUAMC ≤P15; TST between P15 and P85; and age <60 years.
FIGURE 1. Multiple correspondence analysis map (projections on the irst 2 dimensions) for neoplastic patients. The eigenvalues and proportion of explained inertia have been corrected with Benzécri/Greenacre formu-la(26,27). Active variables: gender (female and male); age group (<60 and ≥60
years); recent weight loss (yes-Y and no-N); BMI (underweight, normal weight, excess weight); MUAC, TST, and MUAMC (≤P15, P15-P85, and >P85); SGA (M and WN); NRS (at risk and not at risk); %HEI/ER (<75% and ≥75%). Sup=supplementary variables: complications (with complications and without complications); death (death and no death); and length of hospital stay (≤6 days and ≥7 days).
FIGURE 2. Multiple correspondence analysis map (projections on the irst 2 dimensions) for non-neoplastic patients. The eigenvalues and proportion of explained inertia have been corrected with Benzécri/Greenacre formu-la(26,27). Active variables: gender (female and male); age group (<60 and ≥60
DISCUSSION
This study investigated the nutritional status of a population of patients in a surgical ward using different indicators of nutri-tional status/risk and its relationship with the clinical outcomes length of hospital stay (LOHS), complications, and death, using multiple correspondence analysis. Many studies have investigated the nutritional status of hospitalized patients and its relationship with the risk factors associated with clinical intercurrences during hospital stay(3,22-24,27,28,31). These studies have found strong associa-tions between the nutritional status of these patients and the pres-ence of complications, death, and a lengthy hospital stay, and many have established these associations with logistic regression analy-ses(24,22,28,31). The current study differs from other studies because it used MCA to investigate the relationship between nutritional status and clinical outcomes. MCA found associations between the study variables and demonstrated how they behave inside the MCA map. The MCA map for neoplastic patients evidenced that the variables death and LOHS ≥7 days were associated with many indicators of nutritional risk according to the NRS, malnutrition according to the SGA, underweight according to BMI, depletion of lean and fat masses according to body composition parameters, and recent weight loss. These indings have been described by other studies using another type of analysis(1,2,22,23,24). The present study has found that nutritional status-related variables are associated with routine clinical outcomes during hospital stay. As reported by other recent studies(2), malnutrition on hospital admission is prevalent and associated with long hospital stay. A strong associa-tion has also been found between nutriassocia-tional risk assessed by other indices and longer hospital stay in adult patients(7).
The MCA map for neoplastic patients has shown that malnu-trition according to the SGA and numalnu-tritional risk according to the NRS are associated with complications, death, and LOHS ≥7 days.
Other studies have also shown that patients at nutritional risk according to the NRS have more complications, higher mortal-ity rates, and longer hospital stays(31). Such indings may suggest that NRS variables can be considered independent predictors of unsatisfactory clinical outcomes(31).
Other nutritional indicators, such as the SGA, BMI, low energy intake (<50%), and handgrip strength, predict malnutrition and are associated with long hospital stays(2).
According to multiple logistic regression, moderate to severe nutritional risk, higher age, and emergency hospitalization increases LOHS and mortality signiicantly(24). Many studies(8,18,27,28), have shown the importance of using the NRS to detect nutritional risk early and its association with clinical outcomes; others have used the NRS together with biochemical indicators(8). A study that as-sessed the impact of nutritional support on the clinical outcomes of patients at nutritional risk has found lower rates of complications
and shorter hospital stays in patients at nutritional risk who receive adequate nutritional support during their stay(18).
The MCA map for non-neoplastic patients has shown that death was associated with nutritional risk according to the NRS, malnutrition according to the SGA, and underweight and fat mass depletion according to TST. On the other hand, HEI/ER <75%; MUAC and MUAMC ≤P15; TST between the 15th and 85th per-centiles; and age <60 years were represented by the presence of complications and LOHS ≥7 days in males.
Other recent studies conirmed an association between nutri-tional status deterioration and longer hospital stays, such as the prospective study conducted by Allard et al.(1), in Canadian hospi-tals. In said study the authors administered the SGA and measured body weight on hospital admission and discharge, and found, using multivariate analysis, that nutritional status deterioration according to the SGA and weight loss during hospital stay were signiicantly associated with longer hospitals stays, regardless of other factors, such as disease severity(32).
Using MCA, this study once again confirms the associa-tion between malnutriassocia-tion and nutriassocia-tional risk in a populaassocia-tion representative of surgical ward patients. The study hospital has a team of dietitians and other health professionals that screens the nutritional status of its patients routinely. Although some study patients had good nutritional status and proper weight on admission, other patients were malnourished or at nutritional risk. This reality was observed in a sample of 600 patients from a large university hospital that provides care to patients from the public health care system (SUS) of the municipality and region of a large Brazilian city. One of the disadvantages of cross-sectional studies is the dificulty of establishing a relationship of cause and effect. Moreover, the commonly used multivariate techniques assess one outcome at a time, while MCA allows assessing all outcomes at once. MCA characterizes the patients’ proiles and considers the three outcomes together with the other exploratory variables(5,9,16,21).
In conclusion, the data provided by MCA confirmed the association between unsatisfactory nutritional indicators and un-desirable clinical outcomes, and may contribute to the nutritional and clinical prognosis of neoplastic and non-neoplastic patients.
ACKNOWLEDGMENTS
Pontiical Catholic University of Campinas-SP-Brazil.
Authors’ contributions
Leandro Merhi VA, Aquino JLB. Relação entre estado nutricional e desfechos clínicos pela técnica da análise de correspondência múltipla em pacientes com e sem neoplasias. Arq Gastroenterol. 2017;54(2):148-55.
RESUMO – Contexto – Muitos estudos já vêm relatando há muitos anos, alguns desfechos indesejáveis que podem se manifestar durante o curso da
hos-pitalização em pacientes diagnosticados com desnutrição ou até mesmo com algum risco nutricional. Objetivo – Explorar pela técnica da análise de
correspondência múltipla a relação entre o estado nutricional e os desfechos clínicos apresentados no decorrer da internação em pacientes hospitalizados.
Métodos – Estudo transversal com 600 pacientes com e sem neoplasias. Foram estudados os indicadores nutricionais de avaliação subjetiva global,
screening de risco nutricional, antropometria (IMC, circunferência braquial-CB, circunferência muscular do braço-CMB, prega cutânea triciptal-PCT), perda de peso recente e consumo energético habitual (CEH/NE <75%). Como desfechos clínicos, foram considerados a presença de complicações, tempo de internação e óbito. Os dados foram analisados pelo teste qui-quadrado ou exato de Fisher, com nível de signiicância de 5%. Para a análise multivariada dos dados, utilizou-se a análise de correspondência múltipla. Resultados – O mapa fornecido pela análise de correspondência múltipla no
grupo de pacientes com neoplasias, mostrou que as categorias de baixo peso pelo IMC, PCT, CB e CMB ≤ ao percentil 15, desnutrido pela avaliação subjetiva global, com risco nutricional pelo screening de risco nutricional, com perda de peso recente, sexo masculino, idade ≥ a 60 anos e CEH/NE <75% se associaram e foram representadas pelo óbito, com complicações e mais próximos do tempo de internação ≥ a 7 dias. O mapa fornecido pela análise de correspondência múltipla no grupo de pacientes sem neoplasias, mostrou que as categorias de baixo peso pelo IMC, PCT ≤ ao percentil 15, desnutrido pela avaliação subjetiva global e com risco nutricional pelo screening de risco nutricional se associaram e foram representadas pelo óbito. Complicações e tempo de internação ≥ 7 dias representaram as categorias de sexo masculino, sem perda de peso recente, CEH/NE <75%, CB e CMB ≤ ao percentil 15, PCT entre percentil 15 e 85 e idade < 60 anos. Conclusão – Os resultados deste estudo conirmaram uma associação entre
indicadores nutricionais insatisfatórios e desfechos clínicos indesejáveis.
DESCRITORES – Avaliação nutricional. Estado nutricional. Antropometria. Perda de peso. Neoplasias.
REFERENCES
1. Allard JP, Keller H, Jeejeebhoy KN, Laporte M, Duerksen DR, Gramlich L, et al. Decline in nutritional status is associated with prolonged length of stay in hospitalized patients admitted for 7 days or more: A prospective cohort study. Clin Nutr. 2016;35:144-52.
2. Allard JP, Keller H, Jeejeebhoy KN, Laporte M, Duerksen DR, Gramlich L, et al. Malnutrition at Hospital Admission - Contributors and Effect on Length of Stay: A Prospective Cohort Study From the Canadian Malnutrition Task Force. JPEN J Parenter Enteral Nutr. 2016;40:487-97.
3. Amaral TF, Matos LC, Teixeira MA, Tavares MM, Álvares L, Antunes A. Undernutrition and associated factors among hospitalized patients. Clin Nutr. 2010;29:580-5.
4. Beghetto MG, Luft VC, Mello ED, Polanczyk CA. Accuracy of nutritional assess-ment tools for predicting adverse hospital outcomes. Nutr Hosp. 2009;24:56-62. 5. Benzécri JP. Sur le calcul des taux d’inertie dans l’analyse d’un questionnaire,
addendum et erratum à [BIN. MULT.]. Cahiers de l’Analyse des Données. 1979,4,377–8.
6. Burr ML, Phillips MK. Anthropometric norms in the elderly. Br J Nutr. 1984;51:165-9.
7. Caccialanza R, Klersy C, Cereda E, Cameletti B, Bonoldi A, Bonardi C, Marinelli M, Dionigi P. Nutritional parameters associated with prolonged hospital stay among ambulatory adult patients. CMAJ. 2010;182:1843-9.
8. Chen ZY, Gao C, Ye T, Zuo XZ, Wang GH, Xu XS, Yao Y. Association between nutritional risk and routine clinical laboratory measurements and adverse out-comes: a prospective study in hospitalized patients of Wuhan Tongji Hospital. Eur J Clin Nutr. 2015;69:552-7.
9. Conover WJ (1999). Practical Nonparametric Statistics. 3ª ed. John Wiley & Sons Inc. Nova Iorque.
10. Detsky AS, McLaughlin JR, Baker JP, Johnston N, Whittaker S, Mendelson RA, Jeejeebhoy KN. What is subjective global assessment of nutritional status? JPEN J Parenter Enteral Nutr. 1987;11:8-13.
11. Diez-Garcia RW, de Sousa AA, Proença RP, Leandro-Merhi VA, Martinez EZ. Gauging food and nutritional care quality in hospitals. Nutr J. 2012;11:66. 12. Diez-García RW, Martínez EZ, Penaforte FRO, Japur CC. Hospital nutri-tional care: propositions endorsed by the scientiic Community. Nutr Hosp. 2015;32:1353-61.
13. Duerksen DR, Keller HH, Vesnaver E, Allard JP, Bernier P, Gramlich L, Payette H, Laporte M, Jeejeebhoy K. Physicians’ perceptions regarding the detection and management of malnutrition in canadian hospitals: results of a canadian malnutrition task force survey. Journal of Parenteral and Enteral Nutrition. 2015;39:410-7.
14. Fontes D, Generoso SV, Correia MITD. Subjective global assessment: a reliable nutritional assessment tool to predict outcomes in critically ill patients. Clin Nutr. 2014;33:291-5.
15. Frisancho AR. Anthropometric standards for the assessment of growth and nutritional status. Michigan: The University of Michigan Press; 1990. 16. Greenacre MJ. Multiple and Joint Correspondence Analysis. In: Greenacre MJ
and Blasius J, eds., Correspondence Analysis in the Social Sciences, London: Academic Press, 1994.
17. Harris J, Benedict F. A biometric study of basal metabolism in man. Washington D.C. Carnegie Institute of Washington. 1919.
18. Jia ZY, Yang J, Tong DN, Peng JY, Zhang ZW, Liu WJ, Xia Y, Qin HL. Screening of nutritional risk and nutritional support in general surgery patients: a survey from Shanghai, China. Int Surg. 2015;100:841-8.
19. Kondrup J, Allison SP, Elia M, Vellas B, Plauth M. ESPEN guidelines for nutrition screening 2002. Clin Nutr. 2003;22:415-21.
20. Kondrup J, Rasmussen HH, Hamberg O, Stanga Z, ESPEN Working Group. Nutritional risk screening (NRS 2002): a new method based on a analysis of controlled clinical trials. Clin Nutr. 2003;22:321-36.
21. Le Roux B, Rouanet H. Multiple Correspondence Analysis: Quantitative appli-cations in the social sciences, volume 163, California, SAGE, 2009.
22. Leandro-Merhi VA, Aquino JLB, Chagas JFS. Nutrition status and risk factors associated with length of hospital stay for surgical patients. JPEN J Parenter Enteral Nutr. 2011;35:241-8.
23. Leandro-Merhi VA, Aquino JLB. Comparison of nutritional diagnosis methods and prediction of clinical outcomes in patients with neoplasms and digestive tract diseases. Clin Nutr. 2015;34:647-51.
24. Lee H, Cho YS, Jung S, Kim H. Effect of nutritional risk at admission on the length of hospital stay and mortality in gastrointestinal cancer patients. Clin Nutr Res. 2013;2:12-8.
25. Lipschitz DA. Screening for nutritional status in the elderly. Prim Care. 1994;22:55-67. 26. Mimiran P, Hosseinpour-Niazi S, Mehrabani HH, Kavian F, Azizi F. Validity
and reliability of a nutrition screening tool in hospitalized patients. Nutrition. 2011;27:647-52.
27. Raslan M, Gonzalez MC, Dias MCG, Nascimento M, Castro M, Marques P, Segatto S, Torrinhas RS, Cecconello I, Waitzberg DL. Comparison of nutrition-al risk screening tools for predicting clinicnutrition-al outcomes in hospitnutrition-alized patients. Nutrition. 2010;26:721-6.
28. Raslan M, Gonzalez MC, Torrinhas RSMM, Ravacci GR, Pereira JCR, Waitzberg DL. Complementarity of Subjective Global Assessment (SGA) and Nutritional Risk Screening 2002 (NRS 2002) for predicting poor clinical outcomes in hospi-talized patients. Clin Nutr. 2011;30:49-53.
29. Ryu SW, Kim, IH. Comparison of different nutritional assessments in detecting malnutrition among gastric cancer patients. World J Gastroenterol. 2010;16:3310-7. 30. SAS System for Windows (Statistical Analysis System), version 9.4. SAS Institute
Inc, 2002-2012, Cary, NC, USA.
31. Sorense J, Kondrup J, Prokopowicz J, Schiesser M, Krahenbbuhl L, Meier R, et al. EuroOOPS: an international, multicentre study to implement nutritional risk screening and evaluate clinical outcome. Clin Nutr. 2008;27:340-9.
32. Tangvik RJ, Tell GS, Eisman JA, Guttormsen AB, Henriksen A, Nilsen RM, Oyen J, Ranhoff AH. The nutritional strategy: four questions predict morbidity, mortality and health care costs. Clin Nutr. 2014;33:634-41.
33. Universidade Federal de São Paulo. Escola Paulista de Medicina. Programa de Apoio a Nutrição (NUTWIN) – programa de computador, versão 1.5. São Paulo: UNIFESP/ EPM; 2002.
34. Velasco C, Garcia E, Rodríguez V, Frias L, Garriga R, Álzarez J, Garcia-Peris P, León M. Comparison of four nutritional screening tools to detect nutritional risk in hospitalized patients: a multicentre study. Eur J Clin Nutr. 2011;65:269-74. 35. World Health Organization (WHO). Obesity: Preventing and managing the global