1,3 2 2 3 Sandra Maria Lima Ribeiro
Marcia Val Miyamoto Camila Maria de Melo Joseph Kehayias
Bioelectrical impedance vectorial analysis and
nutritional status of older women according
to body mass index
Análise vetorial de bioimpedância e estado nutricional de
idosas de acordo com o índice de massa corporal
1. Universidade de São Paulo. Escola de Artes, Ciências e Humanidades. São Paulo, SP. Brasil.
2. Universidade São Judas Tadeu. São Paulo, SP. Brasil.
3. Unites States De-partment of Agriculture - Human Nutrition Re-search Center on Aging at TUFTS University. Boston, MA. USA.
Received: 06 May 2010 Accepted: 08 September 2011
CC $ =
Abstract – The objective of the present study was to compare and discuss the nutritional status of older women according to different categories of BMI. Additionally, the study was aimed at introducing the bioelectrical impedance vector analysis (BIVA) as a tool to assess the nutritional status. Thirty-two women (60 years or older, physically independent, and with moderate level of physical activity) were divided into three groups according to BMI classiication: G1 (BMI<23 Kg/m2); G2 (23<BMI<28 Kg/m2); and G3 (BMI>28 Kg/
m2). The following variables were analyzed as indicators of nutritional status: body mass
and height to calculate BMI, waist circumference (WC), hip circumference (HC), waist-hip ratio (WHR), bioelectrical impedance (BIVA), resting energy expenditure (REE), biochemical markers of nutritional status (glucose, total cholesterol, and fractions, IGF-1, and leptin). The groups were compared using ANOVA and the Hotelling’s T 2 test for
vec-tor analysis. The main indings based on vecvec-tor displacement showed lower reactance and higher resistance in G1. G3 showed the highest values of CC and leptin, and also lower REE. Therefore, higher BMI suggested at the same time higher cell mass and higher risk of developing chronic diseases. In turn, lower BMI values suggested reduced fat-free body mass. These results conirm the search for speciic classiication of BMI for the elderly and suggest the BIVA as a viable alternative in physical and nutritional assessment.
Key words: BMI; Body composition; Elderly health; Nutritional status.
Resumo – O objetivo do presente estudo foi comparar e discutir o estado nutricional de idosas, de acordo com diferentes categorias de IMC. Adicionalmente, objetivou-se introduzir a análise
vetorial de bioimpedância (BIVA) como ferramenta na avaliação do estado nutricional.Trinta
e duas mulheres (60 anos ou mais, isicamente independentes e nível moderado de atividade física), foram distribuídas em três grupos de acordo com a classiicação do IMC: G1 (IMC<23kg/
m2); G2 (23<IMC<28Kg/m2); e G3 (IMC>28Kg/m2). Foram analisados como indicadores do
estado nutricional: massa corporal e estatura para cálculo do IMC, circunferência da cintura (CC), circunferência do quadril (CQ) e relação cintura quadril (RCQ); bioimpedância elétrica (por BIVA); - gasto energético de repouso (GER); variáveis plasmáticas indicadoras do estado nutricional (glicose, colesterol total e frações, IGF-1 e leptina). Os grupos foram comparados
por ANOVA e pelo teste Hotelling’s T2 para análise vetorial. Como principais resultados, o
posicionamento do vetor na bioimpedância apontou menor reactância e maior resistência para G1. O G3 apresentou os maiores valores de CC e leptina, e também menor GER. Portanto, os maiores valores de IMC, ao mesmo tempo em que apontam melhor massa celular, apontam também maior risco de desenvolvimento de doenças crônicas. Por sua vez, os menores valores de IMC indicaram redução da massa corporal livre de gordura. Os resultados ratiicam a busca por classiicação especíica do IMC para idosos e apontam a BIVA como uma alternativa viável na avaliação física e nutricional.
Bioelectrical impedance, BMI, and nutritional status of older women Ribeiro et al.
INTRODUCTION
The growing phenomenon of population aging re-quires further studies on the health and nutritional status of the elderly1. Nutritional status is deined as
the balance between energy intake and nutrients, and their use by the body. Nutritional status assessment includes anthropometric measurements and body composition analysis, biochemical markers, evalua-tion of diet and energy expenditure. In order to make the interpretation of nutritional status more com-prehensive, the possibilities of measures have been expanded, including, for example, functional tests, muscle strength, glucose metabolism, work capacity, molecular and genetic analyses, among others2.
The assessment of nutritional status of the elderly can be considered a challenge because of all the changes associated with aging. For example, fat-free mass is reduced peripherally, and body fat tends to increase in the abdominal region. Several studies have investigated these changes; however, the reasons and the best methods and techniques to identify them are yet to be better explained by the studies on body composition3,4.
Among the different methods and techniques for body composition analysis, bioelectrical imped-ance analysis (BIA) is considered practical, non-invasive, and its instruments are easy to operate5.
However, in certain populations or under certain conditions, BIA has limitations for the develop-ment of specific equations6. With the purpose
of minimizing this problem, BIA vector analysis (BIVA) has been proposed. With this method data interpretation is performed simply based on the graph of resistance (R) and reactance (Xc) [divided by height (H)] and the resultant vector. There is no need to use equation in this type of interpretation7,8.
The BIVA has received attention as a valu-able tool to analyze the state of hydration and cell mass7,8, and it has demonstrated prognostic value
in conditions such as preoperative period, cancer, immunodeiciency virus infection or Alzheimer’s disease9-11. As a fundamental concept for
interpret-ing the data, Xc is considered as the resistive effect produced by tissue interfaces and cell membranes. In turn, R is the pure opposition to the electric current and phase angle (resultant vector) relects the capacitance. Buffa et al.12 suggested that the
use of the BIVA can evaluate the changes typical of body compartments during the aging process.
In the investigation of methods and techniques of body composition and aging, anthropometric measurements and their relationships also deserve
to be commented. Body mass index (BMI = body mass/height2) has signiicant correlation with body
fat mass and development of chronic diseases. Thus, high BMI values are associated with higher morbidity and mortality risk13. Conversely, some
studies have shown higher survival rates in higher BMI values14-16. Energy reserves in old age are
sup-posed to be important to cope with physical and psychological stress14,15.
A multicenter cross-sectional study involving Latin American elderly (Health and Welfare in the Old Age Project-SABE)17, planned with the
participation of the Pan American Health Organi-zation (PAHO), used the following BMI ranges for data collection and analysis: low (≤ 23); normal (23>BMI<28); and high (28>BMI>30) and obesity (≥ 30). Therefore, it is clear that in this study the range classiied as “normal” is different from the known cutoff points for young adults (which is between 18.50 to 24.99 Kg/m2)18.
In summary, some studies suggest that elderly patients with higher BMI have a greater chance of survival. Based on this statement, the present study hypothesizes that higher BMI is related to a better state of health, which means a better nutritional status. As many variables as possible should be investigated to conirm a better nutritional status.
Thus, the objective of the present study was to compare and discuss the nutritional status of elderly women according to different categories of BMI. Additionally, we intend to introduce the BIVA in nutritional status assessment.
METHODS
Participants
This study was conducted at a Senior Center at the East Region of the city of São Paulo, state of São Paulo, Brazil. Volunteers were recruited by means of posters and lectures. Therefore, it was a non-probability convenience sample. Only women over 60 years with moderate level of physical ac-tivity were included. Women who reported use of drugs that could modify the basal metabolic rate (e.g., drugs for weight loss or thyroid hormones), or who reported acute or chronic illnesses that could interfere with data collection were excluded. It is worth highlighting that the elderly women who reported type II diabetes, hypertension or hyper-cholesterolemia were not excluded because these diseases are highly prevalent in the elderly.
Data collection
The participants underwent a comprehensive analysis of their nutritional status according to the variables described and explained below.
General information
Acute and chronic diseases, as well as great changes in body weight may indicate an imbalance in the nutritional status.2 To collect such information, the
participants were asked about changes in their body weight in the previous six months and history of acute and chronic diseases. They were also asked about demographic data.
Level of physical activity
Physical inactivity is associated with a number of chronic diseases and poor nutritional status19. Therefore, in order to control some
vari-ables, we included women with moderate level of physical activity, which was classiied according to the International Physical Activity Questionnaire-IPAQ20, short version.
Anthropometric measurements
The classiication of the nutritional status also in-cludes two anthropometric indicators2. Body mass
(BM; Filizola 0.1 g-precision scale) and height (H; Secca, 0.1 cm range stadiometer) were measured to calculate body mass index (BMI in kg/m2). Waist
circumference (WC) and hip circumference (HC) were measured, and the waist-hip ratio (WHR) was calculated21. All procedures for taking the
anthro-pometric measurements were based on Lohman, Roche and Martorell22 and the measurements were
performed by a single examiner.
Bioelectrical impedance analysis with vector analysis (BIA and BIVA)
We postulate in the present study that the analysis of cellular integrity and hydration evaluated using BIA may be an important tool in nutritional status assessment. BIA was performed in the morning after a night’s rest and before eating. The partici-pants arrived at the laboratory between 7 and 9 am. They had been previously told not to perform strenuous physical exercise, not to modify their eat-ing habits on the previous day, and to drink water as usual. The analysis (Biodynamics 450e®) was performed with the subjects in the supine position on a nonconductive surface, with electrodes placed
were performed by the same evaluator. Resistance (R) and reactance (Xc) data were plotted on an R/H Xc/H graph using speciic software23.
Resting energy expenditure (REE)
Some studies, as reviewed by Manini24, have
de-scribed the reduction in resting energy expenditure (REE) with aging, which may be associated with changes in the nutritional status. In our study, REE was measured immediately after BIA, always by the same evaluator. We used the metabolic analyzer VO2000 (Inbrasport®). The participants rested on a stretcher for 30 minutes before the test. They were instructed to remain relaxed but awake, avoid coughing, talking or moving during the measure-ment period. The record of the gas exchange meas-urements only started after adaptation, deined as the period of ive consecutive minutes during which the coeficient of variation (CV) was at most 10% for oxygen consumption (VO2) and carbon dioxide (VCO2) and 5% for RQ (respiratory quotient). After reaching this acclimatization, the measurements were recorded for a period of 30 minutes. REE for 24 hours was estimated according to equation by Jequier & Shultz2.
Biochemical analysis
Biochemical markers are sensitive indicators of the nutritional status, especially for being able to detect nutritional problems in their initial state.2
Bioelectrical impedance, BMI, and nutritional status of older women Ribeiro et al.
Groups for data analysis
Based on the results of the anthropometric meas-urements, women were divided into three groups according to the following BMI categories: G1 (BMI<23 Kg/m2); G2 (23<BMI<28 Kg/m2) and
G3 (BMI>28 Kg/m2). This deinition of categories
is a modiication of the document of the PAHO - SABE Project17.
Statistical analysis
Data are presented as mean ± standard deviation (SD); the three BMI groups were compared using one-way ANOVA followed by Bonferoni test as post hoc. The analyses were performed using the computer program Statistica 7.0 (Statsoft, Inc.). The signiicant differences between the vectors of the groups according to Hotelling’s T2 test for vector
analysis and Mahalanobis distance (D), which is the distance between two groups, were analyzed using speciic software for the BIVA23. The acceptable
level of signiicance was p < 0.05 for all analyses.
RESULTS
The study included 37 women. Age did not dif-fer signiicantly between the groups: G1=68.7± 5.1 years; G2=68.4± 7.5 years; G3=67.7± 5.0 years (p=0.90). Regarding the overall information pro-vided by the participants, 56.8% reported there was no change in body mass over the previous six months, 35.4% reported they had intentionally reduced body mass, and 8.1% could not answer the question. Only 16.2% reported not using any medication, whereas the remaining 83.9% usually used drugs for diabetes, hypertension, and hyper-cholesterolemia, all under medical supervision.
The anthropometric and BIA variables are described in Table 1. We found that G3 showed
higher values of WC, HC, WHR, and reactance, and lower resistance value.
Figure 1 shows the vector position of the three groups and also the reference population for the age group. G1, G2, and G3 had signiicantly dif-ferent vector position from each other; G1 showed lower Xc, higher R, and consequently lower phase angle. The difference between the three groups was signiicant compared to the reference population, but we found that G3 was the most similar to this population (D value).
Figure 1. Vector position of the groups. D = Mahalanobis
distan-ce between two groups; R/H = resistandistan-ce divided by height; T2 =
Hotelling’s test; Xc/H = reactance divided by height. Reference: U.S. population of similar age analyzed in the National Health and Nutrition Examination Survey (see ref. 23).
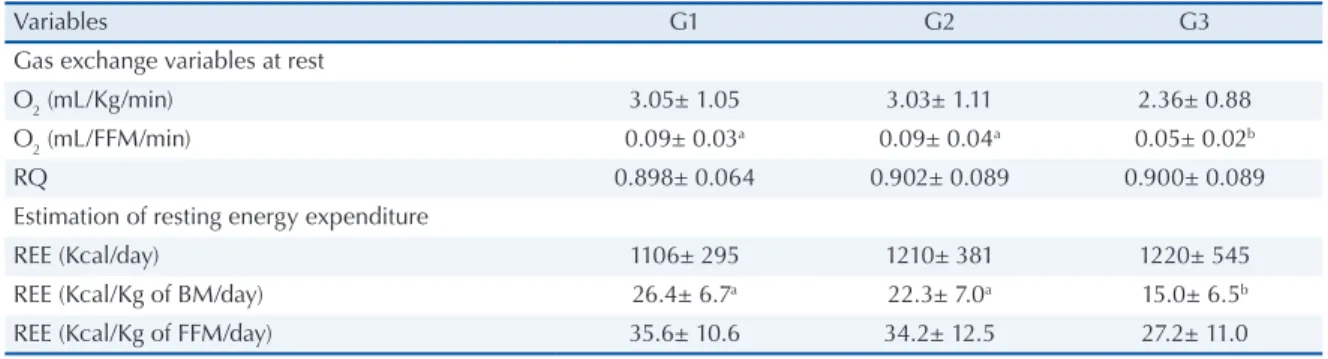
According to Table 2, G3 had lower oxygen consumption and consequently lower REE. Table 3 shows that G1 showed the highest values for fasting glucose, but all values were within the reference range. G3 showed the highest values of leptin. The other variables showed no difference between the groups.
DISCUSSION
The present study compared the nutritional status of elderly women according to different BMI values, using, among other indicators, the BIVA. We found lower lean mass in the BMI value below 23 Kg/m2
Table 1. Anthropometric and body composition variables (mean± SD)*
Variables G1 G2 G3
Anthropometric measures and indices
BMI (Kg/m2) 20.6± 1.9a 26.0± 1.3b 31.6± 2.5c
Waist circumference (cm) 73.6± 3.4a 78.4± 9.6a 96.1± 7.1b
Hip circumference (cm) 92.4± 2.4a 98.7± 3.9b 111.3± 6.5c
WHR 0.79± 0.03a 0.79± 0.09a 0.86± 0.06b
Bioelectrical impedance analysis variables
R/H 466.0± 61.8a 403.9± 39.3b 346.1± 35.0c
Xc/H 42.5± 12.0a 44.0± 4.8a 36.3± 5.1b
Phase angle (o) 5.2± 1.1 6.2± 0.5 6.0± 0.7
and risk of developing chronic diseases coupled with better cell state in the BMI values above 28 Kg/m2.
The group with the highest BMI value had higher anthropometric measures indicative of chronic disease risk. Additionally, this group also had the lowest REE, which may mean lower metabolic activity, with consequent increased risk of developing chronic diseases26. The higher
plasma concentration of leptin in this group may also indirectly suggest a possible leptin resistance, as typically occurs in obese individuals27.
The somatotropic axis, assessed in the present study by IGF-I, showed a tendency to lower values in G1 (although not statistically signiicant). Lower levels of IGF-I may indicate lower protein synthe-sis and consequently a possible relationship with lower lean body mass28. In addition, in this group
with lower BMI, the bioelectrical vector showed the lowest phase angle, relecting a reduction in cell mass. Experimental data have demonstrated reduced phase angle, with length equal to or greater than the reference values in elderly with sarcope-nia9,11. Therefore, these results may indicate that
G1, despite having shown better results related to body fat, showed lower lean body mass, which may mean an impaired nutritional status and beginning the process of sarcopenia.
Other results in this study may enhance the possibility of lower lean body mass in G1 compared with the other groups. The higher glucose values may mean the development of insulin resistance processes. Data in the literature show an associa-tion between insulin signaling and inlammaassocia-tion29,
and between inlammation and sarcopenia30. In
other words, there is the possibility that lower BMI values may be associated with a chronic in-lammatory state, greater insulin resistance, and consequently higher risk for reduction of lean mass. However, these data is only speculative, since they require more speciic biochemical analysis.
All information obtained in the two extreme groups – lowest and highest classiications of BMI – lead us to suppose, based on the results of our study, a normal range in the intermediate group (G2), with values between 23 and 28 Kg/m2. This
range agrees with previous studies16,17.
It is important to highlight the limitations of the present study. Only women were included, and we cannot state that the results are representative of the Brazilian elderly population. Furthermore, as previously stated, the use of serum biochemical markers (glucose, leptin, IGF-I) are not suficient to support some molecular mechanisms discussed. Regarding the drugs taken by the participants, they
Gas exchange variables at rest
O2 (mL/Kg/min) 3.05± 1.05 3.03± 1.11 2.36± 0.88
O2 (mL/FFM/min) 0.09± 0.03a 0.09± 0.04a 0.05± 0.02b
RQ 0.898± 0.064 0.902± 0.089 0.900± 0.089
Estimation of resting energy expenditure
REE (Kcal/day) 1106± 295 1210± 381 1220± 545
REE (Kcal/Kg of BM/day) 26.4± 6.7a 22.3± 7.0a 15.0± 6.5b
REE (Kcal/Kg of FFM/day) 35.6± 10.6 34.2± 12.5 27.2± 11.0
*superscript letters represent the statistical analysis between the groups; different letters mean significant differences with p<0.05. REE = resting energy expenditure; BM = body mass, FFM = fat free mass; RQ = respiratory quotient.
Table 3. Biochemical markers of nutritional status (mean±SD)*
Variables G1 G2 G3
Glucose (mL.dL-1) 98.8± 34.1a 69.8± 8.5b 80.0± 14.2b
Total cholesterol (mL.dL-1) 213.1± 34.8 185.9± 38.1 201.2± 29.7
HDL-Cholesterol (mL.dL-1) 50.3± 14.8 42.4± 13.9 47.4± 11.3
LDL-Cholesterol (mL.dL-1) 148.1± 36.3 125.5± 32.2 133.2± 29.2
VLDL-Cholesterol (mL.dL-1) 14.7± 6.0 18.0± 7.7 20.6± 6.0
Triglycerides (mL.dL-1) 73.6± 29.9 88.7± 40.4 103.2± 30.4
Leptin (ng.dL-1) 7.71± 7.26ab 19.01± 12.38a 28.22± 13.78b
IGF-I (ng.dL-1) 449± 704 1119± 2020 686± 1134
Bioelectrical impedance, BMI, and nutritional status of older women Ribeiro et al.
might have generated bias in the interpretation of the results. Finally, studies with larger probability samples and including other variables of body composition, such as DEXA (dual X-ray energy, considered the gold standard), could help interpret the results.
CONCLUSION
The present study showed differences in the nutri-tional status according to BMI in elderly women, which reinforces the need for speciic cutoff points for this population group. Additionally, we consider the BIVA as a coherent analysis of body composi-tion in these individuals.
Acknowledgements
We are thankful to A. Piccoli and G. Pastori (De-partment of Medical and Surgical Sciences, Uni-versity of Padua, Italy) for providing the software for the analysis by means of the BIVA.
REFERENCES
1. Cherry D, Lucas C, Decker SL. Population aging and the use of ofice-based physician services. NCHS Data Brief 2010;41:1-8.
2. Gibson R. Principles of Nutritional Assessment. 2ª. Edition. New York: Oxford University Press; 2005. 3. Ahmed T, Haboubi N. Assessment and management of
nutrition in older people and its importance to health. Clin Interv Aging 2010;5:207-16.
4. Nicklas BJ, Penninx BW, Cesari M, Kritchevsky SB, Newman AB, Kanaya AM et al. Health, Aging and Body Composition Study. Association of visceral adipose tissue with incident myocardial infarction in older men and women: the Health, Aging and Body Composition Study. Am J Epidemiol 2004; 160:741-9. 5. Ellis KJ. Selected body composition methods can be
used in ield studies. J Nutr 2001;131(5):1589S-95S. 6. Bussolotto M, Ceccon A, Sergi G, Giantin V, Beninca
P, Enzi G. Assessment of body composition in elderly: accuracy of bioelectrical impedance analysis. Gerontol-ogy 1999;45:39-43.
7. Piccoli A, Pittoni G, Facco E, Favaro E, Pillon L. Relationship between central venous pressure and bioimpedance vector analysis in critically ill patients. Crit Care Med 2000; 28:132–7.
8. Toso S, Piccoli A, Gusella M, Menon D, Crepaldi G, Bononi A et al. Bioimpedance vector pattern in cancer patients without disease versus locally advanced or dis-seminated disease. Nutrition 2003;19:510-4.
9. Norman K, Smoliner C, Valentini L, Lochs H, Pirlich M. Is bioelectrical impedance vector analysis of value in the elderly with malnutrition and impaired functional-ity? Nutrition 2007;23:564-9.
10. VanderJagt DJ, Huang Y-S, Chuang L-T, Bonnett C, Glew R H. Phase angle and n-3 polyunsaturated fatty ac-ids in sickle cell disease. Arch Dis Child 2002;87:252-4. 11. Buffa R, Mereu RM, Putzu PF, Floris G, Marini E. Bio-electrical impedance vector analysis detects low body cell mass and dehydration in patients with Alzheimer’s disease. Nutr Health Aging 2010;14:823-7.
12. Buffa R, Floris G, Marini E. Migration of the bioel-ectrical impedance vector in healthy elderly subjects. Nutrition 2003;19:917-21.
13. WHO. Physical status: the use and interpretation of anthropometry. Report of a WHO Expert Committee. WHO Technical Report Series 854. Geneva: World Health Organization, 1995. 452p.
14. Stevens J, Cai J, Pamuk ER, Williamson DF, Thun MJ, Wood JL. The effect of age on the association between body-mass index and mortality. N Engl J Med 1998;338:1-7.
15. Cabrera MA, Wajngarten M, Gebara OC, Diament J. Relationship between body mass index, waist circum-ference, and waist-to-hip ratio and mortality in elderly women: a 5-year follow-up study. Cad Saúde Pública 2005;21:767-75.
16. Troiano RP, Grongiollo EA Jr, Sobal J, Levitsky DA. The relation between body weight and mortality: a quantitative analysis of combined information from existing studies. Int J Obes Relat Metab Disord 1996;20(1):63-75
17. Organización Panamericana de la Salud. División de Promoción y Protección de la Salud (HPP). En-cuesta multicentrica salud bienestar y envejecimiento (SABE) en América Latina: informe preliminar. Washington, D.C; Organización Panamericana de la Salud; 2001. 19 p.
18. Bauman A, Craig CL. The place of physical activity in the WHO Global Strategy on Diet and Physical Activity. Int J Behav Nutr Phys Act. 2005; 24(2):10. 19. Matsudo S, Araújo T, Matsudo V, Andrade D,
Ol-iveira LC, Braggion G. Questionário Internacional de Atividade Física (IPAQ): estudo de validade e reprodutibilidade no Brasil. Rev Bras Ativ Fis Saúde 2001;6:5-18.
20. Lean MEJ, Hans TS, Morrison CE. Waist circumfer-ence as measure for indicating need for weight manage-ment. Br J Med 1995;311:158-61.
21. Lohman T, Roche AF, Martorell R, editors. Anthropo-metric standardization reference manual. Champaign: Human Kinetics; 1988.
22. Piccoli A Pastori G. BIVA Software. Department of Medical and Surgical Sciences, University of Padova, Italy.2002
23. Manini TM. Energy expenditure and aging. Ageing Res Rev 2010;9(1):1-11.
26. Ribeiro SM, dos Santos ZA, da Silva RJ, Louzada E, Donato J Jr, Tirapegui J. Leptin: aspects on energetic balance, physical exercise and athletic amenorhea. Arq Bras Endocrinol Metabol 2007;51:11-24.
27. Giovannini S, Marzetti E, Borst SE, Leeuwenburgh C. Modulation of GH/IGF-1 axis: potential strategies to counteract sarcopenia in older adults. Mech Ageing Dev 2008;129(10):593-601.
28. Stenholm S, Sallinen J, Koster A, Rantanen T, Sainio P, Heliövaara M et al. Association between Obesity History and Hand Grip Strength in Older Adults—Ex-ploring the Roles of Inlammation and Insulin Resist-ance as Mediating Factors. J Gerontol A Biol Sci Med Sci 2011;66A:341-8.
and following exercise-induced muscle injury. Am J Physiol Regul Integr Comp Physiol 2010;298:R1485-95.
Endereço para correspondência
Sandra M L Ribeiro Universidade de São Paulo.
Escola de Artes, Ciências e Humanidades Av. Arlindo Bettio 1000