The
σ
phase formation in annealed UNS S31803 duplex
stainless steel: Texture aspects
C.M. Souza Jr.
a,⁎
, H.F.G. Abreu
b, S.S.M. Tavares
c, J.M.A. Rebello
aaUniversidade Federal do Rio de Janeiro, Departamento de Engenharia Metalúrgica e de Materiais, Brazil
b
Universidade Federal do Ceará, Departamento de Engenharia Metalúrgica e de Materiais, Campus do Pici Bl. 702, Fortaleza, CE, CEP 60.455-760, Brazil
cUniversidade Federal Fluminense, Departamento de Engenharia Mecânica, Brazil
A R T I C L E D A T A
A B S T R A C T
Article history:
Received 4 July 2007 Received in revised form 9 November 2007
Accepted 9 November 2007
The influence of sigma phase precipitation on the texture of austenite in a duplex stainless steel UNS S31803 was investigated. Sigma phase quantification was precisely performed by electron backscattered scanning diffraction (EBSD) for some conditions. It was found that the increase of the sigma phase precipitation enhances the amount of Brass texture in the austenite phase.
© 2007 Elsevier Inc. All rights reserved.
Keywords:
Texture Sigma phase EBSD
1.
Introduction
Duplex stainless steels (DSS) are corrosion resistant alloys for special applications in the chemical, petrochemical and nuclear industries. The grain refinement promoted by the duplex struc-ture and the alloying elements provide higher mechanical strength than austenitic and ferritic grades such as AISI 304 and AISI 430, respectively. These alloys when exposed to tempera-tures between 600 °C and 1000 °C form undesirable phases such as
σandχ[1]. Sigma phase is an iron–chromium compound with a tetragonal crystal structure[2]. In general, all ferrite stabilizers elements accelerateσformation, especially Mo and Cr[2]. How-ever, large amounts of Ni, which stabilize austenite, retardσ
formation[2].
Some researchers have studied deformation texture in duplex stainless steels. According to Hutchinson et al.[3], the ferrite texture consists mainly of a sharp fibre spread from
(100) [011] to (211) [011] and minor components towards (311) [232] and (322) [241]. They noted in their studies the absence of (111) [uvw] components which usually dominate bcc rolling. The main component in austenite texture is (110) [223] but less sharp than in ferrite phase.
Chen et al.[4]found evidences ofσandχformations after exposure for 5 min to temperatures above 750 °C. Both phases were located preferentially in theγ/δinterfaces[4].
Reick et al. [5] studied the recrystallization process in a deformed-2205 duplex stainless steel and concluded that recrystallization kinetics in ferrite is faster than in austenite. They also observed that the transformation of ferrite toσ-phase and austenite slows down the recrystallization in both ferrite and austenite[5].
Cold rolling induces austenite to martensite transforma-tion in duplex stainless steels. Tavares et al.[6]quantified the amount of martensite by X-ray diffraction and magnetic
⁎Corresponding author.
E-mail address:[email protected](C.M. Souza).
methods and found that 3% of the austenite initially pre-sent was transformed into martensite after 60% reduction, and 20% was transformed with 90% reduction at room temperature.
The purpose of this work is to investigate aspects ofσ-phase texture and also its influence in the crystallographic texture of a UNS S31803 duplex stainless steel.
2.
Experimental
The duplex stainless steel UNS S31803 (composition shown in
Table 1) was received as plates of 2.5 mm in thickness. In the solution treated condition (as-received) the material presented a microstructure with 55% of austenite and 45% of ferrite. Some specimens were cold rolled from 2.50 mm to 1.00 mm corre-sponding to 60% reduction in thickness. Solution treated and cold rolled specimens were aged at 800 °C for 5, 30 and 60 min. After aging the specimens were water quenched to room temperature. Table 2 lists the conditions produced and the specimen identification adopted in this work.
A Philips XL-30 Scanning Electron Microscope with an Oxford Crystal 300 EBSD system was used for microstructural char-acterization. Some specimens prepared by polishing and etching in a 50% KOH solution (3 V, 10 s) were observed by optical microscopy.
X-ray diffraction was carried out in a PHILIPS® diffract-ometer, model X´Pert Pro, in step scan mode with step size of 0.02°, time per step of 3 s and angular interval 35°–105°. Radiation Co Kα(1.7890 Å) with a monocromator was used
with 40 kV and 40 mA. The measurements were made at room temperature in continuous sweeping mode. A spinner was used to minimize the effect of preferred orientation. In order to keep the beam completely on the sample for low incident angles a divergence slit of 1° was used.
Macro-texture measurements were made by X-ray diffrac-tion with Co radiadiffrac-tion measuring three incomplete pole figures for ferrite and for austenite with maximum tilt of 75°. Orientation distribution functions (ODF) were calculated using the ADC method with the Labotex as investigated for the 3 pole figures.
Table 1–Chemical composition (wt.%) of the material
Cr Ni Mo C N
22.3 5.44 2.44 0.02 0.160
Table 2–Specimens identification
Processing conditions Identification
Solution treated (ST) ST
ST + 800 °C/5 min ST-5
ST + 800 °C/30 min ST-30
ST + 800 °C/60 min ST-60
Cold rolled (CR)−60% reduction CR60
CR + 800 °C/5 min CR60-5
CR + 800 °C/30 min CR60-30
CR + 800 °C/60 min CR60-60
Fig. 1–Thermocalc® calculations for weight percentage of
phases as a function of temperature in duplex stainless steel UNS S31803.
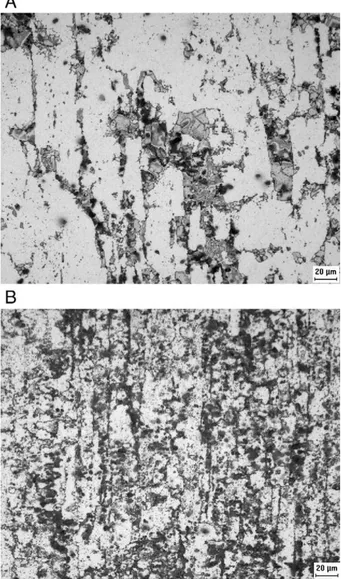
Fig. 2–Optical microscopy of specimens ST-30 and CR60-30.
Thermocalc® software with TCFE3 was used for estimating the amount of each phase in each temperature. TCFE3 is a database of Thermocalc® recently developed which includes sigma phase parameters.
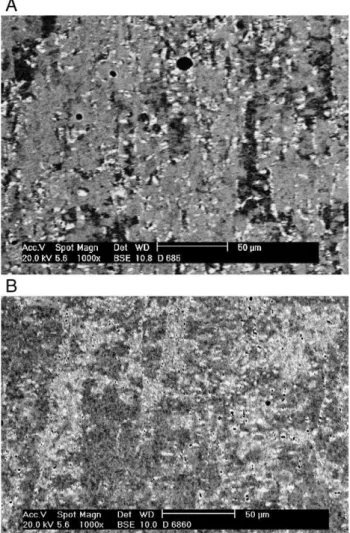
Fig. 3–SEM images using backscattered electron mode: (A)
specimen CR60-5; (B) specimen CR60-60.
Fig. 4–X-ray diffraction patterns from specimens CR60,
CR60-5 and CR60-60.
Fig. 5–EBSD phase maps from specimens ST-5, ST-60 and
3.
Results
Fig. 1shows all phases expected between 500 °C and 1100 °C calculated with Thermocalc® for the DSS UNS S31803 with average composition. This curve shows the amounts of phases present in the material at equilibrium. At 800 °C the amount of
σphase is maximum (~30%) and ferrite has almost completely consumed into theδ→σ+γreaction. Experimental previous
works[7,8]have shown thatσphase formation occurs in the
600–1000 °C range. According to the TTT diagrams the maximum kinetics of transformation is between 800 °C and 900 °C. Due to these observations the temperature of 800 °C was chosen for this study.
The amount of sigma phase formed on aging is strongly influenced by previous cold work.Fig. 2A and B compare the microstructures of specimens ST-30 and CR60-30. Theσ-phase
corresponds to the darkest areas in both figures.
The amount ofσ-phase also increases with time at 800 °C, as expected.Fig. 3A and B compare the backscattered electron images of specimens CR60-5 and CR60-60. In these figures the darkest phase is ferrite, the lightest one isσand the medium
gray and more abundant is austenite. In the specimen aged for 60 min (Fig. 3B) ferrite is not observed, in accordance to the Thermocalc® predictions (Fig. 1).
Fig. 4shows the X-ray diffraction patterns for specimens cold rolled 60% (CR60), cold rolled and aged for 5 min (CR60-5) and 60 min (CR60-60). The results confirm the decrease of ferrite and the increase ofσwith time of exposition at 800 °C.
Fig. 5A, B and C show the phase maps obtained by EBSD for specimens ST-5, ST-60 and CR60-60, respectively. In these figures, the dark gray phase isσ-phase, light gray is ferrite and
the white one is austenite. Quantification is performed through the analysis of these figures. EBSD technique was used to quantify the amount of phases in 4 conditions investigated. The samples aged without previous deformation are easy to quantify, but the ones cold rolled 60% and aged are very difficult to obtain good pattern by EBSD. The number of unsolved points strongly increases with the work hardening produced in the material before aging. This is the main limitation of the quantification by EBSD. In this present study the quantification of cold rolled specimens was only obtained with an acceptable quality in the sample aged for 60 min at 800 °C (CR60-60,Fig. 5C), probably because some recrystaliza-tion has occurred at this condirecrystaliza-tion.Table 3shows the amounts ofσ, ferrite and austenite in the 4 conditions analyzed.
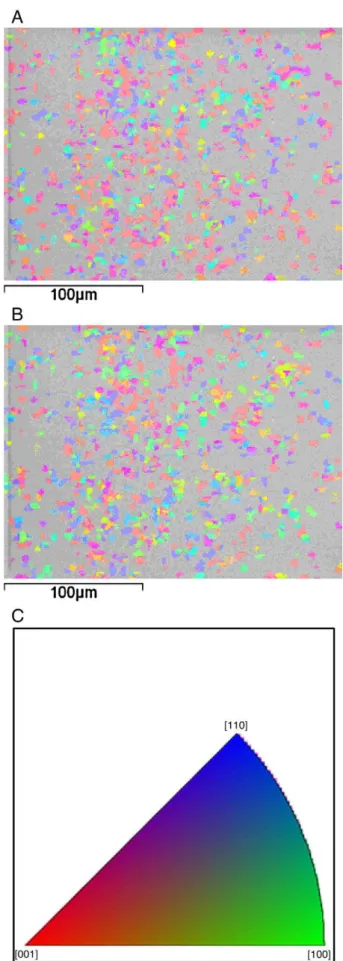
Fig. 6A and B show the EBSD orientation maps forσphase in sample CR60-60 in normal and rolling directions, respec-tively. It is observed that theσ-phase does not present a sharp
texture component, since the three colors (blue, red and green) are balanced in both maps. On the other hand, a macro-texture
Table 3–Weight percentages ofσ, austenite and ferrite for samples ST-5, ST30, ST-60 and CR60-60
Condition %σ % ferrite % austenite % unsolved points
ST-5 0.4 39.3 59.9 0.5
ST-30 4.6 30.4 64.2 0.8
ST-60 16.3 14.0 66.8 2.8
CR60-60 27.7 1.8 69.6 0.9
Fig. 6–EBSD orientation map forσ-phase in specimen
CR60-60: (A) normal direction; (B) rolling direction; (C) Key map orientation.
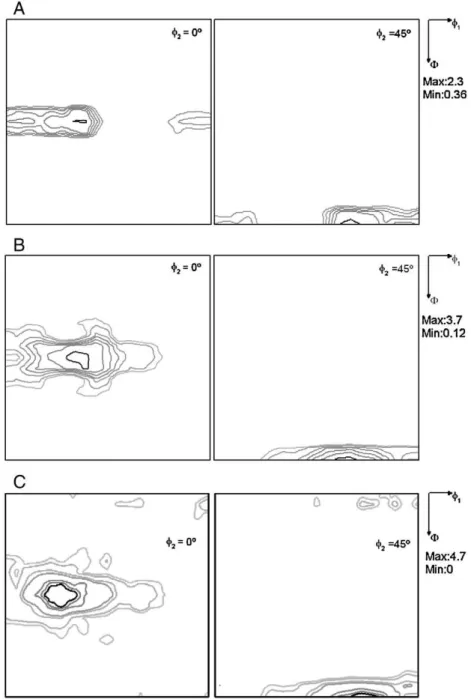
study by XRD diffraction in samples cold rolled and aged (CR60-5, CR60-30, CR60-60) shows that the increase of the amount ofσ
-phase changes the austenite texture according toFig. 7. The effect is the increasing of the Brass component of texture (110) [112] from an intensity of 1, in the un-aged specimen, to 4, in the one aged at 800 °C for 1 h.Fig. 8shows the evolution of Brass texture component with time exposed at 800 °C.
4.
Conclusions
Sigma phase precipitation at 800 °C was enhanced by previous cold rolling. Precise phase quantifications by EBSD were performed in specimens solution treated and aged at 800 °C and in the specimen cold rolled 60% and aged at 800 °C for
60 min. Although sigma phase does not present any preferential orientation, the austenite phase shows an increasing Brass texture with the increase of time of exposure at 800 °C, which is clearly related to sigma phase precipitation at this temperature.
R E F E R E N C E S
[1] Solomon HD, Devine TM. Duplex stainless steels. Metals Park, OH: American Society for Metals; 1983. p. 693–756.
[2] Sigma phase embrittlement. In: ASM International Handbook Committee, editor. ASM Handbook—properties and selection irons steels and high performance alloy, vol. 1; 1993. p. 1657. [3] Hutchinson WB, Schlippenbach UV, Jonson J. Texture and
anysotropy in duplex stainless steel SS2377. Proceedings of Duplex Stainless Steel 1986; vol. 1–2:13–7.
[4] Chen TH, Weng HL, Yang JR. The effect of high-temperature exposure on the microstructural stability and toughness property in a 2205 duplex stainless steel. Mater Sci Eng 2002; 338(1–2):259–70.
[5] Reick W, Pohl M, Padilha AF. Recrystallization–transformation combined reactions during annealing of a cold rolled ferritic–
austenitic duplex stainless steel. ISIJ Int 1998; 38(6):567–71. [6] Tavares SSM, Silva MR, Pardal JM, Abreu HFG, Gomes AM.
Microstructural changes produced by plastic deformation in
the UNS S31803 duplex stainless steel. J Mater Process Technol 2006; 180:318–22.
[7] Chen TH, Weng KL, Yang JR. The effect of high temperature exposure on the microstructural stability and toughness property in a 2205 duplex stainless steel. Mater Sci Eng 2002; A338:259–70.
[8] Gunn RN. Duplex stainless steels-microstructure, properties and applications. Cambridge: Abbington Publishing; 2003.
Fig. 8–Evolution of Brass texture component with time of exposition at 800 °C.