3 (1-x) x 3 (1-x) x 3
*e-mail: [email protected]
Synthesis and Characterization of LaNiO
3, LaNi
(1-x)Fe
xO
3and
LaNi
(1-x)Co
xO
3Perovskite Oxides for Catalysis Application
Sania Maria de Lima, José Mansur Assaf*
Departamento de Engenharia Química, Universidade Federal de São Carlos, Rodovia Washington Luís Km 235, 13565-905 São Carlos – SP, Brazil
Received: September 27, 2001; Revised: July 10, 2002
Mixed metal oxides with perovskite-type structure show a great potential to be used in cataly-sis, electrocatalysis and electronic ceramics. Perovskites oxides catalysts with the composition
LaNiO3, LaNi(1-x)FexO3 and LaNi(1-x)CoxO3 (x = 0.4 and 0.7) have been synthesized by the
precipita-tion method to be used in the methane reforming to produce hydrogen and synthesis gas. The compounds were characterized by X-ray diffraction, thermogravimetric and differential thermal analysis, inductively coupled plasma atomic emission spectroscopy, surface area measurements, energy dispersive X-ray spectrometry coupled to scanning electron microscopy and temperature programmed reduction. The results showed that a suitable combination of the preparation method with calcination variables (time and temperature) could result in oxides with the desired structure and with important properties at the application point of view in heterogeneous catalysis.
Keywords:LaNiO3 , Perovskite, precipitation, catalysis
1. Introduction
The methane steam and CO2 reforming are endothermic processes for the manufacture of syngas and hydrogen with molar ratio H2/CO between 1 and 31. They are used in in-dustry for the methanol, Fischer-Tropsch and ammonia syn-thesis. The first detailed study of the catalytic reaction be-tween steam and methane was published in 19242. It was subsequently found out that many metals including nickel, cobalt, iron and the platinum group metals could catalyze these reactions. These are the most important industrial proc-esses for the production of carbon monoxide and hydro-gen3.
Ni catalysts, a cheap and high active metal, have been applied in methane reforming for the production of hydro-gen. However, it tends to lose the catalytic activity because of coke formation4. It is possible to modify this behavior by adding oxides of alkaline earth and alkaline metals with high basicity5-7. From this point of view, Ni-containing perovskites-type oxides are an alternative of great interest once it has properties that can be modified by changes in the chemical composition8. Meadowcroft first reported the use of perovskite-type oxides as catalysts in 19709 for the electrochemical reduction of oxygen. Soon after that,
Voorhoeve et al.10 reported the high catalytic activity of perovskite oxides for heterogeneous oxidation. These stud-ies triggered many other works.
The perovskite lattice can accommodate multiple cati-onic substitutions with only small changes and in conse-quence, several properties of the solid, such as sintering and catalytic performance can be modified. Those oxides are represented by the general formula ABO3 in which A ions can be rare earth, alkaline earth and alkali that fit into dodecahedral site of the framework, and the B ions can be 3d, 4d and 5d transitional metal ions which occupy the oc-tahedral sites11. These solids are resistant to high tempera-tures, they are mechanically and chemically stable in the reaction medium and show interesting dielectric and con-ductor properties8.
atmos-phere13. Slagtern et al.14,15 studied the reduction properties of substituted perovskite with a non-reductive element and suggested that a progressive reduction of the structure from mixed oxides occurs where Ni is stabilized. Slagtern e Olsbye16 studied the addition of a third metal into the perovskite structure to stabilize the catalytic system in reductive atmosphere and to limit the metal particle growth. Aiming at the stabilization of perovskite structure un-der reductive atmosphere, this work has studied the effect of the preparation variables of LaNiO3, LaNi(1-x)FexO3 and LaNi(1-x)CoxO3 (x = 0.4 and 0.7) perovskite-type oxides for potential applications in the methane reforming reactions. The elements La, Ni, Fe, Co were chosen according to the literature. Lanthanum is a rare earth that stabilizes the struc-ture and prevents coke formation, nickel is very active in the methane reforming reactions and the metals Fe and Co present ionic radius close to that of Ni.
2. Experimental
The LaNiO3, LaNi(1-x)FexO3 and LaNi(1-x)CoxO3 (x = 0.4 e 0.7) perovskite oxides were prepared by precipitation employing two methods. In method 1, an aqueous solution of sodium carbonate (used in excess) was slowly added to the solution containing equimolar quantities of nitrates of La (Riedel-deHaën) and Ni (Aldrich), with Fe or Co ni-trates (Merck) in the required amounts. The precipitate formed was washed thoroughly with approximately 2.0 l of distilled water and then filtered and dried at 60 °C for 20 h. After drying, the filtered precipitate was heated for 3 h at 550 °C in air and calcined in different conditions at 800 °C for 5 h or at 900 °C for 5 h, 10 h and 15 h. In method 2, the solution of nitrates was quickly added to the solution of sodium carbonate. The washing, drying and calcination processes were similar to the ones in the previous method. The catalysts were characterized by X-ray powder dif-fraction (XRD) on a Siemens diffractometer D-5005 by using nickel-filtered CuKα radiation for the determination
of the final structure. Derivative thermogravimetric and dif-ferential thermal analyses (DTGA and DTA) were per-formed in an analyzer TA Instruments - SDT 2960 in order to determine phase changes and loss of mass during the calcination process. The amounts of La, Ni, Fe and Co in the compounds were measured by inductively coupled plasma atomic emission spectroscopy (ICP-AES) on a spectrometer VISTA - VARIAN. The surface area of the perovskite was measured by N2 adsorption - BET (Brunauer-Emmett-Teller) method in Quantachrome NOVA 1200. Scanning electron microscopy (SEM) was performed in order to determine the particle size and morphology of the perovskite by using a STEREOSCAN 440 - LEO micro-scope. Energy dispersive X-ray spectrometry (EDS) on OX-FORD EXL II analyzer was performed coupled with the
SEM to gather information about the distribution of single elements in the perovskite phase. Temperature programmed reduction (TPR) was carried out on Micromeritics Pulse Chemisorb 2705 using 30 mg of sample placed in a U-shaped quartz reactor with heating rate of 10 °C.min-1 at room temperature of up to 1000 °C. The samples were preheated before analysis with He, flow rate of 30 ml.min-1 for 1 h at 250 °C, to eliminate adsorbed water. The reductive gas used was a mixture of 5% H2/N2 with total flow of 30 ml.min-1. This technique aims at obtaining information on the reduction of the oxides species. During the analysis the flow of a reductive gas in the sample takes place, under controlled conditions of flow rate and pressure, while the temperature is increased evenly. The amount of hydrogen consumed during the reduction of the oxidized species is measured by a thermal conductivity detector, thus obtain-ing a qualitative vision of the reduction of the sample and informing the number of reduced species.
3. Results and discussion
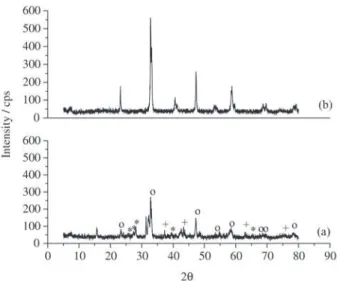
The methods 1 and 2 were employed to prepare the perovskite samples that were calcined at 900 °C for 10 h. The XRD diagrams of the oxides prepared according to method 1 showed the formation of other compounds such as NiO and La2O3 besides the perovskite structure, whereas in method 2 the perovskite structure was the only phase observed (Fig. 1). In method 1, as a consequence of the slow addition of the solution of carbonate over the nitrates solutions, a selective precipitation could be occurring, where the lanthanum carbonate, precipitating in lower pH, would be formed first and the precipitation of the nickel carbonate would only have occurred after the end of first
precipita-Figure 1. XRD diagrams of LaNiO3 perovskite calcined at 900 °C
3 (1-x) x 3 (1-x) x 3
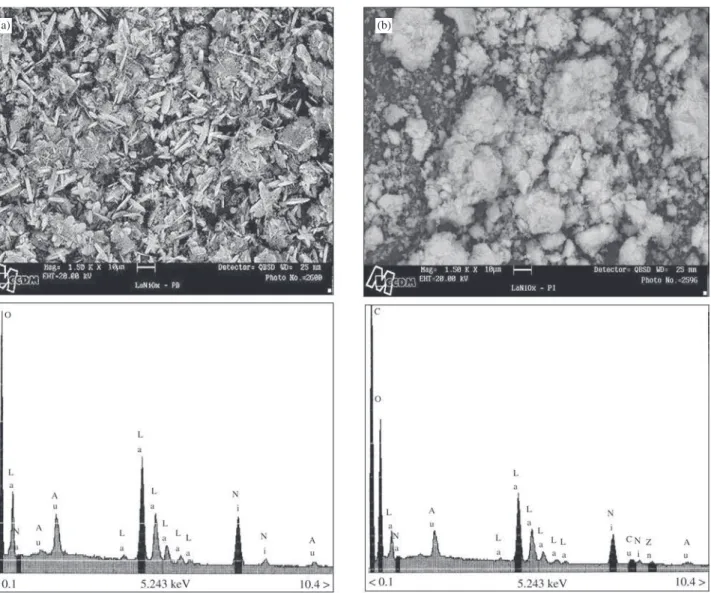
tion, when the pH reached higher values. As this precipita-tion was performed slow and selectively, it resulted in larger solid particles of homogeneous composition, preventing the subsequent reaction in the solid state for formation of the perovskite structure. This hypothesis is supported by SEM/ EDS analysis of the precursors of LaNiO3 perovskite ox-ides prepared according to the two methods (Fig. 2).
The results in Fig. 2 clearly show that the structure ob-tained by method 1 is quite heterogeneous, with well-ar-ranged La rich particles and with other regions where the amounts of Ni and La are closer to the ideal ones for the synthesis of perovskite oxides.
As well-defined particles, with different shapes from the expected ones for perovskite, were observed, a new EDS analysis was done, scanning only one particle. The selected particle is indicated in the micrograph presented in Fig. 3a.
An amount of La observed was greater than the amount of Ni (Fig. 3b), confirming the presence of lanthanum oxide separated from the structure after calcination.
Aiming at obtaining solids with homogeneous compo-sition and perovskite structure as the only phase, the other catalysts were prepared by method 2 only.
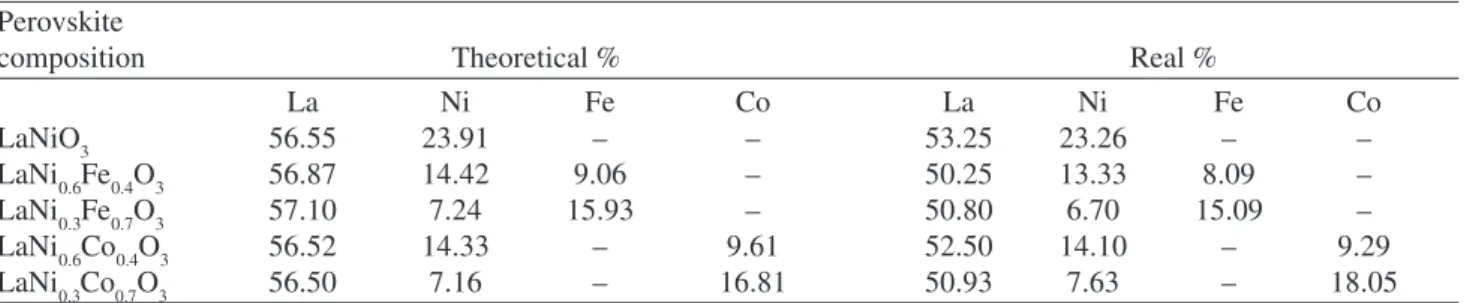
The amounts of metals in the perovskite oxides prepared by method 2, determined by plasma spectroscopy, presents a good balance between the theoretical and experimental values. Those results are shown in Table 1.
The XRD diagrams of LaNiO3, LaNi(1-x)FexO3 and LaNi(1-x)CoxO3 (x = 0.4 and 0.7) oxides were compared with the position and relative intensity patterns of the pure mate-rials18. In each case the formation of a single phase with the perovskite structure was confirmed for the oxides prepared by method 2. The diagrams for the LaNiO3 structure with
Figure 2. Scanning electron microscopy coupled to energy dispersive X-ray spectrometry for LaNiO3 precursor. a) method 1, b) method 2.
varied calcination time and temperature are shown in Fig. 4. At 800 °C, the perovskite structure was obtained and by increasing the temperature and the time of calcination, the structure was closer to the standard, showing that a greater severity in the calcination conditions makes it closer to the standard phase with hexagonal structure. Rakshit and Gopalakrishnan (1994)19 have synthesized LaNiO
3 perovskites and observed the perovskite structure as the only phase, with cubic structure, for samples calcined at 800 °C for 4 h. They found out that when increasing the time of calcination at this same temperature, there was a gradual conversion from the cubic to the hexagonal phase, which involved a continuous but small loss of oxygen and a gradual increase in the angle from 90° in the cubic phase to about 90°43’, going through a transient rhombohedral phase un-til the complete transformation into the hexagonal phase. Thus, the calcined perovskite at 800 °C is closer to the cu-bic phase than hexagonal, undergoing transformation to the hexagonal phase with the increase of the calcination tem-perature and time.
Table 1. Inductively coupled plasma atomic emission spectroscopy analyses.
Perovskite
composition Theoretical % Real %
La Ni Fe Co La Ni Fe Co
LaNiO3 56.55 23.91 – – 53.25 23.26 – –
LaNi0.6Fe0.4O3 56.87 14.42 9.06 – 50.25 13.33 8.09 –
LaNi0.3Fe0.7O3 57.10 7.24 15.93 – 50.80 6.70 15.09 –
LaNi0.6Co0.4O3 56.52 14.33 – 9.61 52.50 14.10 – 9.29
LaNi0.3Co0.7O3 56.50 7.16 – 16.81 50.93 7.63 – 18.05
Figure 3. LaNiO3 precursor - method 1. a) Scanning electron microscopy micrograph of particle 1, b) energy dispersive X-ray spectrometry of particle 1.
Figure 4. XRD diagrams of LaNiO3 perovskites calcined at a)
800 °C - 5 h, b) 900 °C - 5 h, c) 900 °C - 10 h, d) 900 °C - 15 h.
3 (1-x) x 3 (1-x) x 3
Figure 5. XRD diagrams of perovskites calcined at 900 °C for 10 h. a) LaNi(1-x)FexO3; b) LaNi(1-x)CoxO3 (x = 0.0, 0.4 and 0.7). Table 2. Surface area of LaNi(1-x)FexO3 perovskite oxides.
Temperature (°C)* Time (h)* Surface area (m2 g-1)
LaNiO3 LaNi0.6Fe0.4O3 LaNi0.3Fe0.7O3 LaNi0.6Co0.4O3 LaNi0.3Co0.7O3
800 5 10.3 8.6 3.6 8.0 4.9
900 5 4.8 5.3 2.2 3.6 2.0
900 10 3.8 4.4 2.6 2.1 1.5
900 15 3.4 4.3 2.4 2.3 1.7
* Conditions of calcinations.
XRD diagrams of the perovskites with partial substitu-tion of Ni by Fe and Co are presented in Fig. 5. In Figure 5a, the XRD shows that the substitution of Ni for Fe slowly dislocates the diffraction peaks to the left, together with a weak increase of intensity. According to Provendier et al.13 this indicates the formation of a solid solution of LaFeO3 and LaNiO3 in all proportions. On the other hand, the addi-tion of Co (Fig. 5b) to substitute part of Ni in the perovskite structure results in double peaks in the most intense diffrac-tion posidiffrac-tion, which would be indicating the formadiffrac-tion of a more complex structure, in which LaNiO3 and LaCoO3 co-exist.
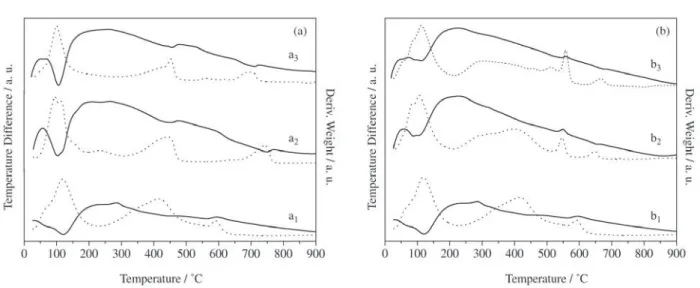
The DTGA-DTA curves of the precursors are shown in Fig. 6. The measured weight loss percentage for all the ox-ides was of approximately 40% at room temperature of up to 625-710 °C. The DTA curves showed the predominance of endothermic transformations. Three peaks were observed at 100-120 °C, 420-450 °C and 590-745 °C assigned to the removal of hydration water and decomposition of metal ni-trates, respectively. The last transformation of the oxides
occurs at a maximum temperature of approximately 725 °C that would be the final rearrange of the oxides, with the formation of the perovskite structure.
Figure 7 shows TPR profiles of the perovskites prepared by method 1 and calcined at 900 °C for 10 h. The LaNiO3 perovskite presents two reduction peaks (Fig. 7a). The first one, with a maximum at 389 °C corresponds to the reduc-tion of Ni3+ to Ni2+ with formation of the La
2Ni2O5 struc-ture. The second peak with a maximum at 493 °C corre-sponds to the reduction of Ni2+ to Ni0, which remain depos-ited on lanthanum oxide. The first reduction peak is similar for all oxides containing nickel, even though the tempera-ture of the maximum hydrogen consumption decreases with an increasing x, because the amount of Ni is decreasing. For x = 0.4, a wide band of reduction was observed, with the dislocation of the second peak to the right as a conse-quence of the formation of a more stable compound. This
peak shifts from 493 °C (LaNiO3) up to approximately 1020 °C (LaNi0.3Fe0.7O3). According to Provendier et al.13 during this second reduction step, the nickel and part of the iron are reduced to metals and form a Ni-Fe alloy. The re-duction of Ni and Fe has been studied by in situ magnetiza-tion and Mössbauer spectroscopy17 and these methods con-firm the results of TPR.
It must be observed in Fig. 7b that the addition of cobalt affect the first reduction peak, with the temperature of maxi-mum hydrogen consumption decreasing with the increase of x. The second reduction peak shifts from 493 °C (LaNiO3) up to 578 °C (x = 0.7), showing that the addition of cobalt has a lower influence in the stability of the nickel when compared to the effect of the addition of the iron.
Figure 6. DTGA-DTA curves of the precursors. a) LaNi(1-x)FexO3, (a1) x = 0, (a2) x = 0.4, (a3) x = 0.7. b) LaNi(1-x)CoxO3, (b1) x = 0, (b2)
x = 0.4, (b3) x = 0.7. [] DTA; [....] DTGA.
Figure 7. Temperature programmed reduction profiles of perovskites calcined at 900 °C for 10 h. a) LaNi(1-x)FexO3, (a1) x = 0.0, (a2)
3 (1-x) x 3 (1-x) x 3
4. Conclusion
A relatively simple procedure, such as the precipitation method, can result in success if the selective precipitation of the metal oxides other than the perovskite is avoided by choosing the correct way of mixing the salt solutions. At calcination temperatures as low as 800 °C it was possible to observe the formation of the desired structure, which be-came slightly more crystalline and closer to the standard phase for higher times and temperatures of calcination. The synthesis of the perovskite oxides at this temperature presents as an advantage, from the point of view of cataly-sis application, a greater value of specific surface area.
The addition of Fe and Co in the LaNiO3 perovskite structure resulted in more stability in reductive atmosphere as showed in the TPR analysis, with prominence for the effect of iron. This larger stability enables the use of these oxides as catalysts in methane reforming reactions at high temperatures and in presence of H2.
References
1. Choudhary, V.R.; Uphade, B.S.; Belhekar, A.A. Journal of Catalysis, v. 163, p.312-318, 1996.
2. Neumann, B.; Jacob, K. Z. Elektrochem., v. 30, p. 557, 1924.
3. Tsang, S.C.; Claridge, J.B.; Green, M.L.H. Catalysis To-day, v. 23, p. 3, 1995.
4. Nam, J.W.; Chae, H.; Lee, S.H.; Jung, H.; Lee, K.Y., Stud-ies in Surface Science and Catalysis: Natural Gas Con-version V, v. 119, p. 843-848, 1998.
5. Ruckenstein, E.; Hu, Y.H. Applied Catalysis A: General, v. 133, p.149, 1995.
6. Tang, S.B.; Qiu, F.L.; Lu, S.J. Catalysis Today, v. 24, p.
253, 1995.
7. Horiuchi, T.; Sakuma, K.; Fukui, T.; Kubo, Y.; Osaki, T.; Mori, T. Applied Catalysis A: General, v. 144, p. 111, 1996.
8. Goldwasser, M.R.; Pietri, E.; Barrios, A.; González, O.; Pérez-Zurita, M.J.; Cubeiro, M.L. Actas do XVII Simpósio Ibero-Americano de Catálise, Porto, Portugal, p. 51, julho 2000.
9. Meadowcroft, D.B. Nature, London, v. 226, p. 847, 1970. 10. Voorhoeve, R.J.H.; Remeika, J.P.; Freeland, P.E.;
Mathias, B.T. Science, v. 177, p. 353, 1972.
11. Twu, J.; Gallagher, P.K. Properties and Applications of Perovskite-Type Oxides, Marcel Dekker, Inc., p. 1-2, 1993.
12. Swaan, H.M.; Rouanet, R.; Widyananda, P.; Mirodatos, C. Study Surface Science Catalysis, v. 107, p. 107, 1997. 13. Provendier, H.; Petit, C.; Estournès, C.; Libs, S.; Kiennemann, A. Applied Catalysis A: General, v. 180, p. 163-173, 1999.
14. Slagtern, A.; Olsbye, U.; Blom, R.; Dahl, I.M.; Fjellvag, H. Applied Catalysis A: General, v. 145, p. 375, 1996. 15. Slagtern, A.; Olsbye, U.; Blom, R.; Dahl, I.M.; Fjellvag,
H. Applied Catalysis A: General, v. 165, p. 379, 1997. 16. Slagtern, A.; Olsbye, U. Applied Catalysis A: General,
v. 110, p. 99, 1994.
17. Provendier, H.; Petit, C.; Estournes, C.; Kiennemann, A. Studies in Surface Science and Catalysis: Natural Gas Conversion V, v. 119, p. 741, 1998.
18. JCPDS - Joint Committee on Powder Diffraction Stand-ards, International Center of Diffraction Data, Pensilvania, USA, 1994.